Cited by 35

The DOI matches its Crossref record; 16 of the 16 references it cites were found in a registry or an index.

Senescence-associated lysosomal dysfunction impairs cystine deprivation-induced lipid peroxidation and ferroptosis

Loo, Tze Mun, Zhou, Xiangyu, Tanaka, Yoko, Sugawara, Sho, Yamauchi, Shota, Kawasaki, Hiroko, Matsuoka, Yuta, Sugiura, Yuki, Sakuma, Shinya, Yamanishi, Yoko, Yotsumoto, Satoshi, Dodo, Kosuke, Shirasaki, Yoshitaka, Kamatani, Takashi, Takahashi, Akiko·2025·Nature Communications

Overview

The claims and statistics of this paper haven’t been checked yet.

Run the check — free, no account needed. It reads the open-access text and checks the sources it cites.

A few free checks a day · papers already verified open instantly · results are public

Integrity signals

Registry

Crossref · 10.1038/s41467-025-61894-9

Cites

16 of 16 references verified0 citation errors · 0 not checkable

Statistics

Figures

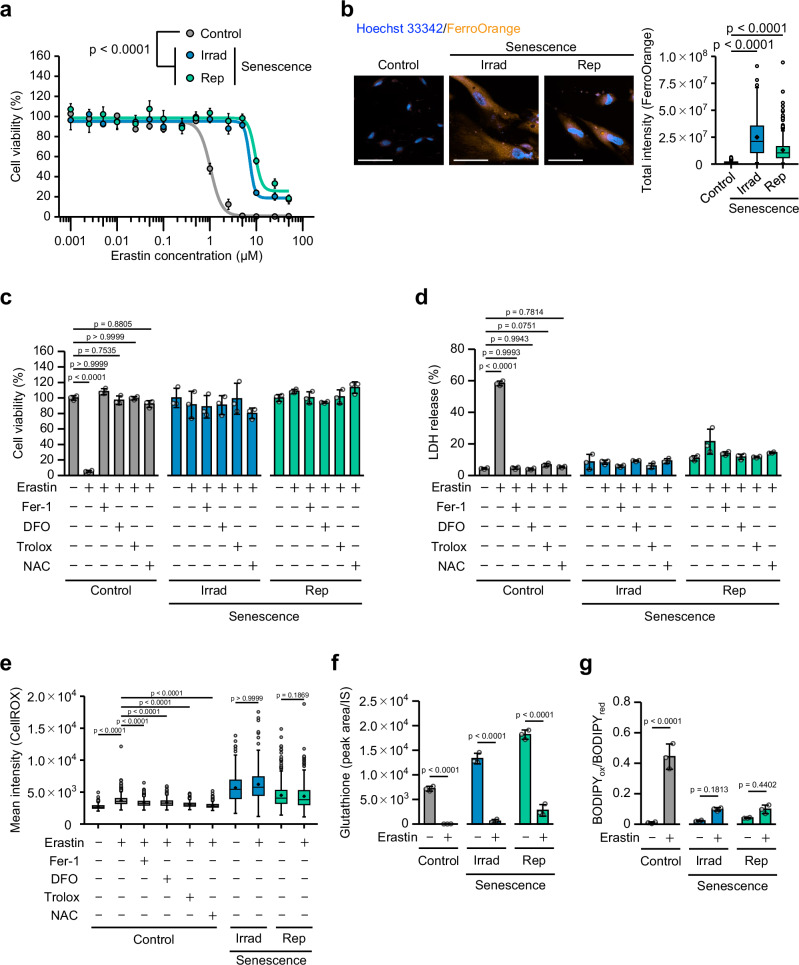
Fig. 1 Senescent cells are resistant to ferroptosis. a Presenescent TIG-3 cells (Control) were rendered senescent by 15 Gy X-ray irradiation (Irrad) or passaging (replicative senescence: Rep). These cells were then subjected to a viability assay after 24 h of culture within varying concentrations of erastin. b Measurement of intracellular free ferrous iron. Representative data from three independent experiments are shown. Scale bar, 100 µm. The box plot indicates the total intensity of FerroOrange staining. c–e Cell viability, LDH release and cytosolic ROS levels of control and senescent (Irrad and Rep) cells after 24 h (c, d) or 7 h (e) of treatment with 5 µM erastin alone or in combination with 500 nM ferrostatin-1 (Fer-1), 100 µM deferoxamine (DFO), 100 µM Trolox or 1 mM N-acetyl cysteine (NAC). f Quantification of the intracellular GSH content after 7 h of treatment with 5 µM erastin. g Lipid peroxidation assessed by C11-BODIPY fluorescence in control and senescent TIG-3 (Irrad and Rep) cells after 7 h of treatment with 5 µM erastin. The ratio of oxidized to reduced BODIPY (BODIPYox/BODIPYred) calculated from the median fluorescence intensity is shown. The data are presented as the mean ± s.d. of n = 3 biological replicates (a, c, d, f, g). For b, e the box represents the interquartile range (IQR), with a horizontal line and a black point indicating the median and mean, respectively. Whiskers extend to the most extreme data points within 1.5 times the IQR from the quartiles. White points beyond this range represent outliers. Statistical analysis was performed via two-way ANOVA with Tukey’s test (a), one-way-ANOVA with Tukey’s test (c, d, f, g), or the Kruskal-Wallis test followed by Dunn’s test (b, e). Source data are provided as a Source Data file.
Fig. 1 Senescent cells are resistant to ferroptosis. a Presenescent TIG-3 cells (Control) were rendered senescent by 15 Gy X-ray irradiation (Irrad) or passaging (replicative senescence: Rep). These cells were then subjected to a viability assay after 24 h of culture within varying concentrations of erastin. b Measurement of intracellular free ferrous iron. Representative data from three independent experiments are shown. Scale bar, 100 µm. The box plot indicates the total intensity of FerroOrange staining. c–e Cell viability, LDH release and cytosolic ROS levels of control and senescent (Irrad and Rep) cells after 24 h (c, d) or 7 h (e) of treatment with 5 µM erastin alone or in combination with 500 nM ferrostatin-1 (Fer-1), 100 µM deferoxamine (DFO), 100 µM Trolox or 1 mM N-acetyl cysteine (NAC). f Quantification of the intracellular GSH content after 7 h of treatment with 5 µM erastin. g Lipid peroxidation assessed by C11-BODIPY fluorescence in control and senescent TIG-3 (Irrad and Rep) cells after 7 h of treatment with 5 µM erastin. The ratio of oxidized to reduced BODIPY (BODIPYox/BODIPYred) calculated from the median fluorescence intensity is shown. The data are presented as the mean ± s.d. of n = 3 biological replicates (a, c, d, f, g). For b, e the box represents the interquartile range (IQR), with a horizontal line and a black point indicating the median and mean, respectively. Whiskers extend to the most extreme data points within 1.5 times the IQR from the quartiles. White points beyond this range represent outliers. Statistical analysis was performed via two-way ANOVA with Tukey’s test (a), one-way-ANOVA with Tukey’s test (c, d, f, g), or the Kruskal-Wallis test followed by Dunn’s test (b, e). Source data are provided as a Source Data file.CC BY-NC-ND · PubMed Central
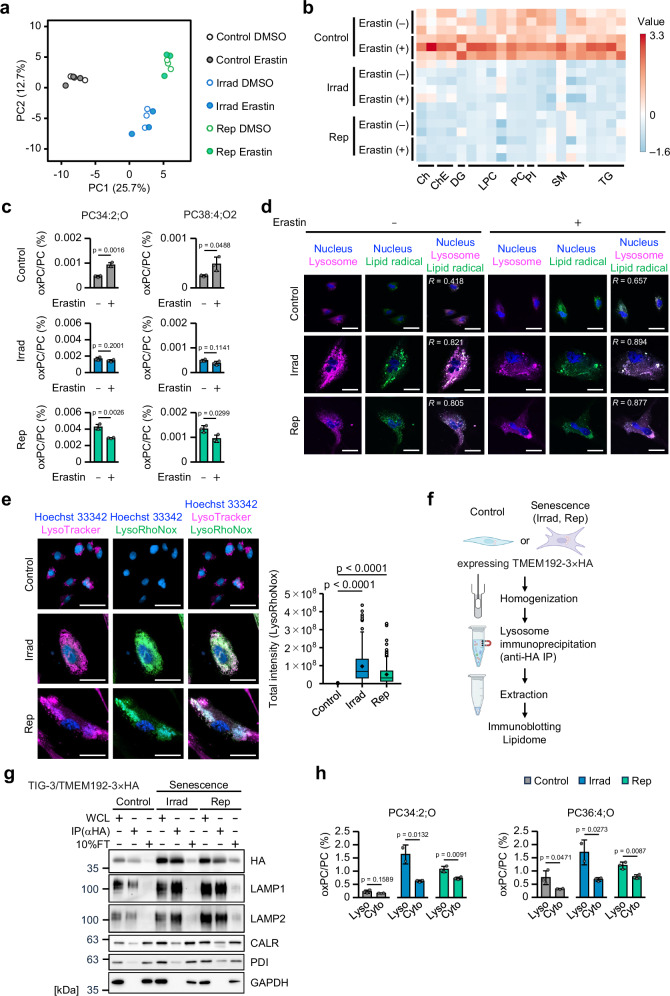
Fig. 2 Aberrant lipid hydroperoxides in senescent cells. a PCA analysis using lipidome data from presenescent (Control) and senescent TIG-3 (Irrad and Rep) cells after 7 h of treatment with vehicle or 5 µM erastin. b Heatmap showing changes in the lipid profiles (two-sample t-test, p < 0.05) of presenescent (Control) and senescent TIG-3 (Irrad and Rep) cells after 7 h of treatment with vehicle or 5 µM erastin. c Percentages of peroxidized PC in presenescent (Control) and senescent TIG-3 (Irrad and Rep) cells after 7 h of treatment with 5 µM erastin. d Fluorescence images of lysosomes [LysoTracker (magenta)], lipid radicals [LipiRADICAL Green (green)], and nuclei [Hoechst 33342 (blue)] in presenescent (Control) and senescent TIG-3 (Irrad and Rep) cells after 7 h of treatment with 5 µM erastin. R represents the Pearson correlation coefficient between the signals of LysoTracker and LipiRADICAL Green. Scale bar, 40 µm. e Measurement of free ferrous iron in lysosome. Scale bar, 50 µm. The box plot indicates the total intensity of LysoRhoNox staining. f Experimental schema describing the lysosomal IP method workflow. Created in BioRender. Takahashi, A. (2025) https://BioRender.com/u1pwsu5. g Immunoblot analysis of lysosome markers (LAMP1 and LAMP2), ER markers (calreticulin; CALR and protein disulfide isomerase; PDI), and a cytoplasmic marker (GAPDH) from whole-cell lysates (WCLs) of TMEM192-3xHA overexpressing TIG-3 cells, purified lysosomes (IP against HA) and 10% flowthrough (FT) of presenescent control and senescent TIG-3 (Irrad and Rep) cells. h Percentage of peroxidized PC in the lysosome or cytosol fraction from presenescent (Control) and senescent TIG-3 (Irrad and Rep) cells. For (c), (h), the data are presents as the mean ± s.d. of n = 3 biological replicates. For (e), the box represents the interquartile range (IQR), with a horizontal line and a black point indicating the median and mean, respectively. Whiskers extend to the most extreme data points within 1.5 times the IQR from the quartiles. White points beyond this range represent outliers. Statistical analysis was performed using the two-sided Welch’s test (c), the Kruskal-Wallis test followed by Dunn’s test (e), and one-way ANOVA with Tukey’s test (h). Source data are provided as a Source Data file.
Fig. 2 Aberrant lipid hydroperoxides in senescent cells. a PCA analysis using lipidome data from presenescent (Control) and senescent TIG-3 (Irrad and Rep) cells after 7 h of treatment with vehicle or 5 µM erastin. b Heatmap showing changes in the lipid profiles (two-sample t-test, p < 0.05) of presenescent (Control) and senescent TIG-3 (Irrad and Rep) cells after 7 h of treatment with vehicle or 5 µM erastin. c Percentages of peroxidized PC in presenescent (Control) and senescent TIG-3 (Irrad and Rep) cells after 7 h of treatment with 5 µM erastin. d Fluorescence images of lysosomes [LysoTracker (magenta)], lipid radicals [LipiRADICAL Green (green)], and nuclei [Hoechst 33342 (blue)] in presenescent (Control) and senescent TIG-3 (Irrad and Rep) cells after 7 h of treatment with 5 µM erastin. R represents the Pearson correlation coefficient between the signals of LysoTracker and LipiRADICAL Green. Scale bar, 40 µm. e Measurement of free ferrous iron in lysosome. Scale bar, 50 µm. The box plot indicates the total intensity of LysoRhoNox staining. f Experimental schema describing the lysosomal IP method workflow. Created in BioRender. Takahashi, A. (2025) https://BioRender.com/u1pwsu5. g Immunoblot analysis of lysosome markers (LAMP1 and LAMP2), ER markers (calreticulin; CALR and protein disulfide isomerase; PDI), and a cytoplasmic marker (GAPDH) from whole-cell lysates (WCLs) of TMEM192-3xHA overexpressing TIG-3 cells, purified lysosomes (IP against HA) and 10% flowthrough (FT) of presenescent control and senescent TIG-3 (Irrad and Rep) cells. h Percentage of peroxidized PC in the lysosome or cytosol fraction from presenescent (Control) and senescent TIG-3 (Irrad and Rep) cells. For (c), (h), the data are presents as the mean ± s.d. of n = 3 biological replicates. For (e), the box represents the interquartile range (IQR), with a horizontal line and a black point indicating the median and mean, respectively. Whiskers extend to the most extreme data points within 1.5 times the IQR from the quartiles. White points beyond this range represent outliers. Statistical analysis was performed using the two-sided Welch’s test (c), the Kruskal-Wallis test followed by Dunn’s test (e), and one-way ANOVA with Tukey’s test (h). Source data are provided as a Source Data file.CC BY-NC-ND · PubMed Central
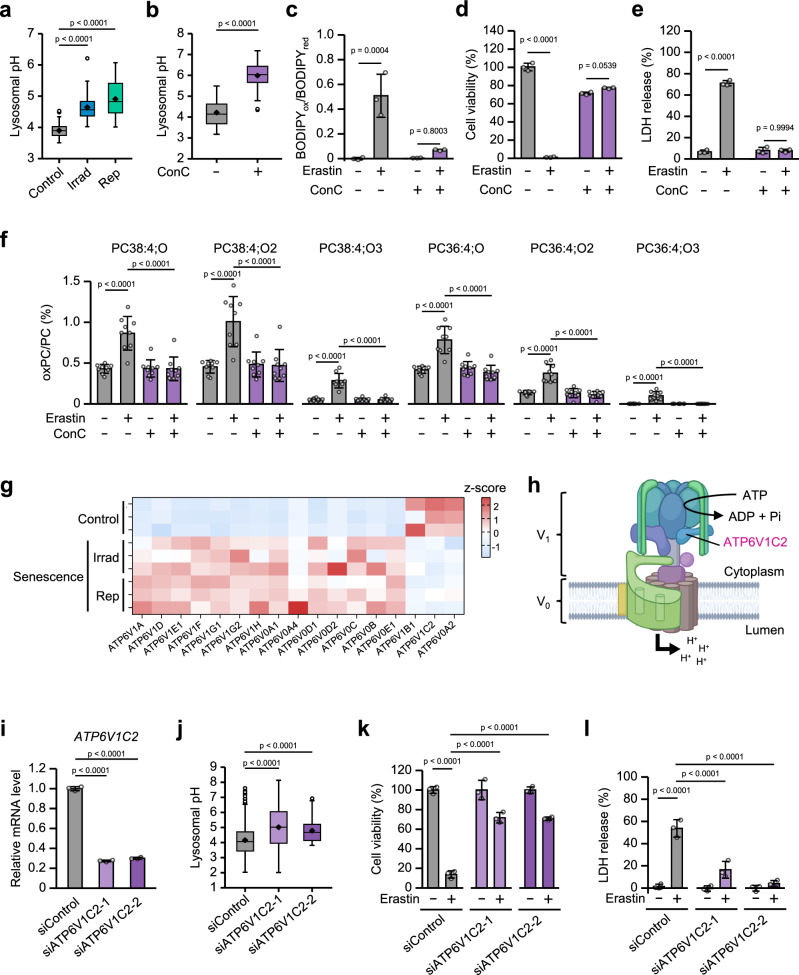
Fig. 3 Downregulation of ATP6V1C2 expression inhibits the induction of ferroptosis in normal cells. a Lysosomal pH in presenescent (Control) and senescent TIG-3 (Irrad and Rep) cells measured by LysoSensor. b–f Presenescent TIG-3 cells were treated with 1 µM concanamycin C (ConC) for 24 h and subjected to lysosomal pH analysis (b) or lipid peroxidation measurement via C11-BODIPY fluorescence (c). The ratio of oxidized to reduced BODIPY (BODIPYox/BODIPYred) calculated from the median fluorescence intensity is shown. The data represent the mean ± s.d. of three independent experiments. d, e Cell viability of and LDH release by TIG-3 cells after 24 h of treatment with 5 µM erastin with or without 1 µM ConC. f Percentage of peroxidized PG, Data are presented as the mean ± s.d. of n = 3 biological replicates. g Heatmap showing changes in the gene expression of V-ATPase components in presenescent (Control) and senescent TIG-3 (Irrad and Rep) cells. h Schematic of V-ATPase. Created in BioRender. Takahashi, A. (2025) https://BioRender.com/lhkt32a. Presenescent TIG-3 cells were subjected to transfection with the indicated siRNA oligos twice (at 2-day intervals). These cells were then subjected to RT‒qPCR analysis (i) and lysosomal pH was measured via LysoSensor (j). Cell viability (k) of and LDH release (l) by siControl- or siATP6V1C2-transfected TIG-3 cells after 24 h of treatment with 5 µM erastin. Data are presented as the mean ± s.d. of n = 3 biological replicates (c–e, k, l). For (a, b, j) the box represents the interquartile range (IQR), with a horizontal line and a black point indicating the median and mean, respectively. Whiskers extend to the most extreme data points within 1.5 times the IQR from the quartiles. White points beyond this range represent outliers. Statistical analysis was performed via the Kruskal-Wallis test followed by Dunn’s test (a, j), the two-sided Mann-Whitney U test (b), and one-way ANOVA with Tukey’s test (c, d, e, f, k, l), and one-way ANOVA with Dunnett’s test (i). Source data are provided as a Source Data file.
Fig. 3 Downregulation of ATP6V1C2 expression inhibits the induction of ferroptosis in normal cells. a Lysosomal pH in presenescent (Control) and senescent TIG-3 (Irrad and Rep) cells measured by LysoSensor. b–f Presenescent TIG-3 cells were treated with 1 µM concanamycin C (ConC) for 24 h and subjected to lysosomal pH analysis (b) or lipid peroxidation measurement via C11-BODIPY fluorescence (c). The ratio of oxidized to reduced BODIPY (BODIPYox/BODIPYred) calculated from the median fluorescence intensity is shown. The data represent the mean ± s.d. of three independent experiments. d, e Cell viability of and LDH release by TIG-3 cells after 24 h of treatment with 5 µM erastin with or without 1 µM ConC. f Percentage of peroxidized PG, Data are presented as the mean ± s.d. of n = 3 biological replicates. g Heatmap showing changes in the gene expression of V-ATPase components in presenescent (Control) and senescent TIG-3 (Irrad and Rep) cells. h Schematic of V-ATPase. Created in BioRender. Takahashi, A. (2025) https://BioRender.com/lhkt32a. Presenescent TIG-3 cells were subjected to transfection with the indicated siRNA oligos twice (at 2-day intervals). These cells were then subjected to RT‒qPCR analysis (i) and lysosomal pH was measured via LysoSensor (j). Cell viability (k) of and LDH release (l) by siControl- or siATP6V1C2-transfected TIG-3 cells after 24 h of treatment with 5 µM erastin. Data are presented as the mean ± s.d. of n = 3 biological replicates (c–e, k, l). For (a, b, j) the box represents the interquartile range (IQR), with a horizontal line and a black point indicating the median and mean, respectively. Whiskers extend to the most extreme data points within 1.5 times the IQR from the quartiles. White points beyond this range represent outliers. Statistical analysis was performed via the Kruskal-Wallis test followed by Dunn’s test (a, j), the two-sided Mann-Whitney U test (b), and one-way ANOVA with Tukey’s test (c, d, e, f, k, l), and one-way ANOVA with Dunnett’s test (i). Source data are provided as a Source Data file.CC BY-NC-ND · PubMed Central
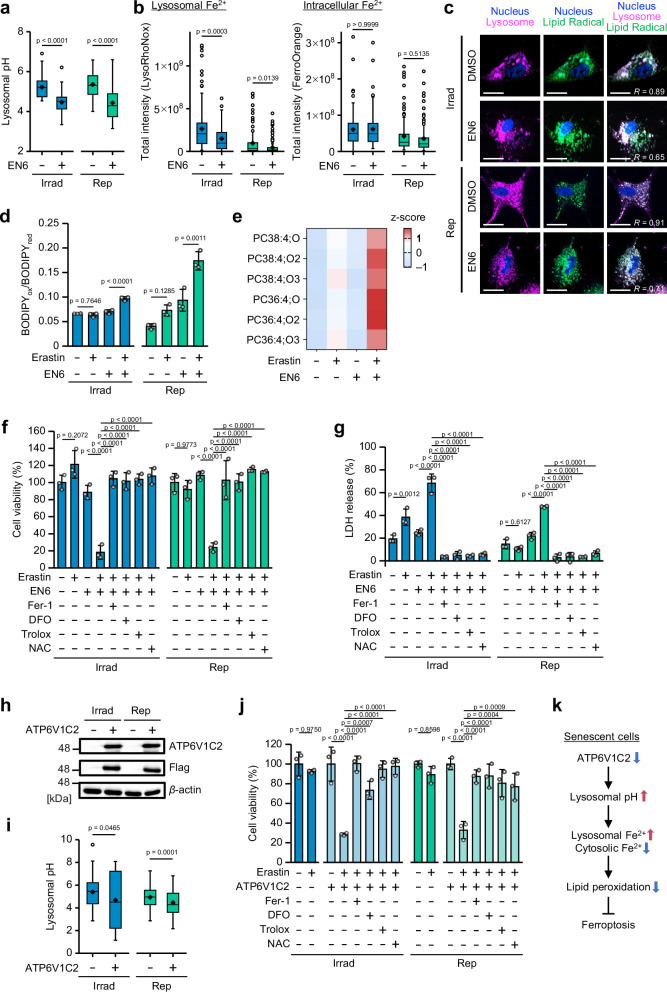
Fig. 4 Acidic lysosomal pH induces ferroptosis in senescent cells. a Lysosomal pH of senescent TIG-3 (Irrad and Rep) cells after 24 h of treatment with or without 50 µM EN6, as measured by LysoSensor. b Measurement of free lysosomal ferrous iron (LysoRhoNox) and intracellular ferrous iron (FerroOrange) in senescent TIG-3 (Irrad and Rep) with or without 50 µM EN6 treatment. The box plot indicates the total intensity of LysoRhoNox staining. c Fluorescence images of lysosomes [LysoTracker (magenta)], lipid radicals [LipiRADICAL Green (green)], and nuclei [Hoechst 33342 (blue)] in senescent TIG-3 (Irrad and Rep) cells after treatment with 50 µM EN6. R represents the Pearson correlation coefficient between the signals of LysoTracker and LipiRADICAL Green. Scale bar, 50 µm. d Lipid peroxidation assessed by C11-BODIPY fluorescence in senescent TIG-3 cells (Irrad and Rep) with or without 2 µM erastin (Irrad), or 5 µM erastin (Rep) in the absence or presence of 50 µM EN6 for 12 h. The ratio of oxidized to reduced BODIPY (BODIPYox/BODIPYred) calculated from the median fluorescence intensity is shown. e Heatmap of peroxidized PC in senescent TIG-3 cells (Irrad) after 14 h of treatment with or without 5 µM erastin in the absence or presence of 50 µM EN6. f, g Cell viability of and LDH release by senescent TIG-3 (Irrad and Rep) cells after 24 h of treatment with or without 5 µM erastin in the absence or presence of 50 µM EN6 and with or without Fer-1 (500 nM), DFO (100 µM), Trolox (100 µM) or NAC (1 mM). h, i Senescent TIG-3 (Irrad and Rep) cells were infected with lentivirus encoding flag-tagged ATP6V1C2 or empty vector. After selection with puromycin, the cells were subjected to immunoblot analysis (h) or lysosomal pH analysis (i). j Viability of vector control or ATP6V1C2 overexpressing senescent TIG-3 cells (Irrad and Rep) after 24 h of treatment with 5 µM erastin alone or in combination with Fer-1 (500 nM), DFO (100 µM), Trolox (100 µM) or NAC (1 mM). k Mechanism of ferroptosis resistance in senescent cells. The data are presented as the mean ± s.d. of n = 3 biological replicates (d, f, g, j). For (a, b, i) the box represents the interquartile range (IQR), with a horizontal line and a black point indicating the median and mean, respectively. Whiskers extend to the most extreme data points within 1.5 times the IQR from the quartiles. White points beyond this range represent outliers. Statistical analysis was performed using the Kruskal-Wallis test followed by Dunn’s test (a, b, i) and one-way ANOVA with Tukey’s test (d, f, g, j). Source data are provided as a Source Data file.
Fig. 4 Acidic lysosomal pH induces ferroptosis in senescent cells. a Lysosomal pH of senescent TIG-3 (Irrad and Rep) cells after 24 h of treatment with or without 50 µM EN6, as measured by LysoSensor. b Measurement of free lysosomal ferrous iron (LysoRhoNox) and intracellular ferrous iron (FerroOrange) in senescent TIG-3 (Irrad and Rep) with or without 50 µM EN6 treatment. The box plot indicates the total intensity of LysoRhoNox staining. c Fluorescence images of lysosomes [LysoTracker (magenta)], lipid radicals [LipiRADICAL Green (green)], and nuclei [Hoechst 33342 (blue)] in senescent TIG-3 (Irrad and Rep) cells after treatment with 50 µM EN6. R represents the Pearson correlation coefficient between the signals of LysoTracker and LipiRADICAL Green. Scale bar, 50 µm. d Lipid peroxidation assessed by C11-BODIPY fluorescence in senescent TIG-3 cells (Irrad and Rep) with or without 2 µM erastin (Irrad), or 5 µM erastin (Rep) in the absence or presence of 50 µM EN6 for 12 h. The ratio of oxidized to reduced BODIPY (BODIPYox/BODIPYred) calculated from the median fluorescence intensity is shown. e Heatmap of peroxidized PC in senescent TIG-3 cells (Irrad) after 14 h of treatment with or without 5 µM erastin in the absence or presence of 50 µM EN6. f, g Cell viability of and LDH release by senescent TIG-3 (Irrad and Rep) cells after 24 h of treatment with or without 5 µM erastin in the absence or presence of 50 µM EN6 and with or without Fer-1 (500 nM), DFO (100 µM), Trolox (100 µM) or NAC (1 mM). h, i Senescent TIG-3 (Irrad and Rep) cells were infected with lentivirus encoding flag-tagged ATP6V1C2 or empty vector. After selection with puromycin, the cells were subjected to immunoblot analysis (h) or lysosomal pH analysis (i). j Viability of vector control or ATP6V1C2 overexpressing senescent TIG-3 cells (Irrad and Rep) after 24 h of treatment with 5 µM erastin alone or in combination with Fer-1 (500 nM), DFO (100 µM), Trolox (100 µM) or NAC (1 mM). k Mechanism of ferroptosis resistance in senescent cells. The data are presented as the mean ± s.d. of n = 3 biological replicates (d, f, g, j). For (a, b, i) the box represents the interquartile range (IQR), with a horizontal line and a black point indicating the median and mean, respectively. Whiskers extend to the most extreme data points within 1.5 times the IQR from the quartiles. White points beyond this range represent outliers. Statistical analysis was performed using the Kruskal-Wallis test followed by Dunn’s test (a, b, i) and one-way ANOVA with Tukey’s test (d, f, g, j). Source data are provided as a Source Data file.CC BY-NC-ND · PubMed Central
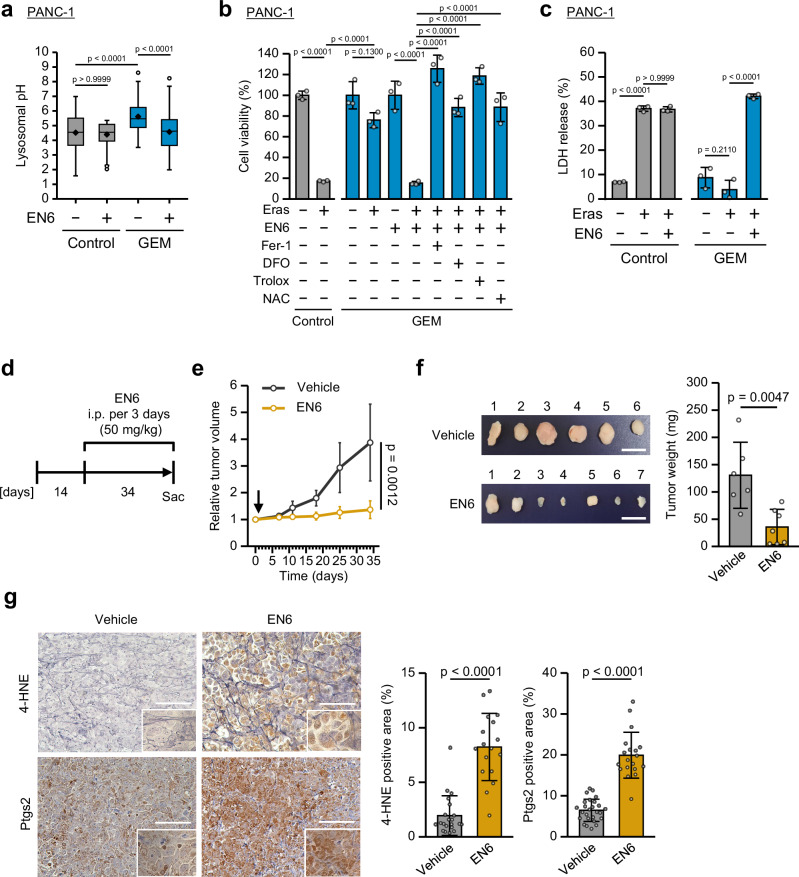
Fig. 5 EN6 treatment inhibits pancreatic cancer growth in vivo. a–c PANC-1 cells were treated with control vehicle or 50 nM gemcitabine (GEM) for 10 days, after which cellular senescence was induced. a Lysosomal pH of presenescent and senescent PANC-1 cells after 24 h of treatment with or without 50 µM EN6. b, c Cell viability of and LDH release by PANC-1 and senescent PANC-1 cells after 24 h of treatment with or without 5 µM erastin in the absence or presence of 50 µM EN6 and with Fer-1 (500 nM), DFO (100 µM), Trolox (100 µM) or NAC (1 mM). d Schematic representation of the PANC-1 xenograft mouse model. e Relative tumor growth rates of PANC-1 xenografts after 34 days of treatment with vehicle or EN6 (50 mg/kg, i.p., every 3 days). The arrow indicates the date when the treatment was started. f Images of xenograft tumors harvested from mice. Scale bar, 1 cm. Tumor weight measurements of PANC-1 xenografts after 34 days of treatment with vehicle or EN6 (50 mg/kg, i.p., every 3 days). g Representative images of IHC staining of PANC-1 xenografts after 34 days of treatment with vehicle or EN6 (50 mg/kg, i.p., every three days). Scale bar, 100 µm. The plot shows the percentage of the positive area of 4-HNE and Ptsg2 IHC staining in vehicle- and EN6-treated PANC-1 tumors. Data are represented as mean ± s.d For (b, c) the data are presented as the mean ± s.d. of n = 3 biological replicates. For a the box represents the interquartile range (IQR), with a horizontal line and a black point indicating the median and mean, respectively. Whiskers extend to the most extreme data points within 1.5 times the IQR from the quartiles. White points beyond this range represent outliers. For (e, f) the data are presented as the mean ± s.d. of n = 6 (Vehicle), n = 7 (EN6) biological replicates. Statistical analysis was performed using the Kruskal-Wallis test followed by Dunn’s test (a), one-way-ANOVA with Tukey’s test (b, c), and the two-sided Mann-Whitney U test (e, f, g). Source data are provided as a Source Data file.
Fig. 5 EN6 treatment inhibits pancreatic cancer growth in vivo. a–c PANC-1 cells were treated with control vehicle or 50 nM gemcitabine (GEM) for 10 days, after which cellular senescence was induced. a Lysosomal pH of presenescent and senescent PANC-1 cells after 24 h of treatment with or without 50 µM EN6. b, c Cell viability of and LDH release by PANC-1 and senescent PANC-1 cells after 24 h of treatment with or without 5 µM erastin in the absence or presence of 50 µM EN6 and with Fer-1 (500 nM), DFO (100 µM), Trolox (100 µM) or NAC (1 mM). d Schematic representation of the PANC-1 xenograft mouse model. e Relative tumor growth rates of PANC-1 xenografts after 34 days of treatment with vehicle or EN6 (50 mg/kg, i.p., every 3 days). The arrow indicates the date when the treatment was started. f Images of xenograft tumors harvested from mice. Scale bar, 1 cm. Tumor weight measurements of PANC-1 xenografts after 34 days of treatment with vehicle or EN6 (50 mg/kg, i.p., every 3 days). g Representative images of IHC staining of PANC-1 xenografts after 34 days of treatment with vehicle or EN6 (50 mg/kg, i.p., every three days). Scale bar, 100 µm. The plot shows the percentage of the positive area of 4-HNE and Ptsg2 IHC staining in vehicle- and EN6-treated PANC-1 tumors. Data are represented as mean ± s.d For (b, c) the data are presented as the mean ± s.d. of n = 3 biological replicates. For a the box represents the interquartile range (IQR), with a horizontal line and a black point indicating the median and mean, respectively. Whiskers extend to the most extreme data points within 1.5 times the IQR from the quartiles. White points beyond this range represent outliers. For (e, f) the data are presented as the mean ± s.d. of n = 6 (Vehicle), n = 7 (EN6) biological replicates. Statistical analysis was performed using the Kruskal-Wallis test followed by Dunn’s test (a), one-way-ANOVA with Tukey’s test (b, c), and the two-sided Mann-Whitney U test (e, f, g). Source data are provided as a Source Data file.CC BY-NC-ND · PubMed Central
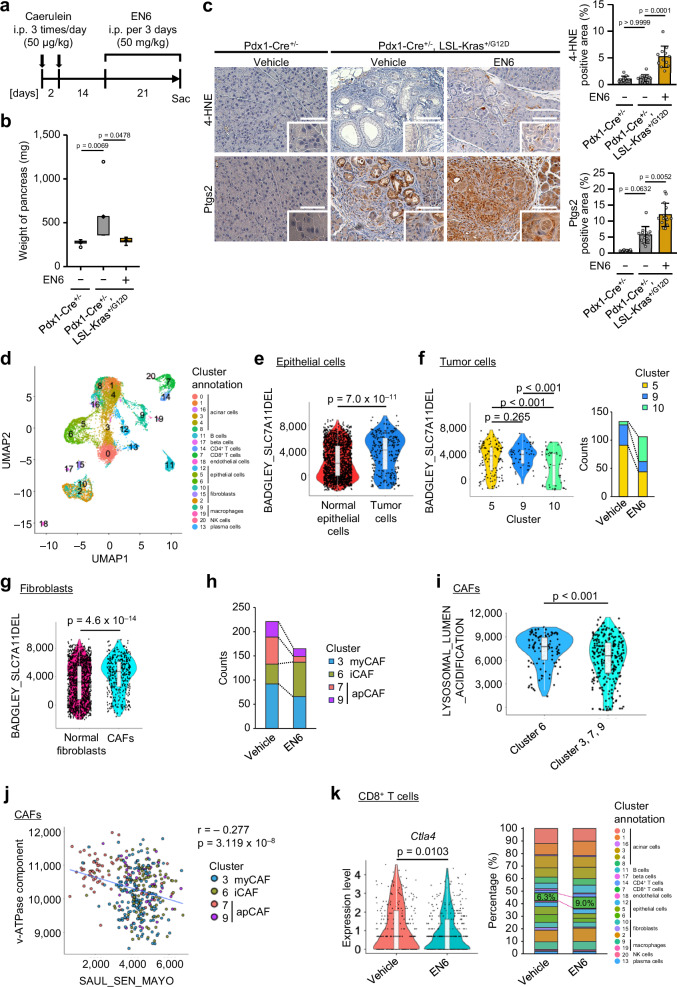
Fig. 6 EN6 treatment prevents pancreatic cancer development. a Schematic representation of the pancreatic cancer mouse model. b Pancreatic weight measurements after 21 days of vehicle or EN6 treatment. c Representative images of IHC staining of the pancreas after 21 days of treatment with vehicle or EN6 (50 mg/kg, i.p., every three days). Scale bar, 100 µm. The plot shows the percentage of the positive area of 4-HNE and Ptsg2 IHC staining in vehicle- and EN6-treated pancreatic tumors. d UMAP embedding of the expression profile for 11,524 pancreatic cells that passed quality control colored by cell type. e Module score violin plots showing the ferroptosis signature between normal epithelial cells and tumor cells. f Module score violin plots (left) depicting the ferroptosis signature across tumor cell clusters. The bar plot (right) shows the number of tumor cells (clusters 5, 9, and 10) in mice treated with vehicle or EN6. g Module score violin plots showing the ferroptosis signature between normal fibroblasts and CAFs. h Bar plot showing the count of CAFs (clusters 3, 6, 7, 9) in mice treated with vehicle or EN6. i Module score violin plots showing the lysosomal lumen acidification between CAF cluster 6 and 3, 7, 9. j Correlation analysis represented as a scatter plot showing the relationship between the enrichment of the cellular senescence gene set (SAUL_SEN_MAYO) and the enrichment of the V-ATPase component gene (V-ATPase component). k Violin plots showing Ctla4 gene expression in CD8+ T cells clusters from mice treated with vehicle or EN6. Bar plot showing the percentage of each cell type cluster. For b the box represents the interquartile range (IQR), with a horizontal line and a black point indicating the median and mean, respectively. Whiskers extend to the most extreme data points within 1.5 times the IQR from the quartiles. White points beyond this range represent outliers. For (e, f, g, I, and k), all data points are shown along with violin plots representing their distribution. The box represents the interquartile range (IQR), with a horizontal line indicating the median. Whiskers extend to the most extreme data points within 1.5 times the IQR from the quartiles. For (b, c) the data are presented as the mean ± s.d. over three biologically independent samples. Statistical analysis was performed using the Kruskal-Wallis test followed by Dunn’s test (b, c), two-sided Welch’s test (e, g, i, k), ordinary one-way ANOVA followed by Benjamini and Hochberg multiple comparison test (f) and Pearson correlative analysis (j). Source data are provided as a Source Data file.
Fig. 6 EN6 treatment prevents pancreatic cancer development. a Schematic representation of the pancreatic cancer mouse model. b Pancreatic weight measurements after 21 days of vehicle or EN6 treatment. c Representative images of IHC staining of the pancreas after 21 days of treatment with vehicle or EN6 (50 mg/kg, i.p., every three days). Scale bar, 100 µm. The plot shows the percentage of the positive area of 4-HNE and Ptsg2 IHC staining in vehicle- and EN6-treated pancreatic tumors. d UMAP embedding of the expression profile for 11,524 pancreatic cells that passed quality control colored by cell type. e Module score violin plots showing the ferroptosis signature between normal epithelial cells and tumor cells. f Module score violin plots (left) depicting the ferroptosis signature across tumor cell clusters. The bar plot (right) shows the number of tumor cells (clusters 5, 9, and 10) in mice treated with vehicle or EN6. g Module score violin plots showing the ferroptosis signature between normal fibroblasts and CAFs. h Bar plot showing the count of CAFs (clusters 3, 6, 7, 9) in mice treated with vehicle or EN6. i Module score violin plots showing the lysosomal lumen acidification between CAF cluster 6 and 3, 7, 9. j Correlation analysis represented as a scatter plot showing the relationship between the enrichment of the cellular senescence gene set (SAUL_SEN_MAYO) and the enrichment of the V-ATPase component gene (V-ATPase component). k Violin plots showing Ctla4 gene expression in CD8+ T cells clusters from mice treated with vehicle or EN6. Bar plot showing the percentage of each cell type cluster. For b the box represents the interquartile range (IQR), with a horizontal line and a black point indicating the median and mean, respectively. Whiskers extend to the most extreme data points within 1.5 times the IQR from the quartiles. White points beyond this range represent outliers. For (e, f, g, I, and k), all data points are shown along with violin plots representing their distribution. The box represents the interquartile range (IQR), with a horizontal line indicating the median. Whiskers extend to the most extreme data points within 1.5 times the IQR from the quartiles. For (b, c) the data are presented as the mean ± s.d. over three biologically independent samples. Statistical analysis was performed using the Kruskal-Wallis test followed by Dunn’s test (b, c), two-sided Welch’s test (e, g, i, k), ordinary one-way ANOVA followed by Benjamini and Hochberg multiple comparison test (f) and Pearson correlative analysis (j). Source data are provided as a Source Data file.CC BY-NC-ND · PubMed Central

Verification

Claims the paper makes

The claims and statistics of this paper haven’t been checked yet.

Run the check — free, no account needed. It reads the open-access text and checks the sources it cites.

A few free checks a day · papers already verified open instantly · results are public

Claims other papers make about this one

Each is checked against this paper’s own text: does it say what the citing paper says it does?

Self-check

Percentages, sums and reported differences re-computed from the paper’s own numbers.

The self-check needs the paper’s full text.

Citations

Cites

Research works printed but not linked: 39

  1. Takahashi, A. et al. Mitogenic signalling and the p16INK4a–Rb pathway cooperate to enforce irreversible cellular senescence. Nat. Cell Biol. 8, 1291–1297 (2006). · DOI · Paper page
  2. Kim, Y., Jang, Y., Kim, M.-S. & Kang, C. Metabolic remodeling in cancer and senescence and its therapeutic implications. Trends Endocrinol. Metab. 35, 732–744 (2024). · DOI · Paper page
  3. Dixon, S. J. et al. Ferroptosis: an iron-dependent form of nonapoptotic cell death. Cell 149, 1060–1072 (2012). · DOI · Paper page
  4. Jiang, X., Stockwell, B. R. & Conrad, M. Ferroptosis: mechanisms, biology and role in disease. Nat. Rev. Mol. Cell Biol. 22, 266–282 (2021). · DOI
  5. Fujii, J. & Yamada, K. Defense systems to avoid ferroptosis caused by lipid peroxidation-mediated membrane damage. Free Radic. Res. 57, 353–372 (2023). · DOI
  6. Nakamura, T. & Conrad, M. Exploiting ferroptosis vulnerabilities in cancer. Nat. Cell Biol. 26, 1407–1419 (2024). · DOI
  7. Wei, X. et al. Defective NCOA4-dependent ferroptosis in senescent fibroblasts retards diabetic wound healing. Cell Death Discov. 9, 1–10 (2023). · DOI
  8. Zheng, J. & Conrad, M. The metabolic underpinnings of ferroptosis. Cell Metab. 32, 920–937 (2020). · DOI
  9. Gao, M., Monian, P., Quadri, N., Ramasamy, R. & Jiang, X. Glutaminolysis and transferrin regulate ferroptosis. Mol. Cell 59, 298–308 (2015). · DOI · Paper page
  10. Matsuoka, Y. et al. Structural library and visualization of endogenously oxidized phosphatidylcholines using mass spectrometry-based techniques. Nat. Commun. 12, 6339 (2021). · DOI
  11. Kagan, V. E. et al. Oxidized arachidonic and adrenic PEs navigate cells to ferroptosis. Nat. Chem. Biol. 13, 81–90 (2017). · DOI · Paper page
  12. von Krusenstiern, A. N. et al. Identification of essential sites of lipid peroxidation in ferroptosis. Nat. Chem. Biol. 19, 719–730 (2023). · DOI
  13. Gao, M. et al. Role of mitochondria in ferroptosis. Mol. Cell 73, 354–363.e3 (2019). · DOI · Paper page
  14. Saimoto, Y. et al. Lysosomal lipid peroxidation contributes to ferroptosis induction via lysosomal membrane permeabilization. Nat. Commun. 16, 3554 (2025). · DOI
  15. Niwa, M., Hirayama, T., Okuda, K. & Nagasawa, H. A new class of high-contrast Fe(II) selective fluorescent probes based on spirocyclized scaffolds for visualization of intracellular labile iron delivered by transferrin. Org. Biomol. Chem. 12, 6590–6597 (2014). · DOI
  16. Abu-Remaileh, M. et al. Lysosomal metabolomics reveals V-ATPase- and mTOR-dependent regulation of amino acid efflux from lysosomes. Science 358, 807–813 (2017). · DOI
  17. Nishi, T. & Forgac, M. The vacuolar (H+)-ATPases—nature’s most versatile proton pumps. Nat. Rev. Mol. Cell Biol. 3, 94–103 (2002). · DOI · Paper page
  18. Dröse, S. et al. Semisynthetic derivatives of concanamycin A and C, as inhibitors of V- and P-type ATPases: structure−activity investigations and developments of photoaffinity probes. Biochemistry 40, 2816–2825 (2001). · DOI
  19. Collins, M. P. & Forgac, M. Regulation of V-ATPase assembly in nutrient sensing and function of V-ATPases in breast cancer metastasis. Front. Physiol. 9, 902 (2018). · DOI
  20. Chung, C. Y.-S. et al. Covalent targeting of the vacuolar H+-ATPase activates autophagy via mTORC1 inhibition. Nat. Chem. Biol. 15, 776–785 (2019). · DOI
  21. Chen, X., Kang, R., Kroemer, G. & Tang, D. Broadening horizons: the role of ferroptosis in cancer. Nat. Rev. Clin. Oncol. 18, 280–296 (2021). · DOI
  22. Yang, W. S. et al. Regulation of ferroptotic cancer cell death by GPX4. Cell 156, 317–331 (2014). · DOI · Paper page
  23. Morris, J. P., Cano, D. A., Sekine, S., Wang, S. C. & Hebrok, M. β-catenin blocks Kras-dependent reprogramming of acini into pancreatic cancer precursor lesions in mice. J. Clin. Investig. 120, 508–520 (2010). · DOI
  24. Kolodkin-Gal, D. et al. Senolytic elimination of Cox2-expressing senescent cells inhibits the growth of premalignant pancreatic lesions. Gut 71, 345–355 (2022). · DOI
  25. Tang, Y., Zhang, S., Li, J., Wu, C. & Fan, Q. ID1 marks the tumorigenesis of pancreatic ductal adenocarcinoma in mouse and human. Sci. Rep. 12, 13555 (2022). · DOI
  26. Belle, J. I. et al. Senescence defines a distinct subset of myofibroblasts that orchestrates immunosuppression in pancreatic cancer. Cancer Discov. 14, 1324–1355 (2024). · DOI
  27. Gao, M. et al. Ferroptosis is an autophagic cell death process. Cell Res 26, 1021–1032 (2016). · DOI · Paper page
  28. Thelen, A. M. & Zoncu, R. Emerging roles for the lysosome in lipid metabolism. Trends Cell Biol. 27, 833–850 (2017). · DOI
  29. Evers, B. M. et al. Lipidomic and transcriptomic basis of lysosomal dysfunction in progranulin deficiency. Cell Rep. 20, 2565–2574 (2017). · DOI
  30. Rizzollo, F., More, S., Vangheluwe, P. & Agostinis, P. The lysosome as a master regulator of iron metabolism. Trends Biochem. Sci. 46, 960–975 (2021). · DOI
  31. Feng, Y. et al. Iron retardation in lysosomes protects senescent cells from ferroptosis. Aging 16, 7683–7703 (2024). · DOI · Paper page
  32. Minami, J. K. et al. CDKN2A deletion remodels lipid metabolism to prime glioblastoma for ferroptosis. Cancer Cell 41, 1048–1060.e9 (2023). · DOI
  33. Li, W. et al. Cellular senescence triggers intracellular acidification and lysosomal pH alkalinized via ATP6AP2 attenuation in breast cancer cells. Commun. Biol. 6, 1–17 (2023). · DOI
  34. Kojima, H. et al. Cold stress–induced ferroptosis in liver sinusoidal endothelial cells determines liver transplant injury and outcomes. JCI Insight 9, e174354 (2024). · DOI
  35. Liu, Q. et al. Mass spectrometry reveals high levels of hydrogen peroxide in pancreatic cancer cells. Angew. Chem. Int. Ed. 62, e202213703 (2023). · DOI
  36. Im, E. et al. Lysosomal dysfunction in Down syndrome and Alzheimer mouse models is caused by v-ATPase inhibition by Tyr682-phosphorylated APP βCTF. Sci. Adv. 9, eadg1925 (2023). · DOI · Paper page
  37. Wang, A. et al. Innate immune sensing of lysosomal dysfunction drives multiple lysosomal storage disorders. Nat. Cell Biol. 26, 219–234 (2024). · DOI
  38. Schlesinger, Y. et al. Single-cell transcriptomes of pancreatic preinvasive lesions and cancer reveal acinar metaplastic cells’ heterogeneity. Nat. Commun. 11, 4516 (2020). · DOI
  39. Shichino, S. et al. TAS-Seq is a robust and sensitive amplification method for bead-based scRNA-seq. Commun. Biol. 5, 1–15 (2022). · DOI

Cited by

Sorted by citations

See all 35

Metadata

Authors
Loo, T. M., Zhou, X., Tanaka, Y., Sugawara, S., Yamauchi, S., Kawasaki, H., Matsuoka, Y., Sugiura, Y., Sakuma, S., Yamanishi, Y., Yotsumoto, S., Dodo, K., Shirasaki, Y., Kamatani, T., & Takahashi, A.
Venue
Nature Communications
Published
2025-07-29
Volume
16
Issue
1
ISSN
2041-1723
Cited by
35
References
16
Language
en
Funders
  • MEXT | Japan Science and Technology Agency (JPMJMS2217, JPMJMS2022)
  • MEXT | JST | Center of Innovation Program (JPMJPF2202)
  • Japan Agency for Medical Research and Development (24gm1710013h0001)
  • MEXT | Japan Society for the Promotion of Science (23K17420, 25K02523)
  • Astellas Foundation for Research on Metabolic Disorders (2022S1015)
  • Takeda Medical Research Foundation (2023095586)

About these checks

Registry, retraction, Cites and statistics results are computed, not judged, with one exception: a printed reference that no index lists is read once by a model before it counts as a citation error. Claims are extracted by a model and kept only when their quote appears verbatim in the text; each cited source is then checked, with a model’s help, for whether it says what the claim relies on. Those verdicts can be wrong — read the claim’s quote and the cited source before relying on one.

Statistics and arithmetic are recomputed, not judged.

Confidence bands are shown only for fields calibrated on our annotated test set. None is calibrated yet, so no band is shown.

What counts as a claim ›How we measure confidence ›How we check this ›

Are you an author, or do you see a problem with this page? Request a review