

Microenvironment-responsive multifunctional enzyme-linked hydrogel for diabetic bone defect regeneration.
Open accessThe DOI matches its Crossref record; 36 of the 36 references it cites were found in a registry or an index; 8 of the 20 sources its claims cite were checked for support.
Abstract
A glucose/ROS-responsive multifunctional hydrogel (AAT-ZCG) is designed, integrating tannic acid-mediated dynamic borate ester bonds and a cascade nanozyme comprising cerium-zoledronic acid-glucose oxidase. Acidic byproducts trigger ZCG degradation, releasing zoledronic acid to inhibit excessive osteoclast activation.
Overview
CoChat Summary
## TL;DR
This study developed a glucose/ROS-responsive hydrogel (AAT-ZCG) that combines tannic acid, a cerium-zoledronic acid-glucose oxidase nanozyme, and dynamic borate ester chemistry to address multiple pathological features of diabetic bone defects at once. In a rat diabetic cranial defect model, it reduced inflammation and osteoclast activity while promoting angiogenesis and bone regeneration, with RNA-seq implicating FoxO1/P53 signaling.
## Key findings
- The ZCG multi-nanozyme was reported as ~50 nm spherical particles, with mixed cerium valence states of 56.18% Ce³⁺ and 43.82% Ce⁴⁺, supporting SOD- and CAT-like activity.
- In glucose-response tests, ZCG acidified the medium as glucose increased; with 4 mg/mL glucose, pH dropped from 6.74 to 3.38 within 24 h, and H₂O₂ from glucose oxidation caused colloidal destabilization.
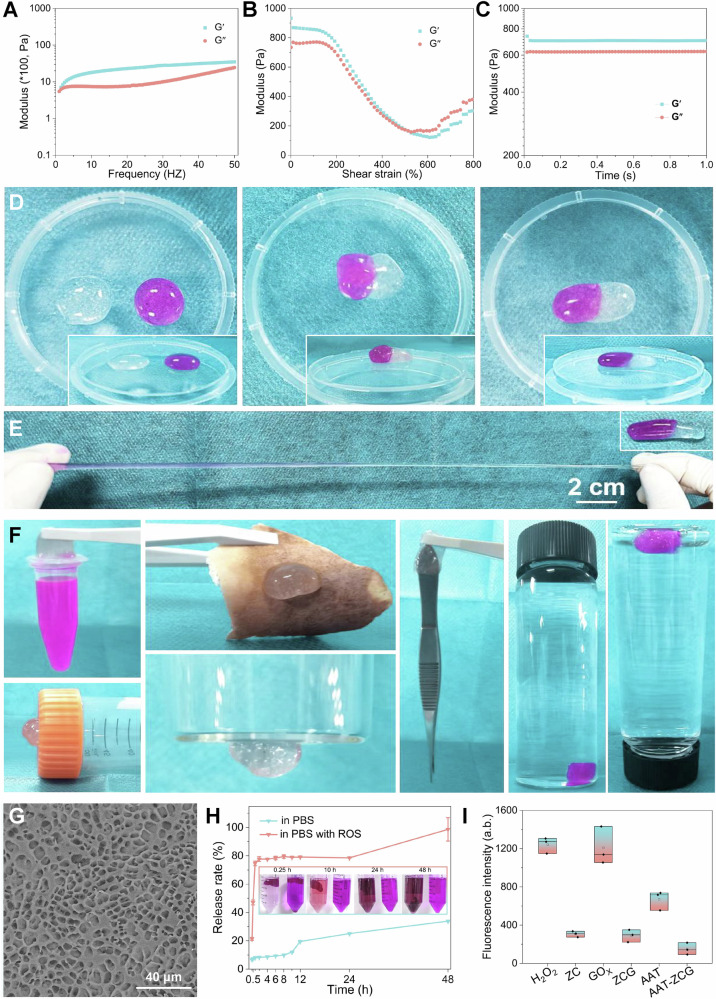
- The AAT gel showed strong mechanics and self-healing: it withstood frequencies >50 Hz, strains up to 480%, had storage modulus >700, and healed to 800% stretch without breaking.
- In vivo, the hydrogel degraded progressively, with 24.2% remaining at 7 days, 12.3% at 14 days, 7.7% at 21 days, and complete degradation by 42 days; in the rat diabetic cranial defect model, BV/TV improved to 0.49 ± 0.01 at 4 weeks and 0.67 ± 0.01 at 8 weeks in the AAT-ZCG group, outperforming the comparison groups.
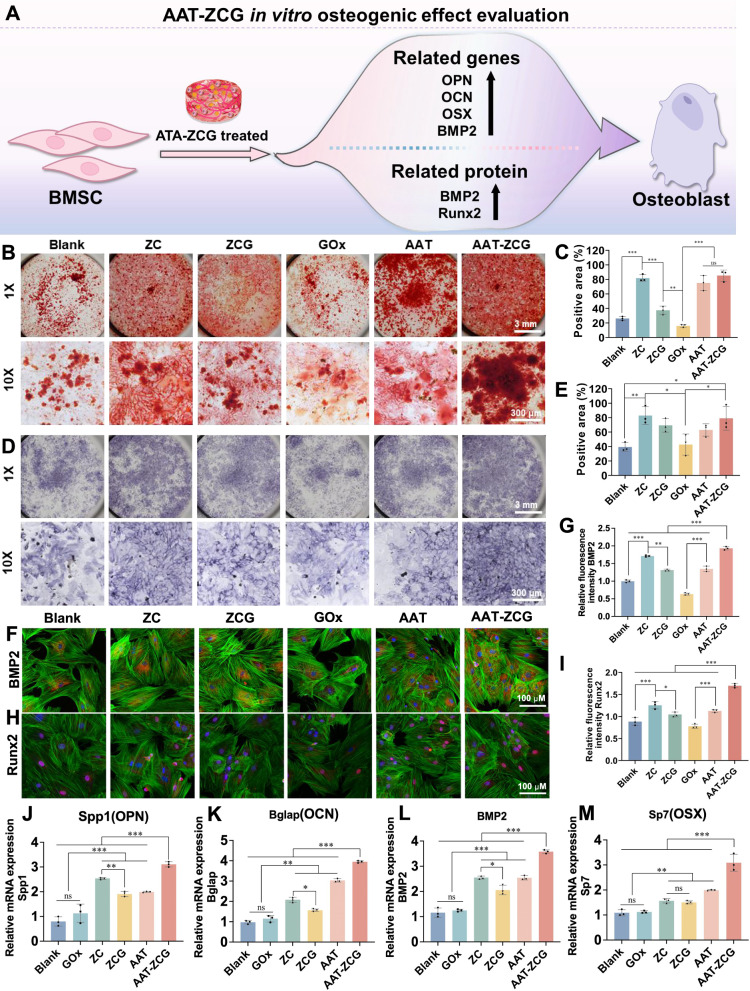
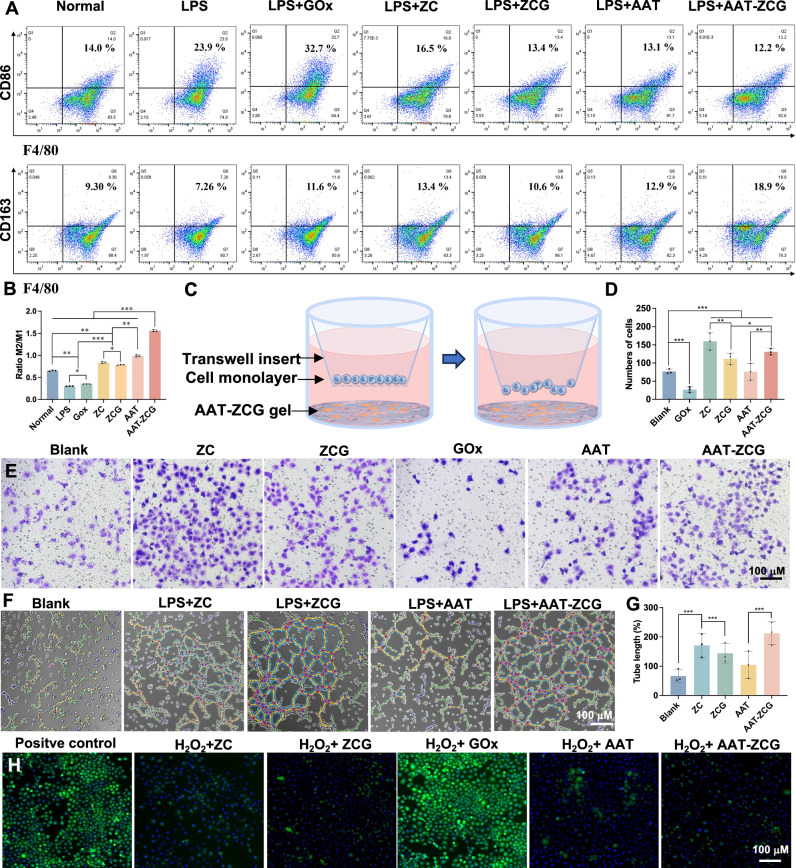
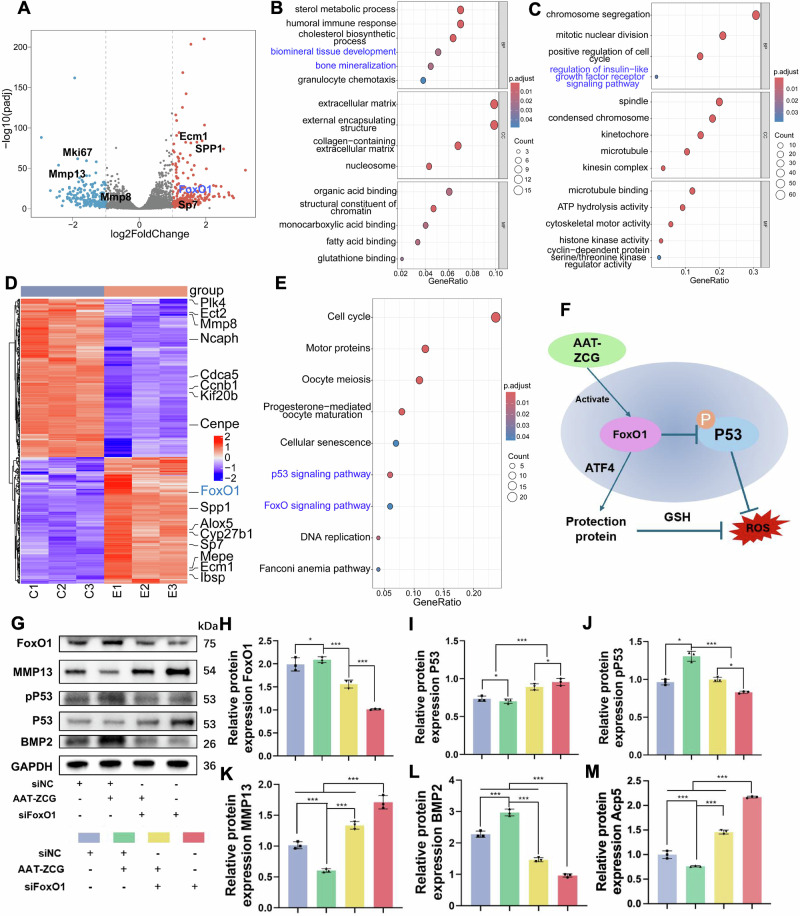
- The paper reports AAT-ZCG reduced inflammation and osteoclastogenesis, promoted M2 macrophage polarization, increased angiogenesis, and enhanced osteogenic markers; transcriptomics linked these effects to FoxO1 and P53/pP53 pathways.
## Methods
- Design: Material synthesis and characterization of a dual-responsive hydrogel (AAT) loaded with a multi-nanozyme (ZCG), followed by in vitro functional assays and an in vivo diabetic rat cranial defect study.
- Data/sample: Rat BMSCs, mouse BMDMs, HUVECs, and diabetic Sprague-Dawley rats with 5 mm diameter, 1 mm depth cranial defects; the animal study used groups including blank, AAT, AAT-GOx, AAT-ZC, and AAT-ZCG, with n = 4 rats per group per endpoint.
- Main analysis: CCK8/live-dead cytocompatibility, osteogenic/osteoclast and macrophage polarization assays, ROS and angiogenesis assays, RNA-seq with GO/KEGG enrichment, molecular docking, siRNA knockdown of FoxO1, and in vivo Micro-CT, histology, and immunofluorescence; statistics used t-tests or ANOVA with P < 0.05.
## Limitations
- The paper states it did not comprehensively explore the specific mechanisms of glucose regulation, especially at the systemic/global level.
- It states immune regulation was mainly limited to macrophage polarization, and other immune cells such as T cells, B cells, or neutrophils were not thoroughly studied.
- It states there was a lack of research on critical-sized large bone defects and that large animal models are needed for closer clinical relevance.
- Evident from the text: several claims about in vivo efficacy are based on a rat cranial defect model, so generalizability to other defect types or species is not directly established in the paper.
Model-written summary. Check it against the paper before relying on it.
Integrity signals
Registry
Cites
Statistics
Figures




Verification
Claims the paper makes
6 Valid · 0 Not valid · 6 Not checked · 88 Own results and interpretations
The cited sources support only part of this claim — read each source’s verdict below.
In the paper
“The imbalance between osteoblast and osteoclast activity further complicates bone defect repair in DM9,10.”
§ Microenvironment-responsive multifunctional enzyme-linked hydrogel for diabetic bone defect regeneration > Introduction The repair of bone defects in diabetes mellitus (DM) presents a formidable clinical challenge, attributable to the intricate interplay of systemic and local pathological mechanisms1,2. Diabetic patients typically exhibit systemic skeletal metabolic abnormalities, such as reduced bone density and compromised bone quality2,3. The pathological microenvironment in DM bone defect areas is characterized by hyperglycemia, chronic inflammation, vascular dysfunction, and immune dysregulation4–6. Additionally, the advanced glycation end-product deposition, impaired osseous angiogenesis and dysregulated glucose-insulin axis, collectively suppress osteogenic differentiation, impair bone turnover, and compromise healing capacity2,7. Notably, 30-40% of DM patients require exogenous insulin administration for glycemic control, which paradoxically enhances osteoclastogenesis8. The imbalance between osteoblast and osteoclast activity further complicates bone defect repair in DM9,10. Furthermore, clinical management often fails to address the combined effects of DM-induced chronic inflammation and acute inflammation triggered by bone injury, leading to disrupted macrophage polarization and immune dysregulation, which further hinder bone repair11. Currently, the repair of DM bone defects is not recognized as a distinct pathological entity and is treated as separate conditions, highlighting the urgent need for strategies to modulate the microenvironment and enhance bone regeneration in DM12. In addition to conventional hypoglycemic agents such as insulin, metformin, and sodium-glucose co-transporter 2 inhibitors, glucose oxidase (GOx) has emerged as a promising enzymatic therapeutic strategy13,14. It efficiently catalyzes the in situ conversion of Glu into hydrogen peroxide (H2O2) and gluconic acid15. However, the application of GOx is limited by the generation of H2O2 as a byproduct during catalysis. As a reactive oxygen species (ROS), H2O2 promotes oxidative stress, exacerbates bone tissue degradation, and hinders bone regeneration, counteracting GOx’s potential benefits16. Without effective mitigation, GOx-based therapeutic strategies will remain limited. With the rapid advancement of biomaterial technology, intelligent biomaterials exhibiting ROS scavenging and anti-inflammatory properties have shown considerable promise in the repair of DM bone defects17–19. For instance, cerium-based nanomaterials (CeNPs) mimic catalase (CAT) activity, effectively decomposing H2O2 into water (H2O) and oxygen (O2), thereby overcoming the limitations associated with GOx20,21. Additionally, CeNPs promote angiogenesis and osteogenesis by alleviating oxidative stress and modulating osteocyte signaling via the TGF-β/BMP pathway22,23. In our previous work, a metal-ligand-based nanozyme incorporating cerium and zoledronic acid (ZOL, an osteoclast-inhibiting agent) (ZC NCs) was developed, which not only retains the beneficial properties of CeNPs but also integrates bone-anchoring and osteoclast-inhibiting functions, facilitating the remodeling of osteogenesis/osteoclast balance24. However, the application of ZC NCs in bone defect repair is limited by challenges related to long-term fixation and stability. To address these limitations, hydrogels that mimic the extracellular matrix and possess exceptional drug-loading capacities have emerged as a promising solution. Notably, certain 3D dynamic hydrogels exhibit the unique ability to release drugs in response to changes in the microenvironment25,26. Among these, polyphenol-phenylboronic acid (PBA) hydrogels, formed through dynamic borate ester bond, not only respond to Glu and ROS but also demonstrate wet adhesion and anti-inflammatory properties27,28. In our earlier studies, a dynamic hydrogel based on tannic acid (TA) and PBA was developed29. However, like most polyphenol-based hydrogels, the issue of excessive oxidation during the cross-linking process remained unresolved. Through synthetic optimization and careful proportional regulation, we were able to mitigate this problem, resulting in a Glu/ROS-responsive dynamic hydrogel that strikes a balance between mechanical strength and enhanced anti-inflammatory properties30. These characteristics make polyphenol-based hydrogels loaded with ZC NCs highly promising for the repair of DM-induced bone defects. In this study, we propose a microenvironment-responsive multifunctional all-in-one strategy for repairing DM bone defects. This strategy simultaneously targets hyperglycemia, inflammation, vascular dysfunction, immune dysregulation, and osteoclast/osteoblast imbalance in a concise step. To address the unique microenvironment of DM bone defects, a ZCG multi-nanozyme by integrating GOx into ZC NCs is constructed (Fig. 1). The ZCG is then encapsulated within a dual-responsive hydrogel (AAT hydrogel) crosslinked by TA and PBA. The AAT-ZCG hydrogel, responsive to high Glu and ROS levels, releases TA and ZCG in a microenvironment-dependent manner, thereby regulating macrophage polarization, promoting angiogenesis, and enhancing osteogenesis. Simultaneously, ZCG reduces Glu and inflammation levels through the cascade enzymatic reactions of GOx and CeNPs. The acidic byproducts of these reactions trigger ZCG self-degradation, releasing ZOL, which inhibits osteoclast overactivation. In the DM bone defect microenvironment, the AAT-ZCG hydrogel exerts multiple therapeutic effects: (i) The dual-responsive hydrogel releases TA and ZCG in a microenvironment-dependent manner; (ii) The multi-nanozyme activity of ZCG and TA cascades to reduce local Glu and inflammation levels, while modulating macrophage polarization, promoting angiogenesis, and enhancing osteogenesis; (iii) ZCG decomposition releases ZOL, which induces apoptosis of overactivated osteoclasts, restoring bone regeneration balance; (iv) RNA transcriptome sequencing reveals that the AAT-ZCG hydrogel significantly upregulates FoxO1 expression, a key regulator of inflammation and bone metabolism. In conclusion, this all-in-one microenvironment-responsive multifunctional enzyme-linked hydrogel overcomes the limitations of traditional therapies with single efficacy or complex compositions, offering a concise and efficient integrated approach for diabetic bone defect regeneration.
What the sources say
- Partly supportedcites [9] Zeng, J. et al. Osteoblastic and anti-osteoclastic activities of strontium-substituted silicocarnotite ceramics: In vitro and in vivo studies. Bioact. Mater. 5, 435–446 (2020). sourceExperimental — accuracy not yet measured
The Introduction says that weakened osteoblast activity and overactive osteoclasts impair healing of osteoporotic fractures and defects. The Discussions likewise describes this imbalance in osteoporosis, but neither passage establishes it for DM (diabetes mellitus). Page numbers are unavailable in our copy. (LLM, conf=0.88)
- Not checked — no full text of the sourcecites [10] Liu, S. et al. Multifaceted Catalytic Glucose Depletion and Reactive Oxygen Species-Scavenging Nanoenzyme Composite Hydrogel for Facilitating Diabetic Bone Regeneration. ACS Nano 19, 2677–2694 (2025). source
plainstates a cause- Asserted: passes — The authors put it forward as true.
- Checkable: passes — It can be checked against evidence.
- Load-bearing: passes — The paper’s conclusions depend on it.
- Based: passes — The paper gives a reason why it holds.
- Partly supported
The cited sources support only part of this claim — read each source’s verdict below.
In the paper
“The pathological microenvironment in DM bone defect areas is characterized by hyperglycemia, chronic inflammation, vascular dysfunction, and immune dysregulation4–6.”
§ Microenvironment-responsive multifunctional enzyme-linked hydrogel for diabetic bone defect regeneration > Introduction The repair of bone defects in diabetes mellitus (DM) presents a formidable clinical challenge, attributable to the intricate interplay of systemic and local pathological mechanisms1,2. Diabetic patients typically exhibit systemic skeletal metabolic abnormalities, such as reduced bone density and compromised bone quality2,3. The pathological microenvironment in DM bone defect areas is characterized by hyperglycemia, chronic inflammation, vascular dysfunction, and immune dysregulation4–6. Additionally, the advanced glycation end-product deposition, impaired osseous angiogenesis and dysregulated glucose-insulin axis, collectively suppress osteogenic differentiation, impair bone turnover, and compromise healing capacity2,7. Notably, 30-40% of DM patients require exogenous insulin administration for glycemic control, which paradoxically enhances osteoclastogenesis8. The imbalance between osteoblast and osteoclast activity further complicates bone defect repair in DM9,10. Furthermore, clinical management often fails to address the combined effects of DM-induced chronic inflammation and acute inflammation triggered by bone injury, leading to disrupted macrophage polarization and immune dysregulation, which further hinder bone repair11. Currently, the repair of DM bone defects is not recognized as a distinct pathological entity and is treated as separate conditions, highlighting the urgent need for strategies to modulate the microenvironment and enhance bone regeneration in DM12. In addition to conventional hypoglycemic agents such as insulin, metformin, and sodium-glucose co-transporter 2 inhibitors, glucose oxidase (GOx) has emerged as a promising enzymatic therapeutic strategy13,14. It efficiently catalyzes the in situ conversion of Glu into hydrogen peroxide (H2O2) and gluconic acid15. However, the application of GOx is limited by the generation of H2O2 as a byproduct during catalysis. As a reactive oxygen species (ROS), H2O2 promotes oxidative stress, exacerbates bone tissue degradation, and hinders bone regeneration, counteracting GOx’s potential benefits16. Without effective mitigation, GOx-based therapeutic strategies will remain limited. With the rapid advancement of biomaterial technology, intelligent biomaterials exhibiting ROS scavenging and anti-inflammatory properties have shown considerable promise in the repair of DM bone defects17–19. For instance, cerium-based nanomaterials (CeNPs) mimic catalase (CAT) activity, effectively decomposing H2O2 into water (H2O) and oxygen (O2), thereby overcoming the limitations associated with GOx20,21. Additionally, CeNPs promote angiogenesis and osteogenesis by alleviating oxidative stress and modulating osteocyte signaling via the TGF-β/BMP pathway22,23. In our previous work, a metal-ligand-based nanozyme incorporating cerium and zoledronic acid (ZOL, an osteoclast-inhibiting agent) (ZC NCs) was developed, which not only retains the beneficial properties of CeNPs but also integrates bone-anchoring and osteoclast-inhibiting functions, facilitating the remodeling of osteogenesis/osteoclast balance24. However, the application of ZC NCs in bone defect repair is limited by challenges related to long-term fixation and stability. To address these limitations, hydrogels that mimic the extracellular matrix and possess exceptional drug-loading capacities have emerged as a promising solution. Notably, certain 3D dynamic hydrogels exhibit the unique ability to release drugs in response to changes in the microenvironment25,26. Among these, polyphenol-phenylboronic acid (PBA) hydrogels, formed through dynamic borate ester bond, not only respond to Glu and ROS but also demonstrate wet adhesion and anti-inflammatory properties27,28. In our earlier studies, a dynamic hydrogel based on tannic acid (TA) and PBA was developed29. However, like most polyphenol-based hydrogels, the issue of excessive oxidation during the cross-linking process remained unresolved. Through synthetic optimization and careful proportional regulation, we were able to mitigate this problem, resulting in a Glu/ROS-responsive dynamic hydrogel that strikes a balance between mechanical strength and enhanced anti-inflammatory properties30. These characteristics make polyphenol-based hydrogels loaded with ZC NCs highly promising for the repair of DM-induced bone defects. In this study, we propose a microenvironment-responsive multifunctional all-in-one strategy for repairing DM bone defects. This strategy simultaneously targets hyperglycemia, inflammation, vascular dysfunction, immune dysregulation, and osteoclast/osteoblast imbalance in a concise step. To address the unique microenvironment of DM bone defects, a ZCG multi-nanozyme by integrating GOx into ZC NCs is constructed (Fig. 1). The ZCG is then encapsulated within a dual-responsive hydrogel (AAT hydrogel) crosslinked by TA and PBA. The AAT-ZCG hydrogel, responsive to high Glu and ROS levels, releases TA and ZCG in a microenvironment-dependent manner, thereby regulating macrophage polarization, promoting angiogenesis, and enhancing osteogenesis. Simultaneously, ZCG reduces Glu and inflammation levels through the cascade enzymatic reactions of GOx and CeNPs. The acidic byproducts of these reactions trigger ZCG self-degradation, releasing ZOL, which inhibits osteoclast overactivation. In the DM bone defect microenvironment, the AAT-ZCG hydrogel exerts multiple therapeutic effects: (i) The dual-responsive hydrogel releases TA and ZCG in a microenvironment-dependent manner; (ii) The multi-nanozyme activity of ZCG and TA cascades to reduce local Glu and inflammation levels, while modulating macrophage polarization, promoting angiogenesis, and enhancing osteogenesis; (iii) ZCG decomposition releases ZOL, which induces apoptosis of overactivated osteoclasts, restoring bone regeneration balance; (iv) RNA transcriptome sequencing reveals that the AAT-ZCG hydrogel significantly upregulates FoxO1 expression, a key regulator of inflammation and bone metabolism. In conclusion, this all-in-one microenvironment-responsive multifunctional enzyme-linked hydrogel overcomes the limitations of traditional therapies with single efficacy or complex compositions, offering a concise and efficient integrated approach for diabetic bone defect regeneration.
What the sources say
- Partly supportedcites [4] Wimmer, R. A. et al. Human blood vessel organoids as a model of diabetic vasculopathy. Nature 565, 505–510 (2019). sourceExperimental — accuracy not yet measured
The paper’s Abstract describes hyperglycemia, an inflammatory state involving TNFα and IL6, and vascular abnormalities in diabetes; it also reports basement-membrane changes in diabetic vascular organoids and patients’ dermal microvessels. It does not establish that this combination characterizes diabetic bone-defect areas, or address immune dysregulation there. (LLM, conf=0.88)
- Not checked — no full text of the sourcecites [5] Donath, M. Y. et al. Targeting innate immune mediators in type 1 and type 2 diabetes. Nat. Rev. Immunol. 19, 734–746 (2019). source
- Partly supportedcites [6] Cai, Y. et al. Harnessing strategies for enhancing diabetic wound healing from the perspective of spatial inflammation patterns. Bioact. Mater. 28, 243–254 (2023). sourceExperimental — accuracy not yet measured
Cai et al. (2023) describe exactly these four features — chronic hyperglycemia ('Pathological conditions in diabetic wound healing', opening paragraph), excessive and persistent inflammation, M1/M2 immune imbalance and angiogenesis (vascular) deficiency (same section, paragraphs 2 and 4) — but for diabetic skin/foot wounds, not bone. Our copy contains no discussion of a diabetic bone defect microenvironment (the only 'bone' reference is to bone marrow-derived macrophages in the scaffold pore-size section, 'Strategies for enhancing diabetic wound healing > Switches for M1/M2 transition'). The setting attribute 'DM bone defect areas' is therefore not supported by this source; the cited sentence extends a soft-tissue wound-healing characterization to bone defects. (LLM, conf=0.72)
plainstates an association- Asserted: passes — The authors put it forward as true.
- Checkable: passes — It can be checked against evidence.
- Load-bearing: passes — The paper’s conclusions depend on it.
- Based: passes — The paper gives a reason why it holds.
- Partly supported
The cited sources support only part of this claim — read each source’s verdict below.
In the paper
“Furthermore, clinical management often fails to address the combined effects of DM-induced chronic inflammation and acute inflammation triggered by bone injury, leading to disrupted macrophage polarization and immune dysregulation, which further hinder bone repair11.”
§ Microenvironment-responsive multifunctional enzyme-linked hydrogel for diabetic bone defect regeneration > Introduction The repair of bone defects in diabetes mellitus (DM) presents a formidable clinical challenge, attributable to the intricate interplay of systemic and local pathological mechanisms1,2. Diabetic patients typically exhibit systemic skeletal metabolic abnormalities, such as reduced bone density and compromised bone quality2,3. The pathological microenvironment in DM bone defect areas is characterized by hyperglycemia, chronic inflammation, vascular dysfunction, and immune dysregulation4–6. Additionally, the advanced glycation end-product deposition, impaired osseous angiogenesis and dysregulated glucose-insulin axis, collectively suppress osteogenic differentiation, impair bone turnover, and compromise healing capacity2,7. Notably, 30-40% of DM patients require exogenous insulin administration for glycemic control, which paradoxically enhances osteoclastogenesis8. The imbalance between osteoblast and osteoclast activity further complicates bone defect repair in DM9,10. Furthermore, clinical management often fails to address the combined effects of DM-induced chronic inflammation and acute inflammation triggered by bone injury, leading to disrupted macrophage polarization and immune dysregulation, which further hinder bone repair11. Currently, the repair of DM bone defects is not recognized as a distinct pathological entity and is treated as separate conditions, highlighting the urgent need for strategies to modulate the microenvironment and enhance bone regeneration in DM12. In addition to conventional hypoglycemic agents such as insulin, metformin, and sodium-glucose co-transporter 2 inhibitors, glucose oxidase (GOx) has emerged as a promising enzymatic therapeutic strategy13,14. It efficiently catalyzes the in situ conversion of Glu into hydrogen peroxide (H2O2) and gluconic acid15. However, the application of GOx is limited by the generation of H2O2 as a byproduct during catalysis. As a reactive oxygen species (ROS), H2O2 promotes oxidative stress, exacerbates bone tissue degradation, and hinders bone regeneration, counteracting GOx’s potential benefits16. Without effective mitigation, GOx-based therapeutic strategies will remain limited. With the rapid advancement of biomaterial technology, intelligent biomaterials exhibiting ROS scavenging and anti-inflammatory properties have shown considerable promise in the repair of DM bone defects17–19. For instance, cerium-based nanomaterials (CeNPs) mimic catalase (CAT) activity, effectively decomposing H2O2 into water (H2O) and oxygen (O2), thereby overcoming the limitations associated with GOx20,21. Additionally, CeNPs promote angiogenesis and osteogenesis by alleviating oxidative stress and modulating osteocyte signaling via the TGF-β/BMP pathway22,23. In our previous work, a metal-ligand-based nanozyme incorporating cerium and zoledronic acid (ZOL, an osteoclast-inhibiting agent) (ZC NCs) was developed, which not only retains the beneficial properties of CeNPs but also integrates bone-anchoring and osteoclast-inhibiting functions, facilitating the remodeling of osteogenesis/osteoclast balance24. However, the application of ZC NCs in bone defect repair is limited by challenges related to long-term fixation and stability. To address these limitations, hydrogels that mimic the extracellular matrix and possess exceptional drug-loading capacities have emerged as a promising solution. Notably, certain 3D dynamic hydrogels exhibit the unique ability to release drugs in response to changes in the microenvironment25,26. Among these, polyphenol-phenylboronic acid (PBA) hydrogels, formed through dynamic borate ester bond, not only respond to Glu and ROS but also demonstrate wet adhesion and anti-inflammatory properties27,28. In our earlier studies, a dynamic hydrogel based on tannic acid (TA) and PBA was developed29. However, like most polyphenol-based hydrogels, the issue of excessive oxidation during the cross-linking process remained unresolved. Through synthetic optimization and careful proportional regulation, we were able to mitigate this problem, resulting in a Glu/ROS-responsive dynamic hydrogel that strikes a balance between mechanical strength and enhanced anti-inflammatory properties30. These characteristics make polyphenol-based hydrogels loaded with ZC NCs highly promising for the repair of DM-induced bone defects. In this study, we propose a microenvironment-responsive multifunctional all-in-one strategy for repairing DM bone defects. This strategy simultaneously targets hyperglycemia, inflammation, vascular dysfunction, immune dysregulation, and osteoclast/osteoblast imbalance in a concise step. To address the unique microenvironment of DM bone defects, a ZCG multi-nanozyme by integrating GOx into ZC NCs is constructed (Fig. 1). The ZCG is then encapsulated within a dual-responsive hydrogel (AAT hydrogel) crosslinked by TA and PBA. The AAT-ZCG hydrogel, responsive to high Glu and ROS levels, releases TA and ZCG in a microenvironment-dependent manner, thereby regulating macrophage polarization, promoting angiogenesis, and enhancing osteogenesis. Simultaneously, ZCG reduces Glu and inflammation levels through the cascade enzymatic reactions of GOx and CeNPs. The acidic byproducts of these reactions trigger ZCG self-degradation, releasing ZOL, which inhibits osteoclast overactivation. In the DM bone defect microenvironment, the AAT-ZCG hydrogel exerts multiple therapeutic effects: (i) The dual-responsive hydrogel releases TA and ZCG in a microenvironment-dependent manner; (ii) The multi-nanozyme activity of ZCG and TA cascades to reduce local Glu and inflammation levels, while modulating macrophage polarization, promoting angiogenesis, and enhancing osteogenesis; (iii) ZCG decomposition releases ZOL, which induces apoptosis of overactivated osteoclasts, restoring bone regeneration balance; (iv) RNA transcriptome sequencing reveals that the AAT-ZCG hydrogel significantly upregulates FoxO1 expression, a key regulator of inflammation and bone metabolism. In conclusion, this all-in-one microenvironment-responsive multifunctional enzyme-linked hydrogel overcomes the limitations of traditional therapies with single efficacy or complex compositions, offering a concise and efficient integrated approach for diabetic bone defect regeneration.
What the sources say
- Partly supportedcites [11] Wang, Y. et al. M2 macrophage-derived exosomes promote diabetic fracture healing by acting as an immunomodulator. Bioact. Mater. 28, 273–283 (2023). sourceExperimental — accuracy not yet measured
Split into 2 atoms — 0 confirmed, 2 partially supported, 0 disputed, 0 misattributed, 0 unverifiable. Expand the claim to see per-atom verdicts.
plainstates a cause- Asserted: passes — The authors put it forward as true.
- Checkable: passes — It can be checked against evidence.
- Load-bearing: passes — The paper’s conclusions depend on it.
- Based: passes — The paper gives a reason why it holds.
- Partly supported
A result the paper reports from its own data — it cites no other source for it, so there is none to check. The quote shows it is in the paper.
In the paper
“Concentration-dependent screening on BMSCs established 200 ng/mL GOx and 25 mg/mL AAT-ZCG as the optimal, non-cytotoxic concentrations for subsequent experiments (Supplementary Fig. 3–5).”
§ Microenvironment-responsive multifunctional enzyme-linked hydrogel for diabetic bone defect regeneration > Results > In vitro osteogenic differentiation
plain- Asserted: passes — The authors put it forward as true.
- Checkable: passes — It can be checked against evidence.
- Load-bearing: passes — The paper’s conclusions depend on it.
- Based: passes — The paper gives a reason why it holds.
A result the paper states — it cites no source for it, so there is none to check. The quote shows it is in the paper.
In the paper
“Simultaneously, ZCG reduces Glu and inflammation levels through the cascade enzymatic reactions of GOx and CeNPs.”
§ Microenvironment-responsive multifunctional enzyme-linked hydrogel for diabetic bone defect regeneration > Introduction The repair of bone defects in diabetes mellitus (DM) presents a formidable clinical challenge, attributable to the intricate interplay of systemic and local pathological mechanisms1,2. Diabetic patients typically exhibit systemic skeletal metabolic abnormalities, such as reduced bone density and compromised bone quality2,3. The pathological microenvironment in DM bone defect areas is characterized by hyperglycemia, chronic inflammation, vascular dysfunction, and immune dysregulation4–6. Additionally, the advanced glycation end-product deposition, impaired osseous angiogenesis and dysregulated glucose-insulin axis, collectively suppress osteogenic differentiation, impair bone turnover, and compromise healing capacity2,7. Notably, 30-40% of DM patients require exogenous insulin administration for glycemic control, which paradoxically enhances osteoclastogenesis8. The imbalance between osteoblast and osteoclast activity further complicates bone defect repair in DM9,10. Furthermore, clinical management often fails to address the combined effects of DM-induced chronic inflammation and acute inflammation triggered by bone injury, leading to disrupted macrophage polarization and immune dysregulation, which further hinder bone repair11. Currently, the repair of DM bone defects is not recognized as a distinct pathological entity and is treated as separate conditions, highlighting the urgent need for strategies to modulate the microenvironment and enhance bone regeneration in DM12. In addition to conventional hypoglycemic agents such as insulin, metformin, and sodium-glucose co-transporter 2 inhibitors, glucose oxidase (GOx) has emerged as a promising enzymatic therapeutic strategy13,14. It efficiently catalyzes the in situ conversion of Glu into hydrogen peroxide (H2O2) and gluconic acid15. However, the application of GOx is limited by the generation of H2O2 as a byproduct during catalysis. As a reactive oxygen species (ROS), H2O2 promotes oxidative stress, exacerbates bone tissue degradation, and hinders bone regeneration, counteracting GOx’s potential benefits16. Without effective mitigation, GOx-based therapeutic strategies will remain limited. With the rapid advancement of biomaterial technology, intelligent biomaterials exhibiting ROS scavenging and anti-inflammatory properties have shown considerable promise in the repair of DM bone defects17–19. For instance, cerium-based nanomaterials (CeNPs) mimic catalase (CAT) activity, effectively decomposing H2O2 into water (H2O) and oxygen (O2), thereby overcoming the limitations associated with GOx20,21. Additionally, CeNPs promote angiogenesis and osteogenesis by alleviating oxidative stress and modulating osteocyte signaling via the TGF-β/BMP pathway22,23. In our previous work, a metal-ligand-based nanozyme incorporating cerium and zoledronic acid (ZOL, an osteoclast-inhibiting agent) (ZC NCs) was developed, which not only retains the beneficial properties of CeNPs but also integrates bone-anchoring and osteoclast-inhibiting functions, facilitating the remodeling of osteogenesis/osteoclast balance24. However, the application of ZC NCs in bone defect repair is limited by challenges related to long-term fixation and stability. To address these limitations, hydrogels that mimic the extracellular matrix and possess exceptional drug-loading capacities have emerged as a promising solution. Notably, certain 3D dynamic hydrogels exhibit the unique ability to release drugs in response to changes in the microenvironment25,26. Among these, polyphenol-phenylboronic acid (PBA) hydrogels, formed through dynamic borate ester bond, not only respond to Glu and ROS but also demonstrate wet adhesion and anti-inflammatory properties27,28. In our earlier studies, a dynamic hydrogel based on tannic acid (TA) and PBA was developed29. However, like most polyphenol-based hydrogels, the issue of excessive oxidation during the cross-linking process remained unresolved. Through synthetic optimization and careful proportional regulation, we were able to mitigate this problem, resulting in a Glu/ROS-responsive dynamic hydrogel that strikes a balance between mechanical strength and enhanced anti-inflammatory properties30. These characteristics make polyphenol-based hydrogels loaded with ZC NCs highly promising for the repair of DM-induced bone defects. In this study, we propose a microenvironment-responsive multifunctional all-in-one strategy for repairing DM bone defects. This strategy simultaneously targets hyperglycemia, inflammation, vascular dysfunction, immune dysregulation, and osteoclast/osteoblast imbalance in a concise step. To address the unique microenvironment of DM bone defects, a ZCG multi-nanozyme by integrating GOx into ZC NCs is constructed (Fig. 1). The ZCG is then encapsulated within a dual-responsive hydrogel (AAT hydrogel) crosslinked by TA and PBA. The AAT-ZCG hydrogel, responsive to high Glu and ROS levels, releases TA and ZCG in a microenvironment-dependent manner, thereby regulating macrophage polarization, promoting angiogenesis, and enhancing osteogenesis. Simultaneously, ZCG reduces Glu and inflammation levels through the cascade enzymatic reactions of GOx and CeNPs. The acidic byproducts of these reactions trigger ZCG self-degradation, releasing ZOL, which inhibits osteoclast overactivation. In the DM bone defect microenvironment, the AAT-ZCG hydrogel exerts multiple therapeutic effects: (i) The dual-responsive hydrogel releases TA and ZCG in a microenvironment-dependent manner; (ii) The multi-nanozyme activity of ZCG and TA cascades to reduce local Glu and inflammation levels, while modulating macrophage polarization, promoting angiogenesis, and enhancing osteogenesis; (iii) ZCG decomposition releases ZOL, which induces apoptosis of overactivated osteoclasts, restoring bone regeneration balance; (iv) RNA transcriptome sequencing reveals that the AAT-ZCG hydrogel significantly upregulates FoxO1 expression, a key regulator of inflammation and bone metabolism. In conclusion, this all-in-one microenvironment-responsive multifunctional enzyme-linked hydrogel overcomes the limitations of traditional therapies with single efficacy or complex compositions, offering a concise and efficient integrated approach for diabetic bone defect regeneration.
plainstates a cause- Asserted: passes — The authors put it forward as true.
- Checkable: passes — It can be checked against evidence.
- Load-bearing: passes — The paper’s conclusions depend on it.
- Based: passes — The paper gives a reason why it holds.
42 more claims
Create a free account to see all 100 claims and every source verdict.
- It may state two separate claims as one. 48
- The quote only partly states this claim. 4
- Probably not a substantial claim. 6
Citations
Cites
Hydrogel microparticles for biomedical applications
Daly, A. C., Riley, L., Segura, T., & Burdick, J. A. (2019) · Nature Reviews Materials · doi:10.1038/s41578-019-0148-6 · Cited by 1,249 · cited 1×
“Notably, certain 3D dynamic hydrogels exhibit the unique ability to release drugs in response to changes in the microenvironment 25,26 .”
Mechanisms of diabetes mellitus-induced bone fragility
On behalf of the IOF Bone and Diabetes Working Group, Napoli, N., Chandran, M., Pierroz, D. D., Abrahamsen, B., Schwartz, A. V., & Ferrari, S. L. (2017) · Nature Reviews Endocrinology · doi:10.1038/nrendo.2016.153 · Cited by 1,107 · cited 3×
“Diabetic patients typically exhibit systemic skeletal metabolic abnormalities, such as reduced bone density and compromised bone quality 2,3 .”
Human blood vessel organoids as a model of diabetic vasculopathy
Wimmer, R. A., Leopoldi, A., Aichinger, M., Wick, N., Hantusch, B., Novatchkova, M., Taubenschmid, J., Hämmerle, M., Esk, C., Bagley, J. A., et al. (2019) · Nature · doi:10.1038/s41586-018-0858-8 · Cited by 803 · cited 1×
“The pathological microenvironment in DM bone defect areas is characterized by hyperglycemia, chronic in fl ammation, vascular dysfunction, and immune dysregulation 4 – 6 .”
Targeting innate immune mediators in type 1 and type 2 diabetes
Donath, M. Y., Dinarello, C. A., & Mandrup-Poulsen, T. (2019) · Nature Reviews Immunology · doi:10.1038/s41577-019-0213-9 · Cited by 416
Supramolecular engineering of hydrogels for drug delivery
Bernhard, S., & Tibbitt, M. W. (2021) · Advanced Drug Delivery Reviews · doi:10.1016/j.addr.2021.02.002 · Cited by 363 · cited 1×
“Notably, certain 3D dynamic hydrogels exhibit the unique ability to release drugs in response to changes in the microenvironment 25,26 .”
Rached, M.-T., Kode, A., Xu, L., Yoshikawa, Y., Paik, J.-H., DePinho, R. A., & Kousteni, S. (2010) · Cell Metabolism · doi:10.1016/j.cmet.2010.01.001 · Cited by 327 · cited 1×
“33).”
Li, D., Chen, K., Tang, H., Hu, S., Xin, L., Jing, X., He, Q., Wang, S., Song, J., Mei, L., et al. (2022) · Advanced Materials · doi:10.1002/adma.202108430 · Cited by 314 · cited 2×
“With the rapid advancement of biomaterial technology, intelligent biomaterials exhibiting ROS scavenging and anti-in fl ammatory properties have shown considerable promise in the repair of DM bone defects 17 – 19 .”
Update on the pathogenesis and treatment of skeletal fragility in type 2 diabetes mellitus
Khosla, S., Samakkarnthai, P., Monroe, D. G., & Farr, J. N. (2021) · Nature Reviews Endocrinology · doi:10.1038/s41574-021-00555-5 · Cited by 260 · cited 1×
“The repair of bone defects in diabetes mellitus (DM) presents a formidable clinical challenge, attributable to the intricate interplay of systemic and local pathological mechanisms 1,2 .”
Liu, C., Zhang, M., Geng, H., Zhang, P., Zheng, Z., Zhou, Y., & He, W. (2021) · Applied Catalysis B: Environmental · doi:10.1016/j.apcatb.2021.120317 · Cited by 236 · cited 2×
“For instance, cerium-based nanomaterials (CeNPs) mimic catalase(CAT) activity, effectively decomposing H 2 O 2 intowater (H 2 O) and oxygen (O 2 ), thereby overcoming the limitations associated with GOx 20,21 .”
Self-powered enzyme-linked microneedle patch for scar-prevention healing of diabetic wounds
Zhang, X., Wang, Z., Jiang, H., Zeng, H., An, N., Liu, B., Sun, L., & Fan, Z. (2023) · Science Advances · doi:10.1126/sciadv.adh1415 · Cited by 167 · cited 1×
“In addition to conventional hypoglycemic agents such as insulin, metformin, and sodium-glucose co-transporter 2 inhibitors, glucose oxidase (GOx) has emerged as a promising enzymatic therapeutic strategy 13,14 .”
Cited by
Mao, Y., Tian, Z., Zhang, T., Qian, X., Han, P., Wang, Y., Xie, L., Qiao, H., Zheng, S., Chang, X., et al. (2026) · Biomaterials Advances · doi:10.1016/j.bioadv.2026.214819 · Cited by 5
Comprehensive Review of Hydrogel-Mediated Strategies for Diabetic Wound Healing
Fan, Z., Li, J., Zhong, C., et al. (2026) · International Journal of Molecular Sciences · doi:10.3390/ijms27093915 · Cited by 4
“Thus, pH-responsive hydrogels can enhance local drug bioavailability at the lesion site and improve revascularization and tissue repair in difficult-to-heal wounds [14].”
Liu, Z., Wu, Y., Yang, C. R., Wang, R., Hu, L., Hu, S., Wu, X., Chang, J., Ma, J. F., & Yuan, J. (2026) · Regenerative Biomaterials · doi:10.1093/rb/rbag083 · Cited by 3
“Diabetic bone defects present a fundamentally different regenerative challenge compared with non-diabetic conditions, as hyperglycemia induces a persistent pathological microenvironment characterized by excessive oxidative stress, chronic inflammation and metabolic dysregulation [14, 29].”
Tang, M., Zhang, L., Hieawy, A., Liang, S., Liu, H., & Shen, Y. (2026) · Materials & Design · doi:10.1016/j.matdes.2026.116416 · Cited by 5
Jiang, H., Zhang, Y., Luo, Z., Tang, X., 赫一佑, & Hao, G. (2026) · Frontiers in Immunology · doi:10.3389/fimmu.2026.1808488 · Cited by 7
“These materials promote synergistic tissue regeneration by locally releasing bioactive molecules that reverse the microenvironmental deterioration (165).”
Self-citation
Metadata
- Authors
- Fu, X., Luo, Z., Guo, Y., Meng, W., Jin, S., Chen, J., Cai, Y., Luo, Z., Huang, C., Chen, A., Guo, S., Chen, M., Zhou, Z., & Zeng, W.
- Affiliations
- Sichuan University (CN)
- Chinese People's Liberation Army (CN)
- Corresponding author
- Zhou, Zongke
- Zeng, Weinan
- ORCID
- Venue
- Nature Communications
- Published
- 2025-11-21
- Volume
- 16
- Issue
- 1
- Pages
- 10275-10275
- ISSN
- 2041-1723 (ISSN-L)
- PMC
- PMC12639025
- OpenAlex
- W4416470470
- Cited by
- 44
- References
- 29
- Citations by year
- 2026: 44
- FWCI
- 10.63
- Type
- journal article
- Language
- en
- Open access
- gold
- doi.org
- Licence
- cc-by-nc-nd
- creativecommons.org/licenses/by-nc-nd/4.0 (tdm)
- creativecommons.org/licenses/by-nc-nd/4.0 (vor)
- Locations
- Nature Communications (publishedVersion, cc-by-nc-nd)
- Europe PMC (PubMed Central) (publishedVersion, cc-by-nc-nd)
- PubMed (publishedVersion)
- DOAJ (DOAJ: Directory of Open Access Journals) (submittedVersion, cc-by-sa)
- Funders
- National Natural Science Foundation of China (82272483, 82472430)
- Topics
- Physical Sciences › Engineering › Biomedical Engineering › Bone Tissue Engineering Materials
- Health Sciences › Medicine › Surgery › Wound Healing and Treatments
- Physical Sciences › Materials Science › Biomaterials › Hydrogels: synthesis, properties, applications
- Keywords
- diabetic bone defects, hydrogels, glucose-responsive release, reactive oxygen species scavenging, nanozymes, tannic acid, borate ester bonds, glucose oxidase, cerium, zoledronic acid, macrophage polarization, angiogenesis, bone formation, osteoclast inhibition, FOXO1, bone regeneration, inflammation
- MeSH terms
- RAW 264.7 Cells, Zoledronic Acid, Animals, Bone Regeneration, Cerium, Diabetes Mellitus, Experimental, Glucose, Glucose Oxidase, Humans, Macrophages, Male, Mice, Inbred C57BL, Osteogenesis, Tannins, Reactive Oxygen Species, Hydrogels, Mice
About these checks
Registry, retraction, Cites and statistics results are computed, not judged, with one exception: a printed reference that no index lists is read once by a model before it counts as a citation error. Claims are extracted by a model and kept only when their quote appears verbatim in the text; each cited source is then checked, with a model’s help, for whether it says what the claim relies on. Those verdicts can be wrong — read the claim’s quote and the cited source before relying on one.
The claim verdicts this report counts are experimental: their accuracy is not yet measured.
A language model drew the claims from the paper on 2026-10-11, under version 3 of the claim definition (model deepseek-v4.1-flash, prompt extract-v3).
A second model labelled each claim on 2026-10-11 (model jev-1.13-20260917, definition revision gold-guideline-v0.2).
Cited sources are checked with a language model’s help (gpt-6-sol and qwen3.8-omni-flash).
Statistics and arithmetic are recomputed, not judged.
Confidence bands are shown only for fields calibrated on our annotated test set. None is calibrated yet, so no band is shown.
What counts as a claim ›How we measure confidence ›How we check this ›
Are you an author, or do you see a problem with this page? Request a review
How to cite
Cite CoChat for the checks on this page, and the paper for its own findings.
- This page
- CoChat. (2026). Citation check: Microenvironment-responsive multifunctional enzyme-linked hydrogel for diabetic bone defect regeneration. https://app.cochat.ai/papers/10.1038/s41467-025-65165-5
- The paper
- Fu, X., Luo, Z., Guo, Y., Meng, W., Jin, S., Chen, J., Cai, Y., Luo, Z., Huang, C., Chen, A., Guo, S., Chen, M., Zhou, Z., & Zeng, W. (2025). Microenvironment-responsive multifunctional enzyme-linked hydrogel for diabetic bone defect regeneration. Nature Communications. https://doi.org/10.1038/s41467-025-65165-5
Data sources
Bibliographic data: Semantic Scholar, OpenAlex, Crossref.
Contains information from the Semantic Scholar Academic Graph Datasets, made available under the ODC Attribution License (ODC-BY 1.0).
Semantic Scholar’s data is described in: Kinney, R., et al. (2023). The Semantic Scholar Open Data Platform. arXiv:2301.10140.
