

The DOI matches its Crossref record; 68 of the 68 references it cites were found in a registry or an index.
Analysis of microbial compositions: a review of normalization and differential abundance analysis
Open accessAbstract
Increasingly, researchers are discovering associations between microbiome and a wide range of human diseases such as obesity, inflammatory bowel diseases, HIV, and so on. The first step towards microbiome wide association studies is the characterization of the composition of human microbiome under different conditions. Determination of differentially abundant microbes between two or more environments, known as differential abundance (DA) analysis, is a challenging and an important problem that has received considerable interest during the past decade. It is well documented in the literature that the observed microbiome data (OTU/SV table) are relative abundances with an excess of zeros. Since relative abundances sum to a constant, these data are necessarily compositional. In this article we review some recent methods for DA analysis and describe their strengths and weaknesses.
Overview
The claims and statistics of this paper haven’t been checked yet.
Run the check — free, no account needed. It reads the open-access text and checks the sources it cites.
Integrity signals
Registry
Cites
Statistics
Figures
Verification
Claims the paper makes
The claims and statistics of this paper haven’t been checked yet.
Run the check — free, no account needed. It reads the open-access text and checks the sources it cites.
Claims other papers make about this one
Each is checked against this paper’s own text: does it say what the citing paper says it does?
In the citing paper
“A recent approach called differential ranking is robust to the choice of the alr reference feature, and ranks produced from relative abundances are identical to the ranks of absolute abundances66,67.”
From Longitudinal gut microbiome changes in immune checkpoint blockade-treated advanced melanoma (2024) · cites this paper as [66]
Self-check
Percentages, sums and reported differences re-computed from the paper’s own numbers.
The self-check needs the paper’s full text.
Citations
Cites
Controlling the False Discovery Rate: A Practical and Powerful Approach to Multiple Testing
Benjamini, Y., & Hochberg, Y. (1995) · Journal of the Royal Statistical Society Series B: Statistical Methodology · doi:10.1111/j.2517-6161.1995.tb02031.x · Cited by 109,482 · cited 2×
“By default, ANCOM-BC implements Holm-Bonferroni 70 method and other DA methods implement BH procedure 57 to adjust for multiple comparisons.”
MethodModerated estimation of fold change and dispersion for RNA-seq data with DESeq2
Love, M. I., Huber, W., & Anders, S. (2014) · Genome Biology · doi:10.1186/s13059-014-0550-8 · Cited by 95,106 · cited 3×
“Some commonly used normalization methods include Cumulative-Sum Scaling (CSS) implemented in metagenome-Seq 21 , Median (MED) in DESeq2 41 , Upper Quartile (UQ) 42 and Trimmed Mean of M-values (TMM) 43 in edgeR 44 and Wrench 45 , and Total-Sum Scaling (TSS) which simply transforms the abundance…”
InfluentialRobinson, M. D., McCarthy, D. J., & Smyth, G. K. (2010) · Bioinformatics · doi:10.1093/bioinformatics/btp616 · Cited by 41,364
DADA2: High–resolution sample inference from Illumina amplicon data
Callahan, B. J., McMurdie, P. J., Rosen, M. J., Han, A. W., Johnson, A. J. A., & Holmes, S. P. (2016) · Nature Methods · doi:10.1038/nmeth.3869 · Cited by 35,698
Reproducible, interactive, scalable and extensible microbiome data science using QIIME 2
Bolyen, E., Rideout, J. R., Dillon, M. R., Bokulich, N. A., Abnet, C. C., Al-Ghalith, G. A., Alexander, H., Alm, E. J., Arumugam, M., Asnicar, F., et al. (2019) · Nature Biotechnology · doi:10.1038/s41587-019-0209-9 · Cited by 23,742
A Simple Sequentially Rejective Multiple Test Procedure
(1979) · Scandinavian Journal of Statistics · doi:10.2307/4615733 · Cited by 21,526 · cited 1×
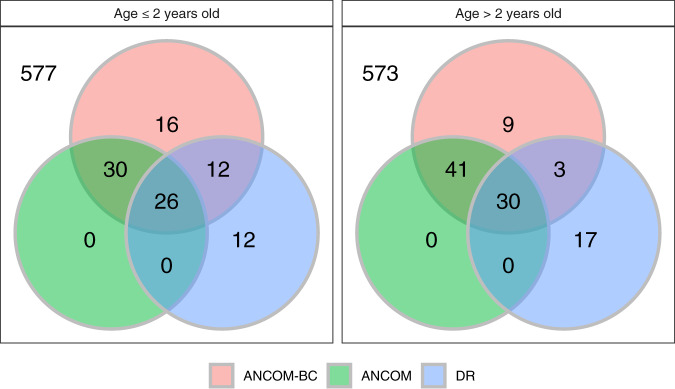
“The sample sizes in the two age categories (≤2 years, >2 years) for Malawi (MA), USA (US) and Venezuela (VEN) are (47, 36), (50, 260), and (27, 70), respectively.”
BackgroundUPARSE: highly accurate OTU sequences from microbial amplicon reads
Edgar, R. C. (2013) · Nature Methods · doi:10.1038/nmeth.2604 · Cited by 16,770
Metagenomic biomarker discovery and explanation
Segata, N., Izard, J., Waldron, L., Gevers, D., Miropolsky, L., Garrett, W. S., & Huttenhower, C. (2011) · Genome Biology · doi:10.1186/gb-2011-12-6-r60 · Cited by 16,192
Differential expression analysis for sequence count data
Anders, S., & Huber, W. (2010) · Genome Biology · doi:10.1186/gb-2010-11-10-r106 · Cited by 15,581
A scaling normalization method for differential expression analysis of RNA-seq data
Robinson, M. D., & Oshlack, A. (2010) · Genome Biology · doi:10.1186/gb-2010-11-3-r25 · Cited by 7,876
Research works printed but not linked: 1
- Gotelli, N. J. & Colwell, R. K. Estimating species richness. Biol. Divers. Front. Meas. Assess. 12, 39–54 (2011).
Cited by
Sorted by citations
Items 301–345 of 345
Song, H., Ling, W., Zhao, N., Plantinga, A., Broedlow, C. A., Klatt, N. R., Hensley‐McBain, T., & Wu, M. C. (2023) · Figshare · doi:10.6084/m9.figshare.22613500
Li, X., Omolehin, O., Hemmings, G., Tseng, H. T., Taylor, A. M., Taylor, C., Kong, P., Daughtrey, M., Luster, D. G., Gouker, F. E., et al. (2023) · Figshare · doi:10.6084/m9.figshare.23937257
Aya, V., Jiménez, P., Muñoz, E., & Ramírez, J. D. (2024) · Figshare · doi:10.6084/m9.figshare.26596781
Additional file 3 of Controlling taxa abundance improves metatranscriptomics differential analysis
Ji, Z., & Ma, L. (2023) · Figshare · doi:10.6084/m9.figshare.22618393
Wang, C., Segal, L. N., Hu, J., Zhou, B., Hayes, R. B., Ahn, J., & Li, H. (2022) · Figshare · doi:10.6084/m9.figshare.20444187
Coffey, E. L., Gomez, A. M., Ericsson, A. C., Burton, E. N., Granick, J. L., Lulıch, J. P., & Furrow, E. (2023) · Figshare · doi:10.6084/m9.figshare.22631454
Khafaji, A. K. A., Gómez‐Llorente, C., & Camacho, J. (2026) · bioRxiv (Cold Spring Harbor Laboratory) · doi:10.64898/2026.01.13.699216
“The 16s rRNA gene is the widely accepted method when the interest lies in the specific microbial composition of a sample [7, 9, 10].”
Single-cell differential abundance detection: A new angle on dissecting tumor heterogeneity
Xiao, Y.-X., Sun, J., Xie, L., Zou, Y., Li, T., Hao, Y., & Li, B. (2026) · World Journal of Clinical Oncology · doi:10.5306/wjco.v17.i1.113244
DecoDiPhy: Deconvolving Phylogenetic Distance MixturesPreprint
Arasti, S., Şapcı, A. O. B., Rachtman, E., El-Kebir, M., & Mirarab, S. (2026) · bioRxiv (Cold Spring Harbor Laboratory) · doi:10.64898/2026.01.18.700179
“A rich toolkit uses phylogenetic profiles in downstream analyses such as comparing and clustering samples [30, 31], extracting phylogeny-aware features [32, 33] for supervised learning [34–37], and di ! erential abundance across phenotypes [38, 39].”
Microbiome Profiling in Chagas Disease: Sample Collection, Sequencing, and Analysis
Castañeda, S., Ramírez, J. D., & Poveda, C. (2026) · Methods in molecular biology · doi:10.1007/978-1-0716-5142-1_15
Jeong, J. H., Ma, S., & Lee, K. (2026) · Statistical Analysis and Data Mining The ASA Data Science Journal · doi:10.1002/sam.70064
Mak, I. E. K., Yao, Y., Sutanto, C. N., Leong, Z. N., Khoo, C. M., & Kim, J. E. (2026) · Food Research International · doi:10.1016/j.foodres.2026.118660
Metagenomics - AI powered prediction of Inflammatory Bowel’s Disease and Probiotic RecommendationPreprint
Kumar, S. N., Thomas, M., Chinnakanu, S. J., Melethadathil, N., & Subramaniam, S. (2026) · medRxiv · doi:10.64898/2026.02.12.26345333
Machine learning-based identification of key indicator species in coral reef fish assemblages
DJIFACK, E. E. K., Prifti, E., Lamy, T., Baletaud, F., Zucker, J., Tsopzé, N., Vigliola, L., & Belda, E. (2026) · Ecological Informatics · doi:10.1016/j.ecoinf.2026.103704
“…in microbial ecology, where different approaches have been proposed to address problems like the compositional nature of relative abundance profiles (Gloor and Reid, 2016) or the normalization strategies to account for confusion factors before association studies (Lin and Peddada, 2020).”
Sanabria-Veaz, M. G., Holthaus, T. A., Oleksiak, M., Revilla, D., Alvarado, D. A., Perez-Tamayo, M., Khan, N. A., & Holscher, H. D. (2026) · medRxiv · doi:10.64898/2026.03.15.26348343
Microbiome Landscapes in Squamous Cell Carcinoma Tissue Microenvironments: A Comparative Analysis
Yao, R., Qian, F., Zhao, H., Shen, X., Zhu, Y., & Wang, L. (2026) · Immunity Inflammation and Disease · doi:10.1002/iid3.70406
“Finally, the assigned taxa were aggregated at the genus level and the relative abundance was calculated, which is the fraction of the taxon observed in the feature table relative to the sum of all taxa in the sample (ranging from 0 to 1) [9], for follow‐up analysis.”
Kroboth, C., Penagos-Tabares, F., Klein-Jöbstl, D., & Metzler-Zebeli, B. U. (2026) · Research in Veterinary Science · doi:10.1016/j.rvsc.2026.106180
Network-based machine learning methods to model variability across individuals
Yousefi, B. (2023) · theses.fr (ABES) · doi:10.70675/b7843ad7z3ae0z43caz9e47zf95945cd3b83
Interaction-Aware Stiffness Design for Muscle-Inspired Tensegrity Exoskeleton
Wei, D., Cui, C., & Cao, Y. (2026) · Journal of Bionic Engineering · doi:10.1007/s42235-026-00897-8
Bacterial taxa associated with lung cancer cases in Southeast Asians: a pilot case-control study
Low, A., Juang, Y. R., Ivan, F. X., Ang, L., Ooi, L. H. S., Chan, S. W. J., Aogáin, M. M., Jaggi, T. K., Chotirmall, S. H., Boucher, Y., et al. (2026) · Cellular Oncology · doi:10.1007/s13402-026-01193-7
“Leveraging next-generation sequencing technologies, current lung cancer microbiome studies primarily utilize 16S rRNA gene amplicon sequencing to characterize microbial communities [12].”
Understanding the bias of compositional microbiome differential abundance estimationPreprint
Calle, M. L., Pujolassos, M., & Susín, A. (2026) · bioRxiv (Cold Spring Harbor Laboratory) · doi:10.64898/2026.04.28.721392
“The bias introduced when estimating differential abundance from relative abundances has been widely described in the literature (e.g., Morton et al. 2019; Lin and Peddada 2020a).”
Liraglutide Modifies Gut Microbiota Without Modulating Doxorubicin-Induced Toxicity in Rats
Tonon, C. R., Monte, M. G., Balin, P. D. S., Fujimori, A. S. S., Ferreira, N. F., Vieira, N. M., Carreira, L. P., Rodrigues, M. A. M., Rodrigues, J., Junior, L. A., et al. (2026) · Antioxidants · doi:10.3390/antiox15050538
“Relative abundance refers to the proportion of specific bacteria in a bacterial community [57].”
Machine learning applications in microbiome analysis
Farooqui, A. K., & Amir, M. (2026) · Elsevier eBooks · doi:10.1016/b978-0-443-40551-8.00015-9
Li, X., Li, J., Li, L., Jiang, F., Wang, X., & Yu, G. (2026) · Building and Environment · doi:10.1016/j.buildenv.2026.114753
Unlocking the Metagenome: Pipeline for Microbiome Data Analysis
Ravikrishnan, A. (2026) · Methods in molecular biology · doi:10.1007/978-1-0716-5080-6_1
Szeto, C. Y. Y., & Kwan, H. S. (2026) · bioRxiv (Cold Spring Harbor Laboratory) · doi:10.64898/2026.05.22.726133
Feng, H., Liu, H., Zhang, Y., Hu, Y., Sun, S., Wang, Y., Zhang, S., Zhao, J., Guo, X., Liu, Z., et al. (2026) · Aquaculture · doi:10.1016/j.aquaculture.2026.744290
Bias-mitigated microbiome inference refines coronary artery disease signaturePreprint
Honeybrook, L. (2026) · bioRxiv (Cold Spring Harbor Laboratory) · doi:10.64898/2026.06.04.730260
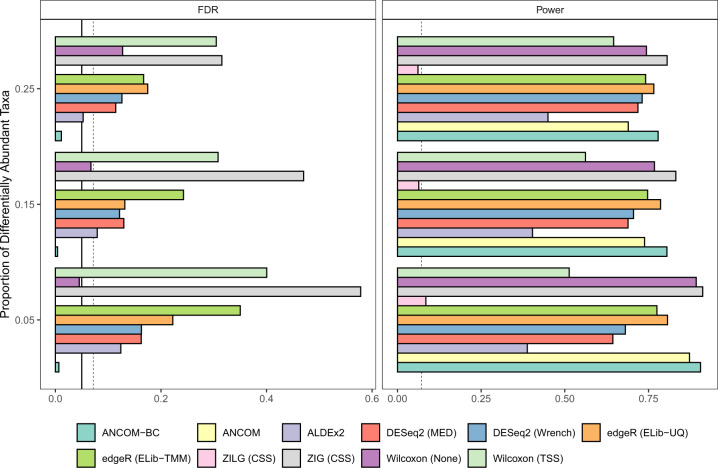
“Of particular note was that Wilcoxon rank-sum tests performed on relative counts (TSS Wilcoxon), despite its simplicity and continued use in the literature [5, 10, 30], showed markedly unstable and high FDRs. Previous works have also shown this [11, 13, 14].”
InfluentialThornton, C. S., Schaupp, L., Tunney, M. M., & Mall, M. A. (2026) · European Respiratory Journal · doi:10.1183/13993003.00239-2026
“This issue is further complicated by the fact that most microbiome datasets are compositional and changes in relative abundance do not necessarily reflect changes in absolute microbial burden [141].”
Multi-Omics and AI Integration for Microbiome-Based Diagnostics
Pîrcălăbioru, G. G., Shirima, C. A., Lixandru-Petre, I.-O., & Neguț, I. (2026) · Advances in computational intelligence and robotics book series · doi:10.4018/979-8-3373-8172-5.ch010
Hernandez, J. B., Abiodun, M., Hayer, S. S., Dickson, T., Ayayee, P. A., & Clayton, J. B. (2026) · Gut Microbes · doi:10.1080/19490976.2026.2687925
Arribas, E. M., Conde‐Pérez, K., Aja‐Macaya, P., Vallejo, J. A., Bou, G., López‐Cheda, A., Pumar, M. A. J., Ladra, S., & Poza, M. (2026) · Bioinformatics Advances · doi:10.1093/bioadv/vbag148
“4.0) (Lin and Peddada 2020a) with manually tuned parameters.”
InfluentialCapriati, A., Martinez, S. J., van Uden, T. K., van der Meer, M. T. J., Purwanto, van de Leemput, I. A., & Becking, L. E. (2026) · Ecological Indicators · doi:10.1016/j.ecolind.2026.115096
Khafaji, A. K. A., Vallejo-España, D., Gómez‐Llorente, C., & Camacho, J. (2026) · Frontiers in Bioinformatics · doi:10.3389/fbinf.2026.1863340
“Among marker gene approaches, 16S rRNA sequencing is widely used when the aim is to characterize the microbial composition of a sample (Durazzi et al., 2021; Lutz et al., 2022; Lin and Peddada, 2020).”
Suteau, L., Campion, C., Marais, C., Briand, M., Hardouin, A., Hellyn, K., Maurice, K., Marchi, M., Simonin, M., & Guschinskaya, N. (2026) · Research Square · doi:10.21203/rs.3.rs-10369696/v1
Mollick, S. A., Khual, G. K., Ghosh, A., Patel, S. K., Bhattacharya, S., Roy, C. S., Maile, A., Nagarajaram, H. A., Longkumer, M., Babu, M. N., et al. (2026) · Current Research in Microbial Sciences · doi:10.1016/j.crmicr.2026.100650
“…differences in sequencing depth (library size) between samples and is a widely adopted normalization approach for relative abundance-based microbiome community analyses, including dissimilarity, constrained ordination, and differential abundance methods used in this study (Lin and Peddada, 2020).”
Zhang, S., Zhang, N., Zhang, X., Liu, Y., Feng, Y., Xiang, J., Zhang, J., Ma, H., Lu, Y., & Zhang, T. (2026) · Microbiome · doi:10.1186/s40168-026-02475-w
“In order to account for the compositional nature of metagenomic data and to normalize the skewed distribution of microbial features, centered log-ratio (CLR) transformation was performed using the geometric mean of relative abundances of these features as the CLR denominator [31].”
Xie, J., Zhong, J., Zhang, Y., He, F., Wang, J., Xu, K., Chen, J., Wang, Y., & Xie, P. (2026) · Frontiers in Bioscience-Landmark · doi:10.31083/fbl52570
Liu, Z., Li, P., Cecarini, V., Eleuteri, A. M., Nan, B., & Piao, C. (2026) · Phytomedicine · doi:10.1016/j.phymed.2026.158678
Design, processing, and modeling for longitudinal multiomics microbiome data
Ma, K., Thairu, M. W., & Sankaran, K. (2026) · Frontiers in Cellular and Infection Microbiology · doi:10.3389/fcimb.2026.1837109
“A normalization transformation can help place samples on the same scale (Lin and Das Peddada, 2020; Sun and Xia, 2024).”
Global Reanalysis Reveals Recurrent Cyanobacterial Enrichment in the Aquatic Plastisphere
Verma, S., Bairoliya, S., Wang, Y., Ridley, R. S., Liu, Y., Konstantinidis, K. T., Yin, X., & Cao, B. (2026) · Environmental Science & Technology · doi:10.1021/acs.est.6c06460
Le, D., Portik, D. M., Konno, T., Leonard, M. M., Miranda-Ribera, A., Fasano, A., & Zomorrodi, A. R. (2026) · bioRxiv (Cold Spring Harbor Laboratory) · doi:10.64898/2026.09.11.749611
Miastowska, A., Augustyniak, A., Grygorcewicz, B., & Nawrotek, P. (2026) · Journal of Veterinary Research · doi:10.2478/jvetres-2026-0052
“This structure creates a challenge for differential abundance methods and requires the use of logarithmic or other transformations to account for excess zeros when identifying taxa that differ between groups (63).”
Liu, K., Sun, Y., Wang, C., Jin, D., Xiao, C., & Deng, L. (2026) · Environment International · doi:10.1016/j.envint.2026.110584
Metadata
- Authors
- Lin, H., & Peddada, S. D.
- Affiliations
- National Institutes of Health (US)
- Corresponding author
- Peddada, Shyamal Das
- Venue
- npj Biofilms and Microbiomes
- Published
- 2020-12-02
- Volume
- 6
- Issue
- 1
- Pages
- 60-60
- ISSN
- 2055-5008 (ISSN-L)
- PMC
- PMC7710733
- OpenAlex
- W3109541743
- Cited by
- 341
- References
- 68
- Citations by year
- 2026: 57 · 2025: 73 · 2024: 67 · 2023: 77 · 2022: 55 · 2021: 11
- FWCI
- 3.45
- Type
- journal article
- Language
- en
- Open access
- gold
- doi.org
- Locations
- npj Biofilms and Microbiomes (publishedVersion, cc-by)
- PubMed Central (publishedVersion, cc-by)
- PubMed (publishedVersion)
- Funders
- University of Pittsburgh
- Topics
- Life Sciences › Biochemistry, Genetics and Molecular Biology › Molecular Biology › Gut microbiota and health
- Physical Sciences › Environmental Science › Ecology › Microbial Community Ecology and Physiology
- Life Sciences › Biochemistry, Genetics and Molecular Biology › Molecular Biology › Genomics and Phylogenetic Studies
- Keywords
- microbiome, differential abundance, compositional data, normalization, zero-inflated data, OTU table, sequencing read counts, human microbiome
- MeSH terms
- Gastrointestinal Microbiome, Bacteria, Humans, Models, Theoretical, Mouth, Phylogeny
About these checks
Registry, retraction, Cites and statistics results are computed, not judged, with one exception: a printed reference that no index lists is read once by a model before it counts as a citation error. Claims are extracted by a model and kept only when their quote appears verbatim in the text; each cited source is then checked, with a model’s help, for whether it says what the claim relies on. Those verdicts can be wrong — read the claim’s quote and the cited source before relying on one.
Statistics and arithmetic are recomputed, not judged.
Confidence bands are shown only for fields calibrated on our annotated test set. None is calibrated yet, so no band is shown.
What counts as a claim ›How we measure confidence ›How we check this ›
Are you an author, or do you see a problem with this page? Request a review
