

The DOI matches its Crossref record; 68 of the 68 references it cites were found in a registry or an index.
Analysis of microbial compositions: a review of normalization and differential abundance analysis
Open accessAbstract
Increasingly, researchers are discovering associations between microbiome and a wide range of human diseases such as obesity, inflammatory bowel diseases, HIV, and so on. The first step towards microbiome wide association studies is the characterization of the composition of human microbiome under different conditions. Determination of differentially abundant microbes between two or more environments, known as differential abundance (DA) analysis, is a challenging and an important problem that has received considerable interest during the past decade. It is well documented in the literature that the observed microbiome data (OTU/SV table) are relative abundances with an excess of zeros. Since relative abundances sum to a constant, these data are necessarily compositional. In this article we review some recent methods for DA analysis and describe their strengths and weaknesses.
Overview
The claims and statistics of this paper haven’t been checked yet.
Run the check — free, no account needed. It reads the open-access text and checks the sources it cites.
Integrity signals
Registry
Cites
Statistics
Figures
Verification
Claims the paper makes
The claims and statistics of this paper haven’t been checked yet.
Run the check — free, no account needed. It reads the open-access text and checks the sources it cites.
Claims other papers make about this one
Each is checked against this paper’s own text: does it say what the citing paper says it does?
In the citing paper
“A recent approach called differential ranking is robust to the choice of the alr reference feature, and ranks produced from relative abundances are identical to the ranks of absolute abundances66,67.”
From Longitudinal gut microbiome changes in immune checkpoint blockade-treated advanced melanoma (2024) · cites this paper as [66]
Self-check
Percentages, sums and reported differences re-computed from the paper’s own numbers.
The self-check needs the paper’s full text.
Citations
Cites
Controlling the False Discovery Rate: A Practical and Powerful Approach to Multiple Testing
Benjamini, Y., & Hochberg, Y. (1995) · Journal of the Royal Statistical Society Series B: Statistical Methodology · doi:10.1111/j.2517-6161.1995.tb02031.x · Cited by 109,482 · cited 2×
“By default, ANCOM-BC implements Holm-Bonferroni 70 method and other DA methods implement BH procedure 57 to adjust for multiple comparisons.”
MethodModerated estimation of fold change and dispersion for RNA-seq data with DESeq2
Love, M. I., Huber, W., & Anders, S. (2014) · Genome Biology · doi:10.1186/s13059-014-0550-8 · Cited by 95,106 · cited 3×
“Some commonly used normalization methods include Cumulative-Sum Scaling (CSS) implemented in metagenome-Seq 21 , Median (MED) in DESeq2 41 , Upper Quartile (UQ) 42 and Trimmed Mean of M-values (TMM) 43 in edgeR 44 and Wrench 45 , and Total-Sum Scaling (TSS) which simply transforms the abundance…”
InfluentialRobinson, M. D., McCarthy, D. J., & Smyth, G. K. (2010) · Bioinformatics · doi:10.1093/bioinformatics/btp616 · Cited by 41,364
DADA2: High–resolution sample inference from Illumina amplicon data
Callahan, B. J., McMurdie, P. J., Rosen, M. J., Han, A. W., Johnson, A. J. A., & Holmes, S. P. (2016) · Nature Methods · doi:10.1038/nmeth.3869 · Cited by 35,698
Reproducible, interactive, scalable and extensible microbiome data science using QIIME 2
Bolyen, E., Rideout, J. R., Dillon, M. R., Bokulich, N. A., Abnet, C. C., Al-Ghalith, G. A., Alexander, H., Alm, E. J., Arumugam, M., Asnicar, F., et al. (2019) · Nature Biotechnology · doi:10.1038/s41587-019-0209-9 · Cited by 23,742
A Simple Sequentially Rejective Multiple Test Procedure
(1979) · Scandinavian Journal of Statistics · doi:10.2307/4615733 · Cited by 21,526 · cited 1×
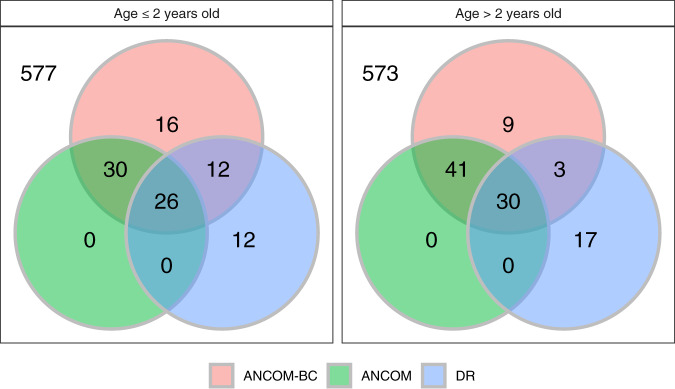
“The sample sizes in the two age categories (≤2 years, >2 years) for Malawi (MA), USA (US) and Venezuela (VEN) are (47, 36), (50, 260), and (27, 70), respectively.”
BackgroundUPARSE: highly accurate OTU sequences from microbial amplicon reads
Edgar, R. C. (2013) · Nature Methods · doi:10.1038/nmeth.2604 · Cited by 16,770
Metagenomic biomarker discovery and explanation
Segata, N., Izard, J., Waldron, L., Gevers, D., Miropolsky, L., Garrett, W. S., & Huttenhower, C. (2011) · Genome Biology · doi:10.1186/gb-2011-12-6-r60 · Cited by 16,192
Differential expression analysis for sequence count data
Anders, S., & Huber, W. (2010) · Genome Biology · doi:10.1186/gb-2010-11-10-r106 · Cited by 15,581
A scaling normalization method for differential expression analysis of RNA-seq data
Robinson, M. D., & Oshlack, A. (2010) · Genome Biology · doi:10.1186/gb-2010-11-3-r25 · Cited by 7,876
Research works printed but not linked: 1
- Gotelli, N. J. & Colwell, R. K. Estimating species richness. Biol. Divers. Front. Meas. Assess. 12, 39–54 (2011).
Cited by
Sorted by citations
Items 101–200 of 345
Univariate and Multivariate Statistical Analysis of Microbiome Data: An Overview
Aldirawi, H., & Morales, F. G. (2023) · Applied Microbiology · doi:10.3390/applmicrobiol3020023 · Cited by 12
“Some recent studies have indicated the poor performance of these two methods [20,29].”
BackgroundResultRosenqvist, T., Chan, S., Ahlinder, J., Salomonsson, E. N., Suarez, C., Persson, K. M., Rådström, P., & Paul, C. J. (2024) · Water Research · doi:10.1016/j.watres.2024.121203 · Cited by 12
Bashir, Z., Hugerth, L. W., Krog, M. C., Prast‐Nielsen, S., Edfeldt, G., Boulund, F., Schacht, S. R., Tetens, I., Engstrand, L. G., Schuppe‐Koistinen, I., et al. (2024) · Frontiers in Cellular and Infection Microbiology · doi:10.3389/fcimb.2024.1324794 · Cited by 11
Li, J., Zuo, Y., & Zhang, J. (2024) · Microorganisms · doi:10.3390/microorganisms12122420 · Cited by 11
Extreme winter environment dominates gut microbiota and metabolome of white-lipped deer
Li, B., Liang, C., Xu, B., Song, P., Liu, D., Zhang, J., Gu, H., Jiang, F., Gao, H., Cai, Z., et al. (2025) · Microbiological Research · doi:10.1016/j.micres.2025.128182 · Cited by 11
Fornasaro, S., Esposito, A., Florian, F., Pallavicini, A., Leo, L. D., Not, T., Lagatolla, C., Mezzarobba, M., Silvestre, A. D., Sergo, V., et al. (2022) · Analytical and Bioanalytical Chemistry · doi:10.1007/s00216-022-03975-y · Cited by 13
“Differential abundance analysis [28] was performed by modelling each OTU as a separate generalized linear model (GLM), where it is assumed that abundances follow a negative binomial distribution.”
MethodBester, A., O’Brien, M., Cotter, P. D., Dam, S. A., & Civai, C. (2023) · Foods · doi:10.3390/foods12132480 · Cited by 11
Silva, A. M. M., Feiler, H. P., Lacerda-Júnior, G. V., Fernandes‐Júnior, P. I., Aidar, S. D. T., de Araújo, V. L. V. P., Matteoli, F. P., Pereira, A. P. D. A., de Melo, I. S., & Cardoso, E. J. B. N. (2023) · Brazilian Journal of Microbiology · doi:10.1007/s42770-023-01058-3 · Cited by 11
Vélez, I. G., Ortuño, F. M., Ruiz, I. R., & Herrera, L. J. (2025) · GigaScience · doi:10.1093/gigascience/giaf096 · Cited by 10
“Data are transformed from the simplex into a hyperplane in the Euclidean space, which makes unconstrained statistical methods applicable [ 38 ], thus likely making data more suit-10 able to feature selection methods that implicitly use these techniques.”
Wang, S., Schneider, D., Hartke, T. R., Ballauff, J., Moura, C. C. D. M., Schulz, G., Li, Z., Polle, A., Daniel, R., Gailing, O., et al. (2024) · Frontiers in Ecology and Evolution · doi:10.3389/fevo.2024.1168288 · Cited by 11
Prevalence, pandemic, preventions and policies to overcome antimicrobial resistance
Alotaibi, G. (2024) · Saudi Journal of Biological Sciences · doi:10.1016/j.sjbs.2024.104032 · Cited by 9
Retrospective analysis of antimicrobial resistance associated with bovine respiratory disease
Kos, D., Jelinski, M. D., & Ruzzini, A. C. (2025) · Applied and Environmental Microbiology · doi:10.1128/aem.01909-24 · Cited by 10
“Furthermore, normalization methodology varies across studies, and these choices have strengths, weakness, and variable applicability that can affect interpretation (86).”
Bañares, C., Paterson, S., Gómez‐Garré, D., Ortega‐Hernández, A., Sánchez-González, S., Cueva, C., de la Fuente, M. Á., Hernández‐Ledesma, B., & Gómez‐Cortés, P. (2025) · International Journal of Molecular Sciences · doi:10.3390/ijms26062754 · Cited by 12
Sliti, A., Singh, V., Fentie, E. G., Lim, K., & Shin, J. (2025) · Food Bioscience · doi:10.1016/j.fbio.2025.107171 · Cited by 10
Hu, D., Chao, Y., Zhang, B., Wang, C., Qi, Y., Ente, M., Zhang, D., Li, K., & Mok, K. M. (2021) · PLoS ONE · doi:10.1371/journal.pone.0251512 · Cited by 10
“Random subsampling (rarefying) was applied to check for normality of raw data [51,52].”
MethodAchieving pan-microbiome biological insights via the dbBact knowledge base
Amir, A., Ozel, E., Haberman, Y., & Shental, N. (2023) · Nucleic Acids Research · doi:10.1093/nar/gkad527 · Cited by 10
Takyi, E., Stevick, R. J., Witkop, E. M., Gregg, L. S., Chesler-Poole, A. B., Small, J. M., White, M. M., Hudson, R., Giray, C., Rowley, D. C., et al. (2024) · Aquaculture · doi:10.1016/j.aquaculture.2024.740624 · Cited by 10
Multi-omic analysis along the gut-brain axis points to a functional architecture of autismPreprint
Morton, J. T., Jin, D.-M., Mills, R. H., Shao, Y., Rahman, G., McDonald, D. T., Berding, K., Needham, B. D., Zurita, M. F., David, M. M., et al. (2022) · bioRxiv (Cold Spring Harbor Laboratory) · doi:10.1101/2022.02.25.482050 · Cited by 9
Hu, D., Wang, C., Ente, M., Zhang, K., Zhang, D., Li, X., Li, K., & Chu, H. (2022) · Animals · doi:10.3390/ani12202874 · Cited by 9
“The raw data have been checked for normality based on random subsampling (rarefying) [38,39].”
MethodMetagenomics approaches for studying the human microbiome
Eskeziyaw, B. M., & Mengistu, D. Y. (2024) · All Life · doi:10.1080/26895293.2024.2350166 · Cited by 9
Sohn, H., & Song, Y. (2024) · Urban Ecosystems · doi:10.1007/s11252-024-01557-7 · Cited by 10
Microbial signatures of neonatal bacterial meningitis from multiple body sites
Hou, Y., Zhang, M., Jiang, Q., Yuping, Y., Liu, J., Yuan, K., Sun, Z., & Liu, X. (2023) · Frontiers in Cellular and Infection Microbiology · doi:10.3389/fcimb.2023.1169101 · Cited by 8
“In addition, there are currently many useful tools for eliminating contamination introduced in the wet lab using negative and positive controls (Gloor et al., 2017; Morton et al., 2019; Lin and Peddada, 2020; Austin et al., 2023).”
BackgroundThe impact of antibiotics on the gut microbiota of children recovering from watery diarrhoea
Le, S.-N. H., Minh, C. N. N., de Sessions, P. F., Jie, S., Hong, C. T. T., Thwaites, G. E., Baker, S. G., Thanh, D. P., & The, H. C. (2024) · npj Antimicrobials and Resistance · doi:10.1038/s44259-024-00030-x · Cited by 8
Hajihosseini, M., Amini, P., Saidi‐Mehrabad, A., & Dinu, I. A. (2023) · Computational and Structural Biotechnology Journal · doi:10.1016/j.csbj.2023.02.027 · Cited by 8
“Other methods in the literature, such as glmFit [52], designed to analyze microbiome count data by considering taxon one by one, have heavily depended on the utilization of normalization methods using the negative binomial distribution [76].”
MethodMultiscale adaptive differential abundance analysis in microbial compositional data
Wang, S. (2023) · Bioinformatics · doi:10.1093/bioinformatics/btad178 · Cited by 9
“See a comprehensive review of differential abundance analysis in Weiss et al. (2017) or Lin and Peddada (2020b).”
MethodSweeney, C. J., Kaushik, R., & Bottoms, M. J. (2023) · Integrated Environmental Assessment and Management · doi:10.1002/ieam.4812 · Cited by 10
“…(Roswell et al., 2021), results in the discarding of true, bio - logical information (Gloor et al., 2017), that the selection of minimum data set size can be somewhat arbitrary (Lin & Peddada, 2020), and the process may in fl ate error rates during statistical analysis (McMurdie & Holmes, 2014).”
BackgroundRocha, C. M., Kawamoto, D., Martins, F. H., Bueno, M. R., Ishikawa, K. H., Ando‐Suguimoto, E. S., Carlucci, A. R., Arroteia, L. S., Casarin, R. C. V., Saraiva, L. M., et al. (2024) · International Journal of Molecular Sciences · doi:10.3390/ijms25158090 · Cited by 8
“The discrepancies in abundances of ASVs among groups were analyzed using ANCOM [102] with a 75% empirical cutoff value for the w statistic [103].”
MethodKilonzo‐Nthenge, A., Rafiqullah, I., Netherland, M., Nzomo, M., Mafiz, A. I., Nahashon, S. N., & Hasan, N. A. (2024) · Frontiers in Microbiology · doi:10.3389/fmicb.2024.1443292 · Cited by 9
Association Between Healthy Eating Index-2020 and Oral Microbiome Among Postmenopausal Women
Yue, Y., Hovey, K. M., Wactawski‐Wende, J., LaMonte, M. J., Andrews, C., Diaz, P. I., McSkimming, D. I., Buck, M. J., Sun, Y., & Millen, A. E. (2024) · Journal of Nutrition · doi:10.1016/j.tjnut.2024.08.023 · Cited by 10
Comparative metagenomic analysis of the oral microbiome in COVID-19 patients and healthy individuals
Bhanu, P., Buchke, S., Hemandhar-Kumar, N., Varsha, P., Kiran, S. K. R., Vikneswaran, G., Alva, A., Basavaraj, G. S., & Kumar, J. (2025) · Scientific Reports · doi:10.1038/s41598-024-81864-3 · Cited by 8
“To adjust for potential confounding factors such as age, gender, and tobacco use, we utilized multivariable regression models in the differential abundance analysis, thereby enhancing the accuracy of the observed microbial differences between COVID-19 and non-COVID groups 58 .”
Accommodating multiple potential normalizations in microbiome associations studies
Song, H., Ling, W., Zhao, N., Plantinga, A., Broedlow, C. A., Klatt, N. R., Hensley‐McBain, T., & Wu, M. C. (2023) · BMC Bioinformatics · doi:10.1186/s12859-023-05147-w · Cited by 6
“Common approaches to normalization include scaling the observations to have a unit sum (such that the norm of the abundances for each sample is equal to 1—the original definition of normalization), and scaling by other measures of central tendency, among others (see [27]).”
BackgroundFerreira, S. C. M., Jarquín‐Díaz, V. H., & Heitlinger, E. G. (2023) · Parasites & Vectors · doi:10.1186/s13071-023-05800-6 · Cited by 8
Sorbie, A., Jiménez, R. D., & Benakis, C. (2022) · iScience · doi:10.1016/j.isci.2022.103998 · Cited by 7
Yan, Y., Zhang, X., Liu, Y., Hou, L., Geng, Z., Hu, F., & Xu, C. (2024) · Agronomy · doi:10.3390/agronomy14122917 · Cited by 7
“Linear Discriminant Analysis Effect Size (LEfSe) analysis is a method for discovering and interpreting high-dimensional biomarkers, aiding in the identification of microbial taxa with notable differences across various samples or treatments [24].”
Chen, J., Liu, X., Bai, Y., Tang, X., Xue, K., Zhu, Z., Liu, W., Wang, J., Wang, C., Qiao, H., et al. (2025) · British Journal of Dermatology · doi:10.1093/bjd/ljaf134 · Cited by 7
Bao, Z., Chen, Y., Ou, Y., Yuan, L., Zuo, J., Ng, S. T., Xu, N., & Gong, P. (2026) · Process Safety and Environmental Protection · doi:10.1016/j.psep.2026.108469 · Cited by 8
Salmon, O., Rasmussen, K. L., Aurelius, S., Vanzin, G., Munakata‐Marr, J., & Fujita, Y. (2022) · ACS ES&T Water · doi:10.1021/acsestwater.2c00098 · Cited by 7
Lugones‐Sánchez, C., Santos‐Mínguez, S., Salvado, R., González‐Sánchez, S., Tamayo‐Morales, O., Hoya-González, A., Ramírez‐Manent, J. I., Magallón-Botaya, R. M., Quesada, J. A., Garcia-Cubillas, M. D., et al. (2023) · Frontiers in Public Health · doi:10.3389/fpubh.2023.1164453 · Cited by 7
HighDimMixedModels.jl: Robust high-dimensional mixed-effects models across omics data
Gorstein, E., Aghdam, R., & Solís‐Lemus, C. (2025) · PLoS Computational Biology · doi:10.1371/journal.pcbi.1012143 · Cited by 7
Detection of biofilm and planktonic microbial communities in litter/soil mixtures
Němcová, L., Bystrianský, L., Hujslová, M., Malinská, H. A., Hršelová, H., & Gryndler, M. (2022) · Applied Soil Ecology · doi:10.1016/j.apsoil.2022.104589 · Cited by 7
Wan, Y., Ma, R., Zhang, H., Li, L., Chai, L., Qi, R., Liu, W., Li, J., Li, Y., & Zhan, K. (2021) · Frontiers in Veterinary Science · doi:10.3389/fvets.2021.728538 · Cited by 7
“To remove the sampling depth heterogeneity, rarefaction was performed to standardize the data obtained from samples with different sequencing efforts, and to compare the OTU richness of the samples using these standardized data (24).”
MethodBars‐Cortina, D. (2022) · bioRxiv (Cold Spring Harbor Laboratory) · doi:10.1101/2022.11.07.512066 · Cited by 7
“Other methods, such as Wrench and the ANCOM-BC [33] attempt to provide additional scaling for data compositionality and sparsity [18].”
BackgroundMethodInfluentialGamboa-Tuz, S. D., Ramos, M., Franzosa, E. A., Huttenhower, C., Segata, N., Oh, S., & Waldron, L. (2025) · bioRxiv (Cold Spring Harbor Laboratory) · doi:10.1101/2025.02.13.638109 · Cited by 6
“Five compositional data methods (Compositional): Wilcox + CLR, LEfSe + CLR, ZINQ + CLR (Ling et al. , 2021), ALDEx2(Fernandes et al. , 2013, 2014), and ANCOM-BC(Mandal et al. , 2015; Lin and Peddada, 2020a).”
The Use of Confidence Intervals in Differential Abundance Analysis of Microbiome Data
Vinogradova, E. B., Kushugulova, A. R., Kozhakhmetov, S., & Baltin, M. E. (2026) · Applied Microbiology · doi:10.3390/applmicrobiol6010007 · Cited by 6
“Microbial data present a unique analytical challenge [2–8].”
InfluentialKodalci, L., & Thas, O. (2023) · PLoS ONE · doi:10.1371/journal.pone.0292055 · Cited by 6
Bacterial microbiome and host inflammatory gene expression in foreskin tissue
Maust, B. S., Petkov, S., Herrera, C., Feng, C., Brown, B. P., Lebina, L., Opoka, D., Ssemata, A. S., Pillay, N., Serwanga, J., et al. (2023) · Heliyon · doi:10.1016/j.heliyon.2023.e22145 · Cited by 6
“…ANCOM-BC 1.6.2 [42], and DESeq2 1.36.0 [43] (using the poscounts factors estimation) were used for differential abundance testing to overcome the documented limited power and accuracy of these tools when used individually on 16S data sets which contain a high proportion of zero counts [44,45].”
MethodInfluentialLi‐Gao, R., Grubbs, K. J., Bertoni, A. G., Hoffman, K. L., Petrosino, J. F., Ramesh, G., Wu, M., Rotter, J. I., Chen, Y.-D. I., Evans, A. M., et al. (2022) · Metabolites · doi:10.3390/metabo12090787 · Cited by 8
“Because the relative abundances for many of the individual bacterial species showed an excess of zeros [28], we refined our dataset to contain species with at least 30% non-zero values.”
Grand challenges in arachnid microbiota and diseases
Cabezas‐Cruz, A. (2023) · Frontiers in Arachnid Science · doi:10.3389/frchs.2023.1215831 · Cited by 6
“To eliminate any bias owing to differences in the sampling fractions, it is critical to normalize the data (Lin and Peddada, 2020) using rarefying(Hughes and Hellmann, 2005), scaling- (Lin and Peddada, 2020), or log-ratio-based methods (Lin and Peddada, 2020).”
BackgroundMethodInfluentialComing Up for Air: The Role of Anaerobes in Cystic Fibrosis
Thornton, C. S., Caverly, L. J., & LiPuma, J. J. (2021) · Annals of the American Thoracic Society · doi:10.1513/annalsats.202110-1142ps · Cited by 6
Primary nasal viral infection rewires the tissue-scale memory responsePreprint
Kazer, S. W., Matysiak, C., Langan, E. M., Messou, M.-A., LaSalle, T. J., O’Leary, E., Marbourg, J. M., Naughton, K. A., von Andrian, U. H., & Ordovás-Montañés, J. (2023) · bioRxiv (Cold Spring Harbor Laboratory) · doi:10.1101/2023.05.11.539887 · Cited by 6
Tourlousse, D. M., & Sekiguchi, Y. (2025) · ISME Communications · doi:10.1093/ismeco/ycaf028 · Cited by 5
“Since differential abundance analyses in microbiome research primarilyfocusoncomparingabsoluteabundancesbetweensam-ples [44], we also calculated the differences in ALR-transformed counts between all pairs of samples, and compared them to the values theoretically expected by design.”
Li, W., Zhu, Z., Fang, X., Wang, X., Chu, W., Gong, H., & Yan, M. (2025) · Food Microbiology · doi:10.1016/j.fm.2025.104757 · Cited by 12
Darawshy, F., Tsay, J.-C. J., Segal, L. N., & Pass, H. I. (2025) · Cancer Biomarkers · doi:10.1177/18758592251322045 · Cited by 5
“85 However, quantitative approaches are the most commonly used for biomarkers and how to transition to such approaches when there are a large number of potential targets identi fi ed is still not very clear and needs further investigations.”
Rubel, V., Filker, S., Lanzén, A., Abad‐Recio, I. L., & Stoeck, T. (2025) · Marine Pollution Bulletin · doi:10.1016/j.marpolbul.2025.118173 · Cited by 5
Jahromi, L. P., Kronast, B., Munkert, J., Sana, L., Koch, M., Danzer, H., Dormeyer, S., Jiang, S., Herrmann, F. C., Weiler, M., et al. (2025) · Small · doi:10.1002/smll.202502551 · Cited by 5
Lee, J., Kim, D. H., Choi, J.-W., Shong, M., & Lee, C. K. (2025) · Journal of Inflammation Research · doi:10.2147/jir.s546260 · Cited by 6
Tran, L., Deckers, T. B., Ho, J., Lansing, L., Cunningham, M., Morfín, N., Pepinelli, M., la Mora, Á. D., Conflitti, I. M., Gregoris, A. S., et al. (2025) · Scientific Reports · doi:10.1038/s41598-025-30907-4 · Cited by 5
Adesemoye, A. O., Kodati, S., Watts, D. B., & Maharjan, B. (2023) · Applied Soil Ecology · doi:10.1016/j.apsoil.2023.105093 · Cited by 5
Ahammad, I., Bhattacharjee, A., Chowdhury, Z. M., Rahman, A., Hossain, M. U., Dewan, G., Talukder, S., Das, K. C., Keya, C. A., & Salimullah, M. (2024) · Communications Biology · doi:10.1038/s42003-024-06191-9 · Cited by 5
“The minimum sample size for each feature was set to 27 (half of the total samples) because ANCOM fails to manage false discovery rates at sample sizes 10 as well as to remove very lowly abundant features 37 .”
Kimeklis, A. K., Gladkov, G. V., Tembotov, R. K., Kichko, A. A., Pinaev, A., Hosid, S., Andronov, E. E., & Abakumov, E. V. (2022) · One Ecosystem · doi:10.3897/oneeco.7.e83756 · Cited by 5
Li, X., Omolehin, O., Hemmings, G., Tseng, H. T., Taylor, A. M., Taylor, C., Kong, P., Daughtrey, M., Luster, D. G., Gouker, F. E., et al. (2023) · BMC Microbiology · doi:10.1186/s12866-023-02956-0 · Cited by 5
“Analysis of Compositional of Microbiomes with Bias Correction (ANCOM-BC, version 2.0.2) [62] was used with the ancombc2 function to identify differentially abundant bacterial and fungal genera as a function of anti-desiccant for each of the two cultivars and three sampling months.”
MethodInfluentialSun, Z., & Song, K. (2024) · Journal of Molecular Biology · doi:10.1016/j.jmb.2024.168841 · Cited by 4
Vanzin, A., Giannuzzi, D., Zardinoni, G., Cecchinato, A., Correddu, F., Macciotta, N. P. P., Atzori, A. S., Carta, S., Ledda, A., Schiavon, S., et al. (2025) · Journal of Dairy Science · doi:10.3168/jds.2024-26172 · Cited by 4
Shin, J., Jin, D. Y., Seo, S., Yu, H.-Y., Kim, S., Lee, S., Shin, E., & Kim, J. (2025) · Journal of Microbiology and Biotechnology · doi:10.4014/jmb.2506.06016 · Cited by 4
“Differentially abundant features across sample groups were identified using Analysis of Compositions of Microbiomes with Bias Correction (ANCOM-BC) [23].”
Fenibo, E. O., Nkuna, R., & Matambo, T. S. (2025) · Bioinformatics and Biology Insights · doi:10.1177/11779322251371117 · Cited by 4
“For differential abundance analysis (DAA), we used the ALDEx2 package (Swift et al, 35 Lin and Peddada, 36 ).”
Aries, M. L., Gasvoda, H., Michelotti, M., Rodriguez-Caro, F., Gooman, A., Perez, A., & Hensley‐McBain, T. (2025) · mSphere · doi:10.1128/msphere.00429-25 · Cited by 4
“To investigate microbiome differences between genotypes, LEfSe was used to indicate bacterial species that drive the differences in genotype composition by coupling statistical significance tests ( P < 0.05 and fold change >2) with biological consistency (26, 27).”
InfluentialZhang, J., Wang, X., Wang, D., Zheng, Z., Wang, H., & La, M. (2026) · mSystems · doi:10.1128/msystems.00800-25 · Cited by 5
“However, their linear assumptions inadequately capture complex taxa interaction patterns (150, 151).”
Soil biota sensitivity to hydroclimate variability in a polar desert ecosystem
Snyder, M. D., Adams, B. J., Borgmeier, A., Jorna, J., Power, S. N., Salvatore, M. R., & Barrett, J. (2025) · Arctic Antarctic and Alpine Research · doi:10.1080/15230430.2025.2485283 · Cited by 4
“We note that this is an LDA, and results should not be interpreted as a differential abundance analysis (Lin and Peddada 2020).”
Tagele, S. B., & Gachomo, E. W. (2024) · Scientific Reports · doi:10.1038/s41598-024-59587-2 · Cited by 4
Cheong, S., Siliezar, K. A., Williams, S. R., Gaudin, A. C. M., Pagliari, P. H., Jay‐Russell, M. T., Busch, R. C., Maga, E. A., & Pires, A. F. A. (2025) · PLoS ONE · doi:10.1371/journal.pone.0316616 · Cited by 3
Kwon, J., Tanner, W. D., Kong, Y., Wade, M., Bitler, C. A., Chiavegato, M. B., & Pettigrew, M. M. (2025) · mSphere · doi:10.1128/msphere.00738-24 · Cited by 8
“ANCOM-BC analysis (35) was used to evaluate whether there were differences in the relative abundance of ARGs by type at pre-weaning (S1) and pre-harvest (S5).”
Li, X., Ding, K., Ma, Y., Han, X., Liu, Y., Wu, G., & Chen, D. (2025) · Diabetes Research and Clinical Practice · doi:10.1016/j.diabres.2025.112438 · Cited by 3
Oral microbiome profiling of primary oral candidiasis during infection and post-antifungal therapy
Azizan, N., Al‐Maleki, A. R., Karajacob, A. S., Loke, M. F., Goh, J. P. E., Kallarakkal, T. G., Ho, G. F., Khor, H. M., Ong, H. C., & Tay, S. T. (2026) · Clinical Oral Investigations · doi:10.1007/s00784-026-06827-6 · Cited by 5
“The relative abundance of bacterial phyla and genera in each group was calculated by using the CLC-Microbial Genomics Module by dividing the number of OTUs assigned to each taxon by the total number of OTUs within the respective group [42 ].”
Power and sample-size estimation in human microbiome research
Zhou, Q., Lu, Y., Wang, L., Zhou, W., Oba, H., Zhou, Y., Shen, M., Qu, X., Souza, C. D., Rayner, A., et al. (2026) · Med · doi:10.1016/j.medj.2026.101174 · Cited by 4
What Can We Learn about the Bias of Microbiome Studies from Analyzing Data from Mock Communities?
Li, M., Tyx, R. E., Rivera, A. J., Zhao, N., & Satten, G. A. (2022) · Genes · doi:10.3390/genes13101758 · Cited by 3
“There is no universally accepted method to normalize high-throughput microbiome data to achieve bias reduction [7,8].”
Methodrox: A Statistical Model for Regression with Missing Values
Büyüközkan, M., Benedetti, E., & Krumsiek, J. (2023) · Metabolites · doi:10.3390/metabo13010127 · Cited by 3
Tagele, S. B., & Gachomo, E. W. (2024) · Phytobiomes Journal · doi:10.1094/pbiomes-12-23-0135-r · Cited by 3
Herath-Mudiyanselage, H., Ali, A., Mahmoud, M. E., Farooq, M., Isham, I. M., Ghaffar, A., Jovel, J., Gomis, S. M., Niu, Y. D., & Abdul-Careem, M. F. (2025) · Virology · doi:10.1016/j.virol.2025.110428 · Cited by 3
Potisap, C., Lawongsa, P., Duangsri, J., Gontijo, J. B., Wongratanacheewin, S., Rodrigues, J. L. M., & Sermswan, R. W. (2025) · Microbiology Spectrum · doi:10.1128/spectrum.02963-24 · Cited by 3
Rudar, J., Golding, G. B., Kremer, S. C., & Hajibabaei, M. (2023) · Microbiology Spectrum · doi:10.1128/spectrum.02065-22 · Cited by 4
“Training and testing libraries were then rare fi ed so that each library was this size and those smaller than the 15th percentile were removed (7).”
BackgroundControlling taxa abundance improves metatranscriptomics differential analysis
Ji, Z., & Ma, L. (2023) · BMC Microbiology · doi:10.1186/s12866-023-02799-9 · Cited by 3
“While significant progress has been made to develop methods for differential compositional analysis [5], methods to identify differentially expressed (DE) gene pathways for metatranscriptomics data are still underdeveloped.”
BackgroundKoepper, S., Clark, K. F., McClure, J. T., Revie, C. W., Stryhn, H., & Thakur, K. K. (2024) · Frontiers in Microbiology · doi:10.3389/fmicb.2024.1320812 · Cited by 3
Browning, B. D., Kirkland, A. E., Green, R., Liu, H., Glover, J. S., Ticer, T. D., Engevik, M. A., Alekseyenko, A. V., Ferguson, P. L., Tomko, R. L., et al. (2024) · Alcoholism Clinical and Experimental Research · doi:10.1111/acer.15331 · Cited by 3
Manoharan-Basil, S. S., Gestels, Z., Abdellati, S., Baetselier, I. D., Vanbaelen, T., Hinterwirth, A. J., Doan, T. A., Lietman, T. M., & Kenyon, C. R. (2024) · International Journal of Infectious Diseases · doi:10.1016/j.ijid.2024.107082 · Cited by 3
Sermsaksasithorn, P., Asawanonda, P., Phutrakool, P., Ondee, T., Chariyavilaskul, P., Payungporn, S., Pongpirul, K., & Hirankarn, N. (2024) · Medical Cannabis and Cannabinoids · doi:10.1159/000539492 · Cited by 4
“Upon the occurrence of an adverse event, the patient would receive treat-ment for the adverse event at King Chulalongkorn Memorial Hospital for free.”
BackgroundMa, Z. S. (2024) · Computers in Biology and Medicine · doi:10.1016/j.compbiomed.2024.108852 · Cited by 3
Lipowska, M. M., Sadowska, E. T., Kohl, K. D., & Koteja, P. (2024) · Ecological and Evolutionary Physiology · doi:10.1086/732781 · Cited by 3
“The analyses were performed for relative abundances with adonis2 function, and for the bias-corrected “absolute” abundances, in which log fold-changes of the abundances are analyzed ( ancombc2 function in R package ANCOMBC, v. 2.4.0; (Lin and Peddada 2020a, 2020b)).”
InfluentialGuzman, J. P. M. D., Mwamburi, S. M., Konishi, K., Aoki, M., Kuwahara, H., Mikata, K., Koiwai, K., Kondo, H., & Hırono, I. (2024) · Aquaculture · doi:10.1016/j.aquaculture.2024.742092 · Cited by 3
Jarrige, D., Tardy, V., Loux, V., Rué, O., Chabbi, A., Terrat, S., & Maron, P. (2025) · Scientific Reports · doi:10.1038/s41598-025-98903-2 · Cited by 3
“Common limitations of this approach evoked in the literature are a loss of valid information and an introduction of an additional sampling bias 57 .”
Wenner, B. A., Tase, D., Park, T., St-Pierre, N. R., de Souza, J., & Batistel, F. (2025) · Journal of Dairy Science · doi:10.3168/jds.2024-25779 · Cited by 3
A Novel Slope-Matrix-Graph Algorithm to Analyze Compositional Microbiome Data
Zhang, M., Li, X., Oladeinde, A., Rothrock, M. J., Pokoo-Aikins, A., & Zock, G. (2024) · Microorganisms · doi:10.3390/microorganisms12091866 · Cited by 2
“For example, the term “observed abundance” can be confusing, making data analyses challenging for researchers without a background in statistics [9].”
Gut Mucosal Microbiome of Patients With Low-Grade Adenomatous Bowel Polyps
Welham, Z., Li, J., Tse, B. C. Y., Engel, A. F., & Molloy, M. P. (2025) · Gastro Hep Advances · doi:10.1016/j.gastha.2025.100687 · Cited by 2
Development of multiple microbiome biomarkers using penalized regression methods
Nguyen, T. H., Hamad, I., Kleinewietfeld, M., Amaratunga, D., Cabrera, J., Sargsyan, D., Sengupta, R., Owokotomo, O. E., Katehakis, M. N., & Shkedy, Z. (2025) · Journal of Applied Microbiology · doi:10.1093/jambio/lxaf242 · Cited by 2
Koh, J. C. O. (2026) · Environmental DNA · doi:10.1002/edn3.70232 · Cited by 2
Decoding the microbiome-disease axis with interpretable graph neural networks
Ivanov, V. A., Hartman, W. H., & Soheilypour, M. (2026) · Journal of Applied Microbiology · doi:10.1093/jambio/lxag063 · Cited by 2
Applications and advances of deep learning in food microbiology: From data to intelligent analysis
Li, C.-L., Wang, X., Liu, H., & Zhu, D.-S. (2026) · Trends in Food Science & Technology · doi:10.1016/j.tifs.2026.105687 · Cited by 2
Jangir, Y., Guo, Y., Connon, S. A., Pontrelli, S., Wu, F., Schwartzman, J. A., Lim, S., Sauer, U., Cordero, O. X., & Orphan, V. J. (2026) · The ISME Journal · doi:10.1093/ismejo/wrag151 · Cited by 2
“Differential abundance analysis was conducted using ANCOM-BC [ 72] to evaluate changes in microbial abundance across different phases of the electrochemical reactor (electrode-attached, planktonic, and chitin-attached).”
Multi-omic modelling of body mass index response to a dietary weight loss intervention
Yeo, E. N., Scadden, A. W., Caterer, Z., Sutton, K. J., Konigsberg, I. R., Cole, J. B., LITKOWSKI, E. M., Pan, Z., Lozupone, C., Ostendorf, D. M., et al. (2026) · Gut Microbes · doi:10.1080/19490976.2026.2696645 · Cited by 2
A flexible quasi‐likelihood model for microbiome abundance count data
Shi, Y., Li, H., Wang, C., Chen, J., Jiang, H., Shih, Y. T., Zhang, H., Song, Y., Feng, Y., & Liu, L. (2023) · Statistics in Medicine · doi:10.1002/sim.9880 · Cited by 2
Metadata
- Authors
- Lin, H., & Peddada, S. D.
- Affiliations
- National Institutes of Health (US)
- Corresponding author
- Peddada, Shyamal Das
- Venue
- npj Biofilms and Microbiomes
- Published
- 2020-12-02
- Volume
- 6
- Issue
- 1
- Pages
- 60-60
- ISSN
- 2055-5008 (ISSN-L)
- PMC
- PMC7710733
- OpenAlex
- W3109541743
- Cited by
- 341
- References
- 68
- Citations by year
- 2026: 57 · 2025: 73 · 2024: 67 · 2023: 77 · 2022: 55 · 2021: 11
- FWCI
- 3.45
- Type
- journal article
- Language
- en
- Open access
- gold
- doi.org
- Locations
- npj Biofilms and Microbiomes (publishedVersion, cc-by)
- PubMed Central (publishedVersion, cc-by)
- PubMed (publishedVersion)
- Funders
- University of Pittsburgh
- Topics
- Life Sciences › Biochemistry, Genetics and Molecular Biology › Molecular Biology › Gut microbiota and health
- Physical Sciences › Environmental Science › Ecology › Microbial Community Ecology and Physiology
- Life Sciences › Biochemistry, Genetics and Molecular Biology › Molecular Biology › Genomics and Phylogenetic Studies
- Keywords
- microbiome, differential abundance, compositional data, normalization, zero-inflated data, OTU table, sequencing read counts, human microbiome
- MeSH terms
- Gastrointestinal Microbiome, Bacteria, Humans, Models, Theoretical, Mouth, Phylogeny
About these checks
Registry, retraction, Cites and statistics results are computed, not judged, with one exception: a printed reference that no index lists is read once by a model before it counts as a citation error. Claims are extracted by a model and kept only when their quote appears verbatim in the text; each cited source is then checked, with a model’s help, for whether it says what the claim relies on. Those verdicts can be wrong — read the claim’s quote and the cited source before relying on one.
Statistics and arithmetic are recomputed, not judged.
Confidence bands are shown only for fields calibrated on our annotated test set. None is calibrated yet, so no band is shown.
What counts as a claim ›How we measure confidence ›How we check this ›
Are you an author, or do you see a problem with this page? Request a review
