Cited by 226

The DOI matches its Crossref record; 2 of the 2 references it cites were found in a registry or an index.

Cancer risk across mammals

Vincze, Orsolya, Colchero, Fernando, Lemaître, Jean-Francois, Conde, Dalia A., Pavard, Samuel, Bieuville, Margaux, Urrutia, Araxi O., Ujvari, Beata, Boddy, Amy M., Maley, Carlo C., Thomas, Frédéric, Giraudeau, Mathieu·2022·Nature

Abstract

Cancer is a ubiquitous disease of metazoans, predicted to disproportionately affect larger, long-lived organisms owing to their greater number of cell divisions, and thus increased probability of somatic mutations 1,2 . While elevated cancer risk with larger body size and/or longevity has been documented within species 3–5 , Peto’s paradox indicates the apparent lack of such an association among taxa 6 . Yet, unequivocal empirical evidence for Peto’s paradox is lacking, stemming from the difficulty of estimating cancer risk in non-model species. Here we build and analyse a database on cancer-related mortality using data on adult zoo mammals (110,148 individuals, 191 species) and map age-controlled cancer mortality to the mammalian tree of life. We demonstrate the universality and high frequency of oncogenic phenomena in mammals and reveal substantial differences in cancer mortality across major mammalian orders. We show that the phylogenetic distribution of cancer mortality is associated with diet, with carnivorous mammals (especially mammal-consuming ones) facing the highest cancer-related mortality. Moreover, we provide unequivocal evidence for the body size and longevity components of Peto’s paradox by showing that cancer mortality risk is largely independent of both body mass and adult life expectancy across species. These results highlight the key role of life-history evolution in shaping cancer resistance and provide major advancements in the quest for natural anticancer defences.

Overview

The claims and statistics of this paper haven’t been checked yet.

Run the check — free, no account needed. It reads the open-access text and checks the sources it cites.

A few free checks a day · papers already verified open instantly · results are public

Integrity signals

Registry

Crossref · 10.1038/s41586-021-04224-5

Cites

2 of 2 references verified0 citation errors · 0 not checkable

Statistics

Figures

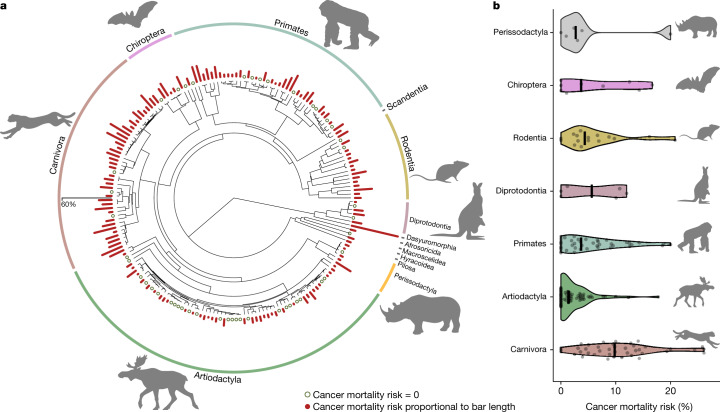
Fig. 1 Distribution of cancer mortality risk across the mammalian phylogeny. a, CMR in various mammals (scale to bar plots is provided on the left of the graph). b, Violin plots indicating order differences in CMR in orders with a minimum of two species represented. Solid black lines represent order medians. Animal silhouettes used to visually represent mammalian orders were downloaded from PhyloPic (http://www.phylopic.org).
Fig. 1 Distribution of cancer mortality risk across the mammalian phylogeny. a, CMR in various mammals (scale to bar plots is provided on the left of the graph). b, Violin plots indicating order differences in CMR in orders with a minimum of two species represented. Solid black lines represent order medians. Animal silhouettes used to visually represent mammalian orders were downloaded from PhyloPic (http://www.phylopic.org).CC BY · PubMed Central
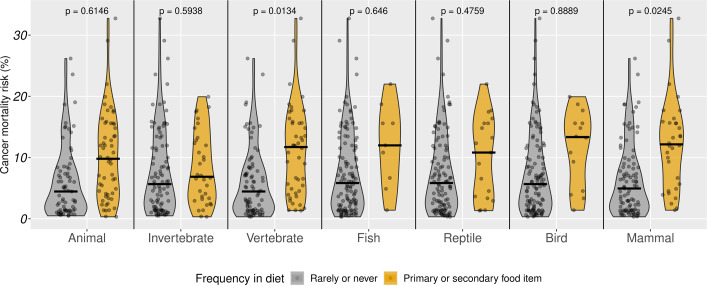
Fig. 2 Cancer mortality risk in mammals as a function of animal content in diet. Violin plots show CMR as a function of seven diet items, each coded as rarely/never occurring in the diet or representing the primary/secondary food item of the species. Medians are marked with solid black lines. P values indicate pairwise differences as indicated by models presented in Extended Data Table 2 that also control for body mass, life expectancy and phylogeny.
Fig. 2 Cancer mortality risk in mammals as a function of animal content in diet. Violin plots show CMR as a function of seven diet items, each coded as rarely/never occurring in the diet or representing the primary/secondary food item of the species. Medians are marked with solid black lines. P values indicate pairwise differences as indicated by models presented in Extended Data Table 2 that also control for body mass, life expectancy and phylogeny.CC BY · PubMed Central
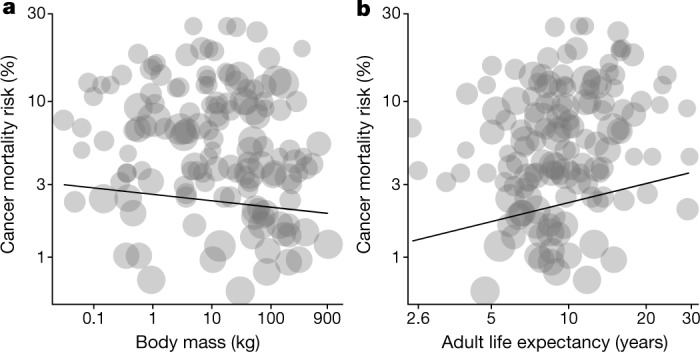
Fig. 3 Association between cancer mortality risk and body mass or adult life expectancy across mammals. a, b, Non-zero CMR plotted against body mass (a) or adult life expectancies (b). Slopes were obtained from the PGLS model presented in Extended Data Table 3a. Points are proportional to the log number of individuals with available postmortem pathological records.
Fig. 3 Association between cancer mortality risk and body mass or adult life expectancy across mammals. a, b, Non-zero CMR plotted against body mass (a) or adult life expectancies (b). Slopes were obtained from the PGLS model presented in Extended Data Table 3a. Points are proportional to the log number of individuals with available postmortem pathological records.CC BY · PubMed Central
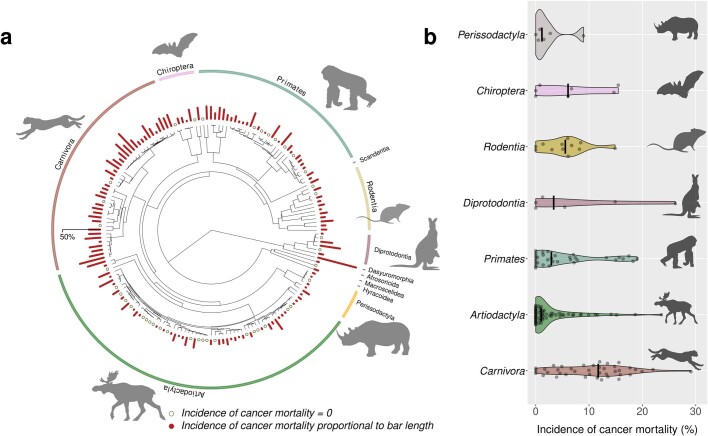
Extended Data Fig. 1 Phylogenetic distribution and order differences of ICM. a, Phylogenetic distribution of ICM (%). b, Violin plots indicating order differences in ICM (%) in orders with minimum two species assessed. Solid black lines indicate order medians. Animal silhouettes used to visually represent mammalian orders were downloaded from PhyloPic (http://www.phylopic.org).
Extended Data Fig. 1 Phylogenetic distribution and order differences of ICM. a, Phylogenetic distribution of ICM (%). b, Violin plots indicating order differences in ICM (%) in orders with minimum two species assessed. Solid black lines indicate order medians. Animal silhouettes used to visually represent mammalian orders were downloaded from PhyloPic (http://www.phylopic.org).CC BY · PubMed Central
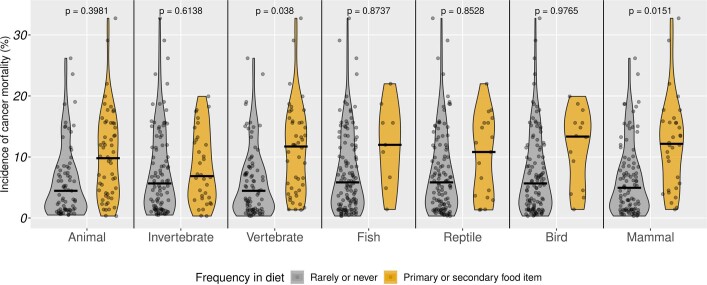
Extended Data Fig. 2 ICM in function of diet animal content. Violin plots indicate ICM in function of diet animal content. Diet is characterized by variables on three taxonomic levels: I. animal content (including any vertebrate or invertebrate prey); II. invertebrate or vertebrate prey; and III. within vertebrates fish, reptile, bird and mammal preys. Each variable is coded as a two-level factor: rarely/never occurring in diet and representing the primary/secondary food item of the species. Plots indicate the range and distribution of cancer risks in each category, where the width of each curve corresponds with the approximate frequency of data points in each region. Medians are marked with solid black lines. P values indicate pairwise differences as indicated by models presented in Extended Data Table 2 that also control for body mass, life expectancy and phylogeny.
Extended Data Fig. 2 ICM in function of diet animal content. Violin plots indicate ICM in function of diet animal content. Diet is characterized by variables on three taxonomic levels: I. animal content (including any vertebrate or invertebrate prey); II. invertebrate or vertebrate prey; and III. within vertebrates fish, reptile, bird and mammal preys. Each variable is coded as a two-level factor: rarely/never occurring in diet and representing the primary/secondary food item of the species. Plots indicate the range and distribution of cancer risks in each category, where the width of each curve corresponds with the approximate frequency of data points in each region. Medians are marked with solid black lines. P values indicate pairwise differences as indicated by models presented in Extended Data Table 2 that also control for body mass, life expectancy and phylogeny.CC BY · PubMed Central
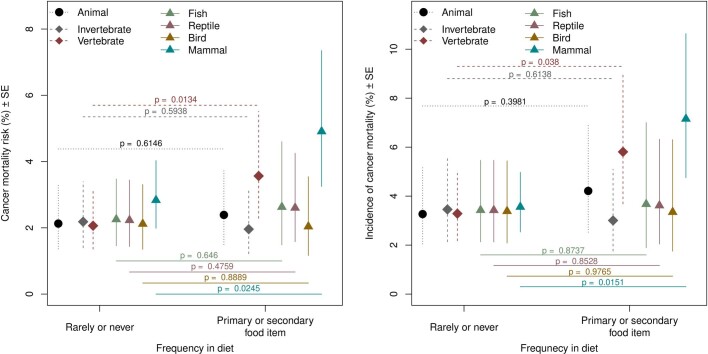
Extended Data Fig. 3 Predicted cancer mortality risk in function of animal content in diet. Values represent estimated marginal means of a, CMR or b, ICM in function of diet animal content, based on models presented in Extended Data Table 2. Diet is characterized by variables on three taxonomic levels: I. animal content (including any vertebrate or invertebrate prey); II. invertebrate or vertebrate prey; and III. within vertebrates fish, reptile, bird and mammal preys. Each variable is coded as a two-level factor: rarely/never occurring in diet and representing the primary/secondary food item of the species. P-values shown were obtained from models presented in Extended Data Table 2.
Extended Data Fig. 3 Predicted cancer mortality risk in function of animal content in diet. Values represent estimated marginal means of a, CMR or b, ICM in function of diet animal content, based on models presented in Extended Data Table 2. Diet is characterized by variables on three taxonomic levels: I. animal content (including any vertebrate or invertebrate prey); II. invertebrate or vertebrate prey; and III. within vertebrates fish, reptile, bird and mammal preys. Each variable is coded as a two-level factor: rarely/never occurring in diet and representing the primary/secondary food item of the species. P-values shown were obtained from models presented in Extended Data Table 2.CC BY · PubMed Central
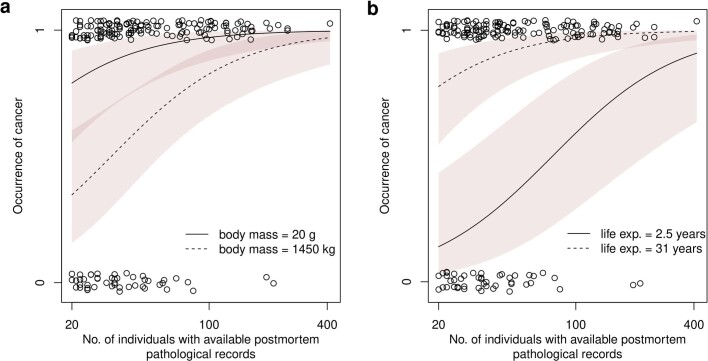
Extended Data Fig. 4 Association between occurrence of non-zero CMR and a, body mass or b, adult life expectancy across species. Occurrence of cancer in each species is plotted in function of the number of deceased individuals for which cause of death was known. Predictions were obtained for two scenarios, one for low and one for high a, body masses and b, adult life expectancies respectively. Random noise was added to cancer occurrence to facilitate the visualization of overlapping points. Predictions and associated 95% confidence intervals were obtained from a binomial GLM without phylogenetic control.
Extended Data Fig. 4 Association between occurrence of non-zero CMR and a, body mass or b, adult life expectancy across species. Occurrence of cancer in each species is plotted in function of the number of deceased individuals for which cause of death was known. Predictions were obtained for two scenarios, one for low and one for high a, body masses and b, adult life expectancies respectively. Random noise was added to cancer occurrence to facilitate the visualization of overlapping points. Predictions and associated 95% confidence intervals were obtained from a binomial GLM without phylogenetic control.CC BY · PubMed Central
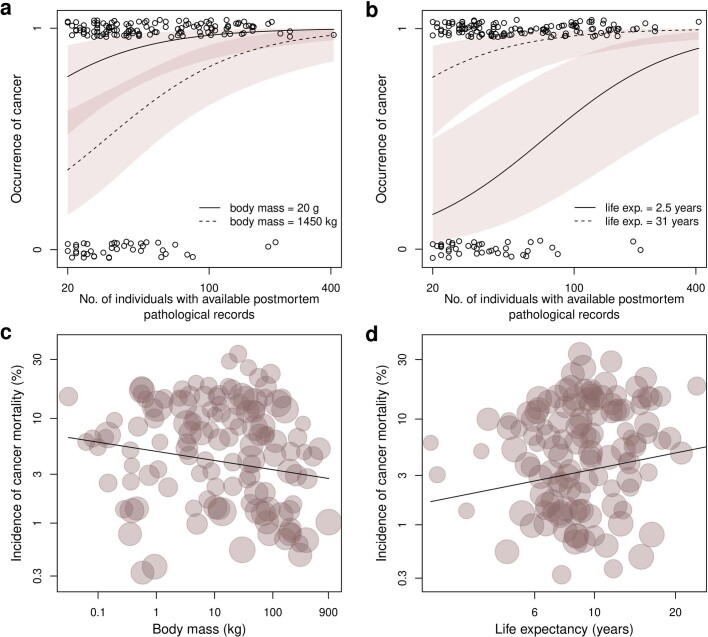
Extended Data Fig. 5 Association between ICM and a,c, body mass or b,d, adult life expectancy. Occurrence of cancer is plotted in function of the number of deceased individuals for which cause of death was known and predictions were obtained for two scenarios, one for low and high a, body masses and b, adult life expectancies respectively. Random noise was added to cancer occurrence to facilitate the visualization of overlapping points. Predictions and associated 95% confidence intervals were obtained from a binomial GLM without phylogenetic control. Non-zero cancer mortality risks were plotted against c, body mass or d, adult life expectancies. Slopes were obtained from the PGLS model presented in Extended Data Table 3b. Points are proportional to the log number of individuals with known cause of death.
Extended Data Fig. 5 Association between ICM and a,c, body mass or b,d, adult life expectancy. Occurrence of cancer is plotted in function of the number of deceased individuals for which cause of death was known and predictions were obtained for two scenarios, one for low and high a, body masses and b, adult life expectancies respectively. Random noise was added to cancer occurrence to facilitate the visualization of overlapping points. Predictions and associated 95% confidence intervals were obtained from a binomial GLM without phylogenetic control. Non-zero cancer mortality risks were plotted against c, body mass or d, adult life expectancies. Slopes were obtained from the PGLS model presented in Extended Data Table 3b. Points are proportional to the log number of individuals with known cause of death.CC BY · PubMed Central
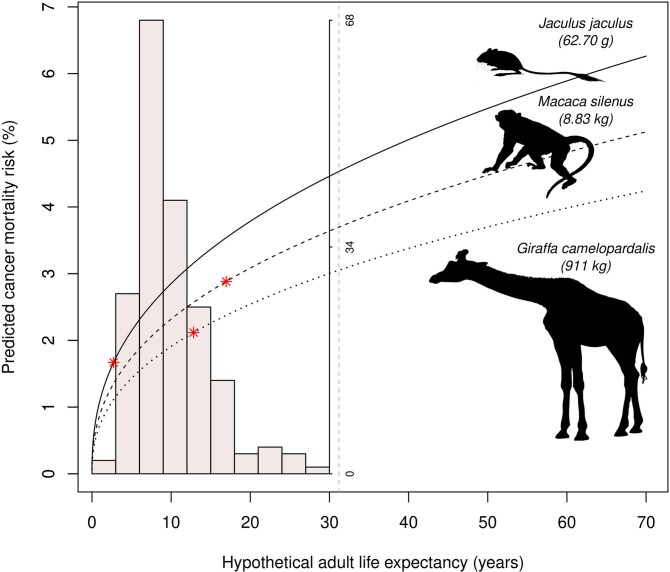
Extended Data Fig. 6 Predicted CMR at various hypothetical life expectancies for small, medium, and large-bodies species. CMR was predicted based on the logistic model presented in Extended Data Table 3a for a series of hypothetical adult life expectancies, ranging from one to 70 years (x-axis). Predictions were obtained for three body masses, corresponding to a small, medium and a large bodied mammal in our dataset. True life expectancies of the three species are marked with red stars. Distribution of life expectancies across the species set of the model is shown by a histogram. Vertical dashed line marks maximum life-expectancy in our dataset. Jaculus jaculus silhouette by Maija Karala. The other animal silhouettes used to visually represent mammalian orders were downloaded from PhyloPic (http://www.phylopic.org).
Extended Data Fig. 6 Predicted CMR at various hypothetical life expectancies for small, medium, and large-bodies species. CMR was predicted based on the logistic model presented in Extended Data Table 3a for a series of hypothetical adult life expectancies, ranging from one to 70 years (x-axis). Predictions were obtained for three body masses, corresponding to a small, medium and a large bodied mammal in our dataset. True life expectancies of the three species are marked with red stars. Distribution of life expectancies across the species set of the model is shown by a histogram. Vertical dashed line marks maximum life-expectancy in our dataset. Jaculus jaculus silhouette by Maija Karala. The other animal silhouettes used to visually represent mammalian orders were downloaded from PhyloPic (http://www.phylopic.org).CC BY · PubMed Central
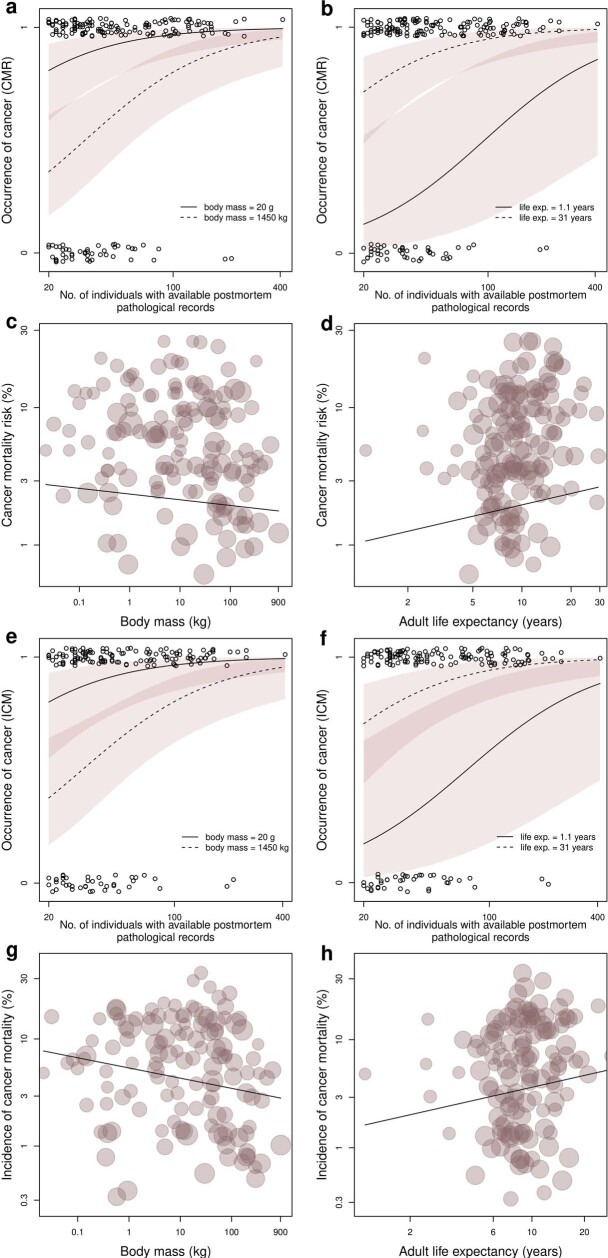
Extended Data Fig. 7 Association between cancer mortality risk and body mass as well as adult life expectancy across 191 mammal species. These analysis include the three species excluded in some models due to their high leverages. Plots show a-d, CMR or e-h, ICM. Occurrence of cancer in each species is plotted in function of the number of individuals with post-mortem pathological records. Predictions were obtained for two scenarios: for small or large a,e, body masses and low or high b,f, adult life expectancies respectively. Random noise was added to cancer occurrence to facilitate the visualization of overlapping points. Predictions and associated 95% confidence intervals were obtained from a binomial GLM without phylogenetic control. Non-zero cancer mortality risks were plotted against c,g, body mass or d,h, adult life expectancies. Slopes were obtained from the PGLS model presented in Supplementary Table 4. Points are proportional to the log number of individuals with known cause of death.
Extended Data Fig. 7 Association between cancer mortality risk and body mass as well as adult life expectancy across 191 mammal species. These analysis include the three species excluded in some models due to their high leverages. Plots show a-d, CMR or e-h, ICM. Occurrence of cancer in each species is plotted in function of the number of individuals with post-mortem pathological records. Predictions were obtained for two scenarios: for small or large a,e, body masses and low or high b,f, adult life expectancies respectively. Random noise was added to cancer occurrence to facilitate the visualization of overlapping points. Predictions and associated 95% confidence intervals were obtained from a binomial GLM without phylogenetic control. Non-zero cancer mortality risks were plotted against c,g, body mass or d,h, adult life expectancies. Slopes were obtained from the PGLS model presented in Supplementary Table 4. Points are proportional to the log number of individuals with known cause of death.CC BY · PubMed Central

Verification

Claims the paper makes

The claims and statistics of this paper haven’t been checked yet.

Run the check — free, no account needed. It reads the open-access text and checks the sources it cites.

A few free checks a day · papers already verified open instantly · results are public

Claims other papers make about this one

Each is checked against this paper’s own text: does it say what the citing paper says it does?

Self-check

Percentages, sums and reported differences re-computed from the paper’s own numbers.

The self-check needs the paper’s full text.

Citations

Cites

Show all 2 references

Research works printed but not linked: 38

  1. Leroi, A. M., Koufopanou, V. & Burt, A. Cancer selection. Nat. Rev. Cancer 3, 226–231 (2003). · DOI
  2. Armitage, P. & Doll, R. The age distribution of cancer and a multi-stage theory of carcinogenesis. Br. J. Cancer 8, 1–12 (1954). · DOI · Paper page
  3. Wirén, S. et al. Pooled cohort study on height and risk of cancer and cancer death. Cancer Causes Control 25, 151–159 (2014). · DOI
  4. Fleming, J. M., Creevy, K. E. & Promislow, D. E. L. Mortality in North American dogs from 1984 to 2004: an investigation into age-, size-, and breed-related causes of death. J. Vet. Intern. Med. 25, 187–198 (2011). · DOI
  5. Nunney, L. Lineage selection and the evolution of multistage carcinogenesis. Proc. R. Soc. B 266, 493–498 (1999). · DOI
  6. Couzin-Frankel, J. The bad luck of cancer. Science 347, 12 (2015). · DOI
  7. Nunney, L. The real war on cancer: the evolutionary dynamics of cancer suppression. Evol. Appl. 6, 11–19 (2013). · DOI
  8. Nunney, L. Size matters: height, cell number and a person’s risk of cancer. Proc. R. Soc. B 285, 20181743 (2018). · DOI
  9. Caulin, A. F. & Maley, C. C. Peto’s paradox: evolution’s prescription for cancer prevention. Trends Ecol. Evol. 26, 175–182 (2011). · DOI
  10. Nunney, L., Maley, C. C., Breen, M., Hochberg, M. E. & Schiffman, J. D. Peto’s paradox and the promise of comparative oncology. Philos. Trans. R. Soc. B 370, 20140177 (2015). · DOI
  11. Peto, R. Epidemiology, multistage models, and short-term mutagenicity tests. Int. J. Epidemiol. 45, 621–637 (2016). · DOI · Paper page
  12. Boddy, A. M. et al. Lifetime cancer prevalence and life history traits in mammals. Evol. Med. Public Health 2020, 187–195 (2020). · DOI
  13. Møller, A. P., Erritzøe, J. & Soler, J. J. Life history, immunity, Peto’s paradox and tumours in birds. J. Evol. Biol. 30, 960–967 (2017). · DOI
  14. Abegglen, L. M. et al. Potential mechanisms for cancer resistance in elephants and comparative cellular response to DNA damage in humans. JAMA 314, 1850–1860 (2015). · DOI · Paper page
  15. Tollis, M. et al. Elephant genomes reveal accelerated evolution in mechanisms underlying disease defenses. Mol. Biol. Evol. 38, 3606–3620 (2021). · DOI
  16. Conde, D. A. et al. Data gaps and opportunities for comparative and conservation biology. Proc. Natl Acad. Sci. USA 116, 9658–9664 (2019). · DOI
  17. Ronget, V. & Gaillard, J. M. Assessing ageing patterns for comparative analyses of mortality curves: going beyond the use of maximum longevity. Funct. Ecol. 34, 65–75 (2020). · DOI
  18. Tidière, M. et al. Comparative analyses of longevity and senescence reveal variable survival benefits of living in zoos across mammals. Sci. Rep. 6, 36361 (2016). · DOI
  19. Revell, L. J. phytools: an R package for phylogenetic comparative biology (and other things). Methods Ecol. Evol. 3, 217–223 (2012). · DOI
  20. Moresco, A. et al. Taxonomic distribution of neoplasia among non-domestic felid species under managed care. Animals 10, 2376 (2020). · DOI
  21. Harrenstien, L. A. et al. Mammary cancer in captive wild felids and risk factors for its development: a retrospective study of the clinical behavior of 31 cases. J. Zoo Wildl. Med. 27, 468–476 (1996).
  22. Munson, L. & Moresco, A. Comparative pathology of mammary gland cancers in domestic and wild animals. Breast Disease 28, 7–21 (2007). · DOI
  23. Chao, A. et al. Meat consumption and risk of colorectal cancer. JAMA 293, 172–182 (2005). · DOI
  24. Kelly, B. C., Ikonomou, M. G., Blair, J. D., Morin, A. E. & Gobas, F. A. P. C. Food web-specific biomagnification of persistent organic pollutants. Science 317, 236–239 (2007). · DOI · Paper page
  25. Pesavento, P. A., Agnew, D., Keel, M. K. & Woolard, K. D. Cancer in wildlife: patterns of emergence. Nat. Rev. Cancer 18, 646–661 (2018). · DOI
  26. Bogolyubova, A. V. Human oncogenic viruses: old facts and new hypotheses. Mol. Biol. 53, 767–775 (2019). · DOI
  27. Khatami, A. et al. Bovine leukemia virus (BLV) and risk of breast cancer: a systematic review and meta-analysis of case-control studies. Infect. Agents Cancer 15, 48 (2020). · DOI
  28. Kissling, W. D. et al. Establishing macroecological trait datasets: digitalization, extrapolation, and validation of diet preferences in terrestrial mammals worldwide. Ecol. Evol. 4, 2913–2930 (2014). · DOI
  29. Ley, R. E. et al. Evolution of mammals and their gut microbes. Science 320, 1647–1651 (2008). · DOI · Paper page
  30. Seluanov, A., Gladyshev, V. N., Vijg, J. & Gorbunova, V. Mechanisms of cancer resistance in long-lived mammals. Nat. Rev. Cancer 18, 433–441 (2018). · DOI
  31. Herrera-Álvarez, S., Karlsson, E., Ryder, O. A., Lindblad-Toh, K. & Crawford, A. J. How to make a rodent giant: genomic basis and tradeoffs of gigantism in the capybara, the world’s largest rodent. Mol. Biol. Evol. 38, 1715–1730 (2021). · DOI
  32. Albuquerque, T. A. F., Drummond do Val, L., Doherty, A. & de Magalhães, J. P. From humans to hydra: patterns of cancer across the tree of life. Biol. Rev. 93, 1715–1734 (2018). · DOI
  33. Giraudeau, M., Sepp, T., Ujvari, B., Ewald, P. W. & Thomas, F. Human activities might influence oncogenic processes in wild animal populations. Nat. Ecol. Evol. 2, 1065–1070 (2018). · DOI
  34. Upham, N. S., Esselstyn, J. A. & Jetz, W. Inferring the mammal tree: species-level sets of phylogenies for questions in ecology, evolution, and conservation. PLoS Biol. 17, e3000494 (2019). · DOI
  35. Sukumaran, J. & Holder, M. T. DendroPy: a Python library for phylogenetic computing. Bioinformatics 26, 1569–1571 (2010). · DOI
  36. Ives, A. R. R2s for correlated data: phylogenetic models, LMMs, and GLMMs. Syst. Biol. 68, 234–251 (2018). · DOI
  37. Paradis, E., Claude, J. & Strimmer, K. APE: Analyses of Phylogenetics and Evolution in R language. Bioinformatics 20, 289–290 (2004). · DOI · Paper page
  38. Warton, D. I. & Hui, F. K. C. The arcsine is asinine: the analysis of proportions in ecology. Ecology 92, 3–10 (2011). · DOI

Cited by

Sorted by citations

Metadata

Authors
Vincze, O., Colchero, F., Lemaître, J.-F., Conde, D. A., Pavard, S., Bieuville, M., Urrutia, A. O., Ujvari, B., Boddy, A. M., Maley, C. C., Thomas, F., & Giraudeau, M.
Venue
Nature
Published
2021-12-22
Volume
601
Issue
7892
Pages
263-267
ISSN
  • 0028-0836
  • 1476-4687
Cited by
226
References
2
Language
en

About these checks

Registry, retraction, Cites and statistics results are computed, not judged, with one exception: a printed reference that no index lists is read once by a model before it counts as a citation error. Claims are extracted by a model and kept only when their quote appears verbatim in the text; each cited source is then checked, with a model’s help, for whether it says what the claim relies on. Those verdicts can be wrong — read the claim’s quote and the cited source before relying on one.

Statistics and arithmetic are recomputed, not judged.

Confidence bands are shown only for fields calibrated on our annotated test set. None is calibrated yet, so no band is shown.

What counts as a claim ›How we measure confidence ›How we check this ›

Are you an author, or do you see a problem with this page? Request a review