CoChat

A quantum processor based on coherent transport of entangled atom arrays

Open access

The DOI matches its Crossref record; 83 of the 83 references it cites were found in a registry or an index.

Abstract

The ability to engineer parallel, programmable operations between desired qubits within a quantum processor is key for building scalable quantum information systems 1,2 . In most state-of-the-art approaches, qubits interact locally, constrained by the connectivity associated with their fixed spatial layout. Here we demonstrate a quantum processor with dynamic, non-local connectivity, in which entangled qubits are coherently transported in a highly parallel manner across two spatial dimensions, between layers of single- and two-qubit operations. Our approach makes use of neutral atom arrays trapped and transported by optical tweezers; hyperfine states are used for robust quantum information storage, and excitation into Rydberg states is used for entanglement generation 3–5 . We use this architecture to realize programmable generation of entangled graph states, such as cluster states and a seven-qubit Steane code state 6,7 . Furthermore, we shuttle entangled ancilla arrays to realize a surface code state with thirteen data and six ancillary qubits 8 and a toric code state on a torus with sixteen data and eight ancillary qubits 9 . Finally, we use this architecture to realize a hybrid analogue–digital evolution 2 and use it for measuring entanglement entropy in quantum simulations 10–12 , experimentally observing non-monotonic entanglement dynamics associated with quantum many-body scars 13,14 . Realizing a long-standing goal, these results provide a route towards scalable quantum processing and enable applications ranging from simulation to metrology.

Overview

The claims and statistics of this paper haven’t been checked yet.

Free: it reads the open-access text and checks the first 5 claims that cite a source we can check. Create a free account to check every claim.

A few free checks a day · papers already verified open instantly · results are public

Integrity signals

Registry

Crossref · 10.1038/s41586-022-04592-6

Cites

83 of 83 references verified0 citation errors · 0 not checkable

Statistics

Figures

Fig. 1 Quantum information architecture enabled by coherent transport of neutral atoms. a, In our approach, qubits are transported to perform entangling gates with distant qubits, enabling programmable and non-local connectivity. Atom shuttling is performed using optical tweezers, with high parallelism in two dimensions and between multiple zones allowing selective manipulations. Inset: the atomic levels used. The |0⟩, |1⟩ qubit states refer to the mF = 0 clock states of 87Rb, and |r⟩ is a Rydberg state used for generating entanglement between qubits (Extended Data Fig. 1b). b, Atom images illustrating coherent transport of entangled qubits. Using a sequence of single-qubit and two-qubit gates, atom pairs are each prepared in the |Φ+⟩ Bell state (Methods), and are then separated by 110 μm over a span of 300 μs. c, Parity oscillations indicate that movement does not observably affect entanglement or coherence. For both the moving and the stationary measurements, qubit coherence is preserved using an XY8 dynamical decoupling sequence for 300 μs (Methods). d, Measured Bell-state fidelity as a function of separation speed over the 110 μm, showing that fidelity is unaffected for a move slower than 200 μs (average separation speed of 0.55 μm μs−1). Inset: normalizing by atom loss during the move results in constant fidelity, indicating that atom loss is the dominant error mechanism (see Methods for details).
Fig. 1 Quantum information architecture enabled by coherent transport of neutral atoms. a, In our approach, qubits are transported to perform entangling gates with distant qubits, enabling programmable and non-local connectivity. Atom shuttling is performed using optical tweezers, with high parallelism in two dimensions and between multiple zones allowing selective manipulations. Inset: the atomic levels used. The |0⟩, |1⟩ qubit states refer to the mF = 0 clock states of 87Rb, and |r⟩ is a Rydberg state used for generating entanglement between qubits (Extended Data Fig. 1b). b, Atom images illustrating coherent transport of entangled qubits. Using a sequence of single-qubit and two-qubit gates, atom pairs are each prepared in the |Φ+⟩ Bell state (Methods), and are then separated by 110 μm over a span of 300 μs. c, Parity oscillations indicate that movement does not observably affect entanglement or coherence. For both the moving and the stationary measurements, qubit coherence is preserved using an XY8 dynamical decoupling sequence for 300 μs (Methods). d, Measured Bell-state fidelity as a function of separation speed over the 110 μm, showing that fidelity is unaffected for a move slower than 200 μs (average separation speed of 0.55 μm μs−1). Inset: normalizing by atom loss during the move results in constant fidelity, indicating that atom loss is the dominant error mechanism (see Methods for details).CC BY · PubMed Central
Fig. 2 One- and two-dimensional graph states using dynamic entanglement transport. a, Generation of a 12-atom 1D cluster-state graph, created by initializing all qubits (vertices) in |+⟩ and applying CZ gates on the links (edges) between qubits. The atom images show the configuration for the first and second gate layers. b, Quantum circuit representation of the 1D cluster-state preparation and measurement. Dynamical decoupling is applied throughout all quantum circuits (Methods). c, Raw measured stabilizers of the resulting 1D cluster state, given by Si = Zi−1XiZi+1 (X1Z2 and Z11X12 for the edge qubits). d, Graph-state representation of the seven-qubit Steane code (colours represent stabilizer plaquettes). e, Circuit for preparing the Steane code logical |+⟩L state, performed in four parallel gate layers. f, Measured stabilizers and logical operators after preparing |+⟩L. Error detection is done by postselecting on measurements where all stabilizers are +1. For both the 1D cluster state and the Steane code, the stabilizers and logical operators are measured with two measurement settings (see text). Error bars represent 68% confidence intervals.
Fig. 2 One- and two-dimensional graph states using dynamic entanglement transport. a, Generation of a 12-atom 1D cluster-state graph, created by initializing all qubits (vertices) in |+⟩ and applying CZ gates on the links (edges) between qubits. The atom images show the configuration for the first and second gate layers. b, Quantum circuit representation of the 1D cluster-state preparation and measurement. Dynamical decoupling is applied throughout all quantum circuits (Methods). c, Raw measured stabilizers of the resulting 1D cluster state, given by Si = Zi−1XiZi+1 (X1Z2 and Z11X12 for the edge qubits). d, Graph-state representation of the seven-qubit Steane code (colours represent stabilizer plaquettes). e, Circuit for preparing the Steane code logical |+⟩L state, performed in four parallel gate layers. f, Measured stabilizers and logical operators after preparing |+⟩L. Error detection is done by postselecting on measurements where all stabilizers are +1. For both the 1D cluster state and the Steane code, the stabilizers and logical operators are measured with two measurement settings (see text). Error bars represent 68% confidence intervals.CC BY · PubMed Central
Fig. 3 Topological surface code and toric code states using mobile ancilla qubit arrays. a, Graph state realizing the surface code. Left: the circuit depicts formation of the graph state by use of mobile ancilla qubits; each move corresponds to performing a CZ gate with a neighbouring data qubit (illustrated in box). The logical |+⟩L state is created upon projective measurement of the ancilla qubits in the X basis. Right: stabilizers and logical operators of the code. b, Measured X-plaquette and Z-star stabilizers of the resultant surface code, along with logical operators with and without error detection (implemented in postselection). c, Implementation of the toric code. Top: graph state realizing the two logical-qubit product state (|+⟩)L⁽¹⁾(|+⟩)L⁽²⁾ of the toric code upon projective measurement of the ancilla qubits in the X basis. Bottom: images showing the movement steps implemented in creating and measuring the toric code state (Supplementary Video 1). The blue shading in the final image represents a local rotation on the data qubit zone. d, Measured X-plaquette and Z-star stabilizers, along with logical operators for the two logical qubits with and without error detection (implemented in postselection).
Fig. 3 Topological surface code and toric code states using mobile ancilla qubit arrays. a, Graph state realizing the surface code. Left: the circuit depicts formation of the graph state by use of mobile ancilla qubits; each move corresponds to performing a CZ gate with a neighbouring data qubit (illustrated in box). The logical |+⟩L state is created upon projective measurement of the ancilla qubits in the X basis. Right: stabilizers and logical operators of the code. b, Measured X-plaquette and Z-star stabilizers of the resultant surface code, along with logical operators with and without error detection (implemented in postselection). c, Implementation of the toric code. Top: graph state realizing the two logical-qubit product state (|+⟩)L⁽¹⁾(|+⟩)L⁽²⁾ of the toric code upon projective measurement of the ancilla qubits in the X basis. Bottom: images showing the movement steps implemented in creating and measuring the toric code state (Supplementary Video 1). The blue shading in the final image represents a local rotation on the data qubit zone. d, Measured X-plaquette and Z-star stabilizers, along with logical operators for the two logical qubits with and without error detection (implemented in postselection).CC BY · PubMed Central
Fig. 4 Dynamic reconfigurability for hybrid analogue–digital quantum simulation. a, Hybrid quantum circuit combining coherent atom transport with analogue Hamiltonian evolution and digital quantum gates. b, Measuring entanglement entropy in a many-body Rydberg system via two-copy interferometry. c, Measured half-chain Renyi entanglement entropy after many-body dynamics following quenches on two eight-atom systems. Quenching from |gggg...⟩ (|g⟩ ≡ |1⟩) results in rapid entropy growth and saturation, signifying quantum thermalization. Quenching from |rgrg...⟩ reveals a significantly slower growth of entanglement entropy. d, Measuring the mutual information at 0.5-μs quench time reveals a volume-law scaling for the thermalizing |gggg...⟩ state, and an area-law scaling for the scarring |rgrg...⟩ state. e, The single-site Renyi entropies for sites in the middle of the chain quickly increase and saturate for the |gggg...⟩ quench, but show large oscillations for the |rgrg...⟩ quench. The solid curves are results of exact numerical simulations for the isolated quantum system under HRyd with no free parameters (see Methods for details of data processing). Error bars represent one standard deviation.
Fig. 4 Dynamic reconfigurability for hybrid analogue–digital quantum simulation. a, Hybrid quantum circuit combining coherent atom transport with analogue Hamiltonian evolution and digital quantum gates. b, Measuring entanglement entropy in a many-body Rydberg system via two-copy interferometry. c, Measured half-chain Renyi entanglement entropy after many-body dynamics following quenches on two eight-atom systems. Quenching from |gggg...⟩ (|g⟩ ≡ |1⟩) results in rapid entropy growth and saturation, signifying quantum thermalization. Quenching from |rgrg...⟩ reveals a significantly slower growth of entanglement entropy. d, Measuring the mutual information at 0.5-μs quench time reveals a volume-law scaling for the thermalizing |gggg...⟩ state, and an area-law scaling for the scarring |rgrg...⟩ state. e, The single-site Renyi entropies for sites in the middle of the chain quickly increase and saturate for the |gggg...⟩ quench, but show large oscillations for the |rgrg...⟩ quench. The solid curves are results of exact numerical simulations for the isolated quantum system under HRyd with no free parameters (see Methods for details of data processing). Error bars represent one standard deviation.CC BY · PubMed Central
Extended Data Fig. 1 CZ gate echo, atomic level structure, and typical pulse sequence. a, The two-qubit gates we apply, in addition to applying a controlled-Z operation between the two qubits, also induce a single-qubit phase Z(ζ) to both qubits, composed of the intrinsic phase of the CZ gate5 and additional spurious phases from the 420-nm Rydberg laser and pulsing the traps off. Since we apply all gates in parallel by global pulses of the Rydberg laser, if a qubit is not adjacent to another qubit, it does not perform a CZ gate but still acquires the same Z(ζ) (identical to being adjacent to another qubit in state |0⟩, which is dark to the Rydberg laser). As diagrammed, we cancel the additional, undesired Z(ζ) by applying a π pulse between pairs of CZ gates. This echo procedure removes any need to calibrate the intrinsic phase from the CZ gate, and renders us insensitive to any spurious changes in Z(ζ) slower than ~200 μs. The additional Y(π) propagates in a known way through the CZ gates and multiplies certain stabilizers by a −1 sign, which simply redefines the sign of stabilizers and logical qubits. b, Level diagram showing key 87Rb atomic levels used. Our Rydberg excitation scheme from |1⟩ to |r⟩ is composed of a two-photon transition driven by a 420-nm laser and a 1013-nm laser (see ref. 25 for description of laser system). A DC magnetic field of B = 8.5 G is applied throughout this work. c, A typical pulse sequence for running a quantum circuit.
Extended Data Fig. 1 CZ gate echo, atomic level structure, and typical pulse sequence. a, The two-qubit gates we apply, in addition to applying a controlled-Z operation between the two qubits, also induce a single-qubit phase Z(ζ) to both qubits, composed of the intrinsic phase of the CZ gate5 and additional spurious phases from the 420-nm Rydberg laser and pulsing the traps off. Since we apply all gates in parallel by global pulses of the Rydberg laser, if a qubit is not adjacent to another qubit, it does not perform a CZ gate but still acquires the same Z(ζ) (identical to being adjacent to another qubit in state |0⟩, which is dark to the Rydberg laser). As diagrammed, we cancel the additional, undesired Z(ζ) by applying a π pulse between pairs of CZ gates. This echo procedure removes any need to calibrate the intrinsic phase from the CZ gate, and renders us insensitive to any spurious changes in Z(ζ) slower than ~200 μs. The additional Y(π) propagates in a known way through the CZ gates and multiplies certain stabilizers by a −1 sign, which simply redefines the sign of stabilizers and logical qubits. b, Level diagram showing key 87Rb atomic levels used. Our Rydberg excitation scheme from |1⟩ to |r⟩ is composed of a two-photon transition driven by a 420-nm laser and a 1013-nm laser (see ref. 25 for description of laser system). A DC magnetic field of B = 8.5 G is applied throughout this work. c, A typical pulse sequence for running a quantum circuit.CC BY · PubMed Central
Extended Data Fig. 2 Movement characterization and multiple drop-recaptures. a, Atom retention as a function of average separation speed 2D/T (as is plotted in Fig. 1d of the main text for separating Bell pairs), with subtracted background loss of 0.7%. The inset in Fig. 1d of the main text is normalized by (Atom retention)2 (without subtracting background loss). Dark curve is calculated using experimental parameters and Eq. 2, matched to the experimental data by setting Nmax = 26 and averaging over a range of ω0/2π of ±15% around an average ω0/2π = 40 kHz. b, Atom retention as a function of inverse trap frequency (2π/ω0) after the four moves of the surface code circuit. For calculating the atom loss here we set Nmax = 33 and average the trap frequencies over a range of ± 15%. We note that these quantitative estimates are sensitive to ω0 which we roughly estimate. c, Atom loss as a function of drop time and number of drop loops, with 100 μs wait between each drop. When running quantum circuits we use 500-ns drops for each CZ gate (to avoid anti-trapping of the Rydberg state and light shifts of the transition), for which we observe here that hundreds of drops can be made (corresponding to hundreds of possible CZ gates per atom) before atom loss becomes significant. d, By rescaling the x-axis of the data to tdrop√N, we find the data of the various tdrop collapse onto a universal curve, suggesting a diffusion model for explaining the atom loss after a certain number of drops. By modeling such a diffusion process analytically we obtain the black curve with a temperature of 10 μK and a trapping radius of 1 μm.
Extended Data Fig. 2 Movement characterization and multiple drop-recaptures. a, Atom retention as a function of average separation speed 2D/T (as is plotted in Fig. 1d of the main text for separating Bell pairs), with subtracted background loss of 0.7%. The inset in Fig. 1d of the main text is normalized by (Atom retention)2 (without subtracting background loss). Dark curve is calculated using experimental parameters and Eq. 2, matched to the experimental data by setting Nmax = 26 and averaging over a range of ω0/2π of ±15% around an average ω0/2π = 40 kHz. b, Atom retention as a function of inverse trap frequency (2π/ω0) after the four moves of the surface code circuit. For calculating the atom loss here we set Nmax = 33 and average the trap frequencies over a range of ± 15%. We note that these quantitative estimates are sensitive to ω0 which we roughly estimate. c, Atom loss as a function of drop time and number of drop loops, with 100 μs wait between each drop. When running quantum circuits we use 500-ns drops for each CZ gate (to avoid anti-trapping of the Rydberg state and light shifts of the transition), for which we observe here that hundreds of drops can be made (corresponding to hundreds of possible CZ gates per atom) before atom loss becomes significant. d, By rescaling the x-axis of the data to tdrop√N, we find the data of the various tdrop collapse onto a universal curve, suggesting a diffusion model for explaining the atom loss after a certain number of drops. By modeling such a diffusion process analytically we obtain the black curve with a temperature of 10 μK and a trapping radius of 1 μm.CC BY · PubMed Central
Extended Data Fig. 3 Robust single-qubit control and qubit coherence. a, Robust BB1 single-qubit rotation in comparison to a normal single-qubit rotation, as a function of pulse area error. An arbitrary BB1(θ, ϕ) rotation on the Bloch sphere of angle θ about axis ϕ is realized with a sequence of four pulses: (π)φ + ϕ(2π)3φ + ϕ(π)φ + ϕ(θ)ϕ, where φ = cos−1 (−θ/4π)60. Pulse fidelity is measured here for a π pulse, defined such that the fidelity is the probability of successful transfer from |0⟩ → |1⟩, including SPAM correction. b, Preserving hyperfine qubit coherence using dynamical decoupling (XY16 with 128 total π pulses). Qubit coherence is observed on a timescale of seconds, with a fitted coherence time T2 = 1.49(8)s. Data is measured with either a + π/2 or −π/2 pulse at the end of the sequence, and these curves are then subtracted to yield the coherence y-axis. c, Hyperfine qubit T1, measured by the difference of final F = 2 populations between measurements starting in |F = 2, mF = 0⟩ and |F = 1, mF = 0⟩. Atom loss without cooling is separately measured (predominantly arising from vacuum loss) and normalized to also measure the intrinsic spin relaxation time T1^(′) in the absence of atom loss. All data here is measured in 830-nm traps.
Extended Data Fig. 3 Robust single-qubit control and qubit coherence. a, Robust BB1 single-qubit rotation in comparison to a normal single-qubit rotation, as a function of pulse area error. An arbitrary BB1(θ, ϕ) rotation on the Bloch sphere of angle θ about axis ϕ is realized with a sequence of four pulses: (π)φ + ϕ(2π)3φ + ϕ(π)φ + ϕ(θ)ϕ, where φ = cos−1 (−θ/4π)60. Pulse fidelity is measured here for a π pulse, defined such that the fidelity is the probability of successful transfer from |0⟩ → |1⟩, including SPAM correction. b, Preserving hyperfine qubit coherence using dynamical decoupling (XY16 with 128 total π pulses). Qubit coherence is observed on a timescale of seconds, with a fitted coherence time T2 = 1.49(8)s. Data is measured with either a + π/2 or −π/2 pulse at the end of the sequence, and these curves are then subtracted to yield the coherence y-axis. c, Hyperfine qubit T1, measured by the difference of final F = 2 populations between measurements starting in |F = 2, mF = 0⟩ and |F = 1, mF = 0⟩. Atom loss without cooling is separately measured (predominantly arising from vacuum loss) and normalized to also measure the intrinsic spin relaxation time T1^(′) in the absence of atom loss. All data here is measured in 830-nm traps.CC BY · PubMed Central
Extended Data Fig. 4 Effect of axial trap oscillations on echo fidelity of 420-nm Rydberg pulse. a, Noise correlation measurement of the 420-nm Rydberg laser pulse intensity. In the blue-detuned configuration used in this figure only, the 420-nm laser induces an 8 MHz differential light shift on the hyperfine qubit, and consequently a phase accumulation of 32π during a 2-μs pulse (our CZ gates are 400-ns total). Small fluctuations of the 420-nm laser intensity lead to large fluctuations in phase accumulation of the hyperfine qubit, and thus cause significant dephasing. The echo sequence diagrammed here probes the correlation of the accumulated phase between two 420-nm pulses separated by a variable time τ, and thus informs how far-separated in time the 420-nm pulses can be while still properly echoing out fluctuations in the 420-nm intensity. b, Hyperfine coherence (a proxy for echo fidelity) versus gap time τ between the two 420-nm pulses. The echo fidelity decreases initially due to a decorrelation of the 420-nm intensity, but then increases again, showing that the correlation of the 420-nm intensity is non-monotonic. The decaying oscillations are fit to a functional form of y = y0 + Acos2(πfτ)exp[−(τ/T)2]. c, The fitted oscillation frequency f of the correlation / decorrelation of the noise follows a square-root relationship with the trap power, and is consistent with the expected axial trap oscillation frequency. These observations indicate that a significant portion of the correlation / decorrelation of the 420-nm noise arises from the several-μm axial oscillations of the atom in the trap. For this measurement, we intentionally displace the 420-nm beam by several μm in order to place the atom on a slope of the beam, increasing our sensitivity to this phenomenon. For the other experiments in our work, we minimize sensitivity to these effects by operating in the center of a larger (35-micron-waist) 420-nm beam and operating red-detuned of the intermediate-state transition.
Extended Data Fig. 4 Effect of axial trap oscillations on echo fidelity of 420-nm Rydberg pulse. a, Noise correlation measurement of the 420-nm Rydberg laser pulse intensity. In the blue-detuned configuration used in this figure only, the 420-nm laser induces an 8 MHz differential light shift on the hyperfine qubit, and consequently a phase accumulation of 32π during a 2-μs pulse (our CZ gates are 400-ns total). Small fluctuations of the 420-nm laser intensity lead to large fluctuations in phase accumulation of the hyperfine qubit, and thus cause significant dephasing. The echo sequence diagrammed here probes the correlation of the accumulated phase between two 420-nm pulses separated by a variable time τ, and thus informs how far-separated in time the 420-nm pulses can be while still properly echoing out fluctuations in the 420-nm intensity. b, Hyperfine coherence (a proxy for echo fidelity) versus gap time τ between the two 420-nm pulses. The echo fidelity decreases initially due to a decorrelation of the 420-nm intensity, but then increases again, showing that the correlation of the 420-nm intensity is non-monotonic. The decaying oscillations are fit to a functional form of y = y0 + Acos2(πfτ)exp[−(τ/T)2]. c, The fitted oscillation frequency f of the correlation / decorrelation of the noise follows a square-root relationship with the trap power, and is consistent with the expected axial trap oscillation frequency. These observations indicate that a significant portion of the correlation / decorrelation of the 420-nm noise arises from the several-μm axial oscillations of the atom in the trap. For this measurement, we intentionally displace the 420-nm beam by several μm in order to place the atom on a slope of the beam, increasing our sensitivity to this phenomenon. For the other experiments in our work, we minimize sensitivity to these effects by operating in the center of a larger (35-micron-waist) 420-nm beam and operating red-detuned of the intermediate-state transition.CC BY · PubMed Central
Extended Data Fig. 5 Movement schematics. Schematics showing the gate-by-gate creation of a the 1D cluster state, b the Steane code, c the surface code, and d the toric code (see also Supplementary Video 1), in a side-by-side comparison. These various graph states are all generated in the same way, and encoding a desired circuit is a matter of positioning the atoms in different initial positions and applying an appropriate AOD waveform. To realize a desired circuit, atom layouts and trajectories are optimized heuristically in the way described in the Methods text. Panel c also shows the definition of surface code stabilizers as ordered in the main text.
Extended Data Fig. 5 Movement schematics. Schematics showing the gate-by-gate creation of a the 1D cluster state, b the Steane code, c the surface code, and d the toric code (see also Supplementary Video 1), in a side-by-side comparison. These various graph states are all generated in the same way, and encoding a desired circuit is a matter of positioning the atoms in different initial positions and applying an appropriate AOD waveform. To realize a desired circuit, atom layouts and trajectories are optimized heuristically in the way described in the Methods text. Panel c also shows the definition of surface code stabilizers as ordered in the main text.CC BY · PubMed Central
Extended Data Fig. 6 Error simulations and tabulated single-qubit and two-qubit error estimates. We compare our measured graph state fidelities to those from a stochastic Monte Carlo simulation of our system for a, the surface code and b, the toric code. We find that the simulated stabilizers agree well with the experimental data for this empirical depolarizing noise model. In addition, for the surface code (toric code) in the experiment we find 35% (20%) of measurements detect no stabilizer errors, compared to 40% (26%) in the simulation. We assume two-qubit errors are described by rates of 0.2% Y error, 0.2% X error, 0.5% Z error, and 0.5% loss per qubit per parallel layer (4 layers for surface code, 5 layers for toric code), corresponding to a 97.2% CZ-gate fidelity. We also add ambient, single-qubit errors at a rate of 0.1% Y error, 0.1% X error, 0.4% Z error, and 0.2% loss per qubit per parallel layer, as well as an initial 1% loss before the circuit begins (empirically factoring in SPAM errors). c, Tabulation of single-qubit (SQ) and two-qubit (TQ) gate errors that are measured, estimated, and extrapolated. Simulated TQ fidelities include the 0.6% scattering error from the 420-nm echo pulse. The estimated TQ fidelities are given for the experiments of the surface code and toric code, but is an underestimate of the TQ fidelities for the cluster state and Steane code measurements where we increase the 1013-nm intensity by 2× and reduce the 420-nm intensity by 2×, increasing gate fidelity. The Bell state estimate of CZ gate fidelity is similarly done with 2× higher 1013 intensity, but includes the 420-nm echo pulse, and consequently yields a similar gate fidelity as the surface and toric code estimates.
Extended Data Fig. 6 Error simulations and tabulated single-qubit and two-qubit error estimates. We compare our measured graph state fidelities to those from a stochastic Monte Carlo simulation of our system for a, the surface code and b, the toric code. We find that the simulated stabilizers agree well with the experimental data for this empirical depolarizing noise model. In addition, for the surface code (toric code) in the experiment we find 35% (20%) of measurements detect no stabilizer errors, compared to 40% (26%) in the simulation. We assume two-qubit errors are described by rates of 0.2% Y error, 0.2% X error, 0.5% Z error, and 0.5% loss per qubit per parallel layer (4 layers for surface code, 5 layers for toric code), corresponding to a 97.2% CZ-gate fidelity. We also add ambient, single-qubit errors at a rate of 0.1% Y error, 0.1% X error, 0.4% Z error, and 0.2% loss per qubit per parallel layer, as well as an initial 1% loss before the circuit begins (empirically factoring in SPAM errors). c, Tabulation of single-qubit (SQ) and two-qubit (TQ) gate errors that are measured, estimated, and extrapolated. Simulated TQ fidelities include the 0.6% scattering error from the 420-nm echo pulse. The estimated TQ fidelities are given for the experiments of the surface code and toric code, but is an underestimate of the TQ fidelities for the cluster state and Steane code measurements where we increase the 1013-nm intensity by 2× and reduce the 420-nm intensity by 2×, increasing gate fidelity. The Bell state estimate of CZ gate fidelity is similarly done with 2× higher 1013 intensity, but includes the 420-nm echo pulse, and consequently yields a similar gate fidelity as the surface and toric code estimates.CC BY · PubMed Central
Extended Data Fig. 7 Properties of encoded logical states. a, Summary of logical error probabilities for the various error correcting graphs made in this work (all in logical state |+⟩L), for raw measurements as well as implementing error correction and error detection in postprocessing. Error correction for the Steane code is implemented with the Steane code decoder36,73 and is implemented with the minimum-weight-perfect-matching algorithm for the surface and toric codes38. For the even-distance toric code, when correction is ambiguous we do not flip the logical qubit, and accordingly the distance d = 2 logical qubit does not change under the correction procedure. We remark that the observed fidelities are comparable to similar demonstrations in state-of-the-art experiments with other platforms8,74. These will need to be improved to surpass the threshold for practical error correction38 (see Methods text). b, Lifetime of the logical |+⟩L state on the surface code, with correction and detection performed in postprocessing as in a. After state preparation, the |+⟩L state is held for a variable time before projective measurement, with two π pulses applied for dynamical decoupling (lifetime can be extended significantly further by applying e.g. 128 π pulses as done in Extended Data Fig. 3b). Some experimental parameters are slightly different here compared to those in a, hence the higher error rates here at the time 0 point. c, Logical π/2 rotation on the Steane code to prepare logical qubit state |0L⟩. The Steane code, surface code, and toric code all have transversal single-qubit Clifford operations on the logical qubit8,36 (including in-software rotations of the lattice), which is a high-fidelity operation in our system since the transveral rotations are implemented in parallel with our global Raman laser and the physical single-qubit fidelities are high. We show a logical π/2 rotation here for the Steane code as an example but emphasize that we can readily realize the various basis states for all of these codes.
Extended Data Fig. 7 Properties of encoded logical states. a, Summary of logical error probabilities for the various error correcting graphs made in this work (all in logical state |+⟩L), for raw measurements as well as implementing error correction and error detection in postprocessing. Error correction for the Steane code is implemented with the Steane code decoder36,73 and is implemented with the minimum-weight-perfect-matching algorithm for the surface and toric codes38. For the even-distance toric code, when correction is ambiguous we do not flip the logical qubit, and accordingly the distance d = 2 logical qubit does not change under the correction procedure. We remark that the observed fidelities are comparable to similar demonstrations in state-of-the-art experiments with other platforms8,74. These will need to be improved to surpass the threshold for practical error correction38 (see Methods text). b, Lifetime of the logical |+⟩L state on the surface code, with correction and detection performed in postprocessing as in a. After state preparation, the |+⟩L state is held for a variable time before projective measurement, with two π pulses applied for dynamical decoupling (lifetime can be extended significantly further by applying e.g. 128 π pulses as done in Extended Data Fig. 3b). Some experimental parameters are slightly different here compared to those in a, hence the higher error rates here at the time 0 point. c, Logical π/2 rotation on the Steane code to prepare logical qubit state |0L⟩. The Steane code, surface code, and toric code all have transversal single-qubit Clifford operations on the logical qubit8,36 (including in-software rotations of the lattice), which is a high-fidelity operation in our system since the transveral rotations are implemented in parallel with our global Raman laser and the physical single-qubit fidelities are high. We show a logical π/2 rotation here for the Steane code as an example but emphasize that we can readily realize the various basis states for all of these codes.CC BY · PubMed Central
Extended Data Fig. 8 Benchmarking the interferometry measurement. a, To benchmark our gate-based interferometry technique, we prepare variable single-particle pure states (by applying a variable-length resonant Raman pulse) and then reconfigure the system and apply the interferometry circuit on twin pairs. The interferometry circuit converts the anti-symmetric singlet state |Ψ−⟩ to the computational basis state |00⟩, while converting the symmetric triplet states to other computational states. We plot the resulting twin pair output states in the left panel. We rarely observe the |00⟩ state (1.95(2)% of measurements), with a measurement fidelity independent of the initial state. This low probability P00 of observing |00⟩ corresponds to a high extracted single-particle purity of 2P00 − 1 = 0.961(3) (right panel). We find this measurement to be a useful benchmark, as interferometry miscalibrations can result in significant state-dependence of the observed purity that would then compromise the validity of the many-body entanglement entropy measurement. b, Benchmarking the entanglement entropy measurement with Bell state arrays. (Top) Microstate populations during two-particle oscillations between |11⟩ and 1/(√2)(|1r⟩+|r1⟩) under a Rydberg pulse of variable duration. Faint lines show measurement results in the {|1⟩, |r⟩} basis, and dark lines show results in the {|0⟩, |1⟩} basis after the coherent mapping process. (Bottom) Measured local and global purities by analyzing the number parity of observed |00⟩ twin pairs in each measurement. For this two-particle data we use a gap of 230 ns in the coherent mapping sequence as opposed to the 150-ns gap used in the many-body data.
Extended Data Fig. 8 Benchmarking the interferometry measurement. a, To benchmark our gate-based interferometry technique, we prepare variable single-particle pure states (by applying a variable-length resonant Raman pulse) and then reconfigure the system and apply the interferometry circuit on twin pairs. The interferometry circuit converts the anti-symmetric singlet state |Ψ−⟩ to the computational basis state |00⟩, while converting the symmetric triplet states to other computational states. We plot the resulting twin pair output states in the left panel. We rarely observe the |00⟩ state (1.95(2)% of measurements), with a measurement fidelity independent of the initial state. This low probability P00 of observing |00⟩ corresponds to a high extracted single-particle purity of 2P00 − 1 = 0.961(3) (right panel). We find this measurement to be a useful benchmark, as interferometry miscalibrations can result in significant state-dependence of the observed purity that would then compromise the validity of the many-body entanglement entropy measurement. b, Benchmarking the entanglement entropy measurement with Bell state arrays. (Top) Microstate populations during two-particle oscillations between |11⟩ and 1/(√2)(|1r⟩+|r1⟩) under a Rydberg pulse of variable duration. Faint lines show measurement results in the {|1⟩, |r⟩} basis, and dark lines show results in the {|0⟩, |1⟩} basis after the coherent mapping process. (Bottom) Measured local and global purities by analyzing the number parity of observed |00⟩ twin pairs in each measurement. For this two-particle data we use a gap of 230 ns in the coherent mapping sequence as opposed to the 150-ns gap used in the many-body data.CC BY · PubMed Central
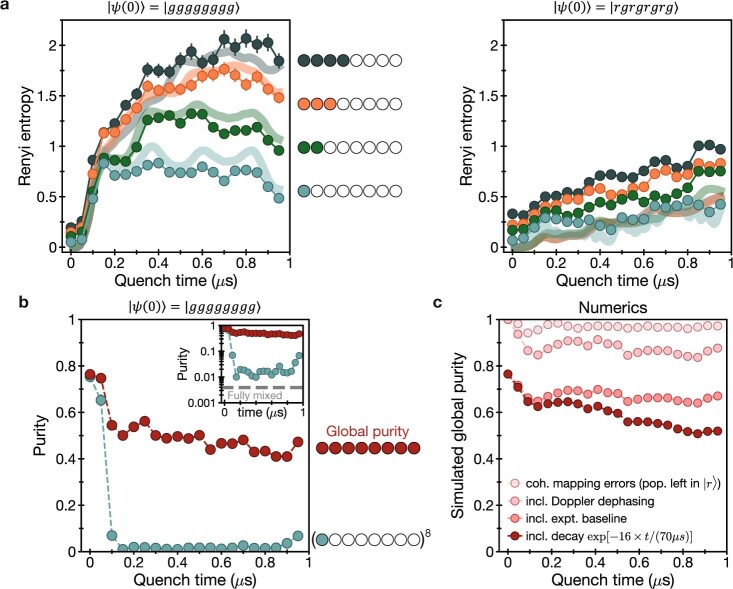
Extended Data Fig. 9 Raw many-body data and numerical modeling of errors. a, Raw measured Renyi entropy without subtracting the extensive classical entropy, as a function of subsystem size for quenches from |rgrgrgrg⟩ and |gggggggg⟩. The Renyi entropy of the 4-atom subsystem is the same underlying data as the half-chain entanglement entropy plotted in Fig. 4d of the main text. In the main text, we subtract the data by a fixed offset given by the classical entropy-per-particle, corresponding to the time = 0 offset for each subsystem size. The extensive, classical entropy offset is slightly larger for the |rgrgrgrg⟩ quench due to non-unity fidelities both of preparing |r⟩ and mapping |r⟩ → |1⟩. b, Raw global purity after the |gggggggg⟩ quench. The global purity is a sensitive proxy for the fidelity of our entire process. We find this 16-body observable, composed of three-level systems, remains > 100× the purity expected for a fully mixed state of 8 qubits (1/28) (see inset). For comparison of scale we also plot single-particle purity to the 8th power, to indicate what the global purity would be if the measurement results on each twin were uncorrelated. c, Global purity for the 8-atom quench calculated through numerical modeling of the three-level system {|0⟩, |1⟩ ≡ |g⟩, |r⟩} with a variety of simulated error sources. We model the experimentally measured purity by calculating the expectation value of the SWAP operator in the {|0⟩, |1⟩} basis between two independent chains, taking into account that residual population in |r⟩ results in atom loss and measurement associated with the +1 eigenvalue of the SWAP operator (as the twin state |00⟩ can no longer be detected). The top curve includes only errors from population left in |r⟩ following the coherent mapping step (see methods text). The second-from-top curve includes single-site dephasing (T2^(⁎)) during the Rydberg dynamics and the coherent mapping gap, modeled by a random on-site detuning which is Gaussian-distributed with zero mean and standard deviation of 100 kHz. The third and fourth curves include multiplication by the experimentally observed raw global purity at quench time t = 0, and then further multiplying empirically by an exponential decay exp[−16 × t/(70 μs)] as a simple model for scattering and decay errors with an experimentally estimated rate of roughly 70 μs for each of the 16 atoms between the two chains.
Extended Data Fig. 9 Raw many-body data and numerical modeling of errors. a, Raw measured Renyi entropy without subtracting the extensive classical entropy, as a function of subsystem size for quenches from |rgrgrgrg⟩ and |gggggggg⟩. The Renyi entropy of the 4-atom subsystem is the same underlying data as the half-chain entanglement entropy plotted in Fig. 4d of the main text. In the main text, we subtract the data by a fixed offset given by the classical entropy-per-particle, corresponding to the time = 0 offset for each subsystem size. The extensive, classical entropy offset is slightly larger for the |rgrgrgrg⟩ quench due to non-unity fidelities both of preparing |r⟩ and mapping |r⟩ → |1⟩. b, Raw global purity after the |gggggggg⟩ quench. The global purity is a sensitive proxy for the fidelity of our entire process. We find this 16-body observable, composed of three-level systems, remains > 100× the purity expected for a fully mixed state of 8 qubits (1/28) (see inset). For comparison of scale we also plot single-particle purity to the 8th power, to indicate what the global purity would be if the measurement results on each twin were uncorrelated. c, Global purity for the 8-atom quench calculated through numerical modeling of the three-level system {|0⟩, |1⟩ ≡ |g⟩, |r⟩} with a variety of simulated error sources. We model the experimentally measured purity by calculating the expectation value of the SWAP operator in the {|0⟩, |1⟩} basis between two independent chains, taking into account that residual population in |r⟩ results in atom loss and measurement associated with the +1 eigenvalue of the SWAP operator (as the twin state |00⟩ can no longer be detected). The top curve includes only errors from population left in |r⟩ following the coherent mapping step (see methods text). The second-from-top curve includes single-site dephasing (T2^(⁎)) during the Rydberg dynamics and the coherent mapping gap, modeled by a random on-site detuning which is Gaussian-distributed with zero mean and standard deviation of 100 kHz. The third and fourth curves include multiplication by the experimentally observed raw global purity at quench time t = 0, and then further multiplying empirically by an exponential decay exp[−16 × t/(70 μs)] as a simple model for scattering and decay errors with an experimentally estimated rate of roughly 70 μs for each of the 16 atoms between the two chains.CC BY · PubMed Central
Extended Data Fig. 10 Local observables and entanglement entropy for quantum many-body scars. a, Experimentally measured single-site entropy for each site in the 8-atom chain when quenching from the scarred |ℤ2⟩ state, including the classical entropy subtraction. Solid curves plot exact, ideal (imperfection-free) numerics of HRyd (Eq. 3); excellent agreement between data and numerics is found for every atom in the chain. b, (Top) Same data as Fig. 4f of the main text, showing single-site entropy of the middle two atoms in the chain, for two different initial states75. (Bottom) Measurements of the many-body state in the Z-basis with the interferometry circuit turned off. Characteristic of the scars from the |ℤ2⟩ = |rgrgrgrg⟩ state, the Rydberg excitation probability on the sublattices exhibits periodic oscillations71. In the bottom row, the dark data points are measured in the {|1⟩, |r⟩} basis, and the faint data points are measured in the {|0⟩, |1⟩} basis after the coherent mapping sequence. Measurements in both bases agree well with exact numerics (solid lines), which we emphasize has no free fit parameters and does not account for any experimental imperfections, such as detection infidelity. Moreover, the data indicate the high fidelity of preparation into the |ℤ2⟩ state by use of local Rydberg π pulses. In plotting, we delay the theory curves and the {|1⟩, |r⟩} basis measurement by 10 ns to account for the fact that the Raman π pulse we apply cuts off the final 10 ns of the Rydberg evolution, when measuring in the {|0⟩, |1⟩} basis. c, Numerical simulations of the single-site Renyi entropy on two adjacent sites in the idealized ‘PXP’ model of perfect nearest-neighbor blockade14. The system size is 24 atoms with periodic boundary conditions, showing the same out-of-phase oscillations in the entanglement entropy of the two sublattices. d, Diagram of the constrained Hilbert space of the system14. The early-time, out-of-phase entropy oscillations75 of the scars can be understood in this constrained Hilbert space picture, where the scar dynamics are known to take the state from the left end (|rgrgrgrg⟩) to the right end (|grgrgrgr⟩) (dark circles represent |r⟩ and white circles represent |g⟩)14. Near these crystalline ends of this constrained Hilbert space, the Rydberg atoms can fluctuate (high entropy), but the ground state atoms are pinned (low entropy). Our analysis shows that entanglement between atoms on the same sublattice contributes to the eventual degradation of the revival fidelity of the |ℤ2⟩ state.
Extended Data Fig. 10 Local observables and entanglement entropy for quantum many-body scars. a, Experimentally measured single-site entropy for each site in the 8-atom chain when quenching from the scarred |ℤ2⟩ state, including the classical entropy subtraction. Solid curves plot exact, ideal (imperfection-free) numerics of HRyd (Eq. 3); excellent agreement between data and numerics is found for every atom in the chain. b, (Top) Same data as Fig. 4f of the main text, showing single-site entropy of the middle two atoms in the chain, for two different initial states75. (Bottom) Measurements of the many-body state in the Z-basis with the interferometry circuit turned off. Characteristic of the scars from the |ℤ2⟩ = |rgrgrgrg⟩ state, the Rydberg excitation probability on the sublattices exhibits periodic oscillations71. In the bottom row, the dark data points are measured in the {|1⟩, |r⟩} basis, and the faint data points are measured in the {|0⟩, |1⟩} basis after the coherent mapping sequence. Measurements in both bases agree well with exact numerics (solid lines), which we emphasize has no free fit parameters and does not account for any experimental imperfections, such as detection infidelity. Moreover, the data indicate the high fidelity of preparation into the |ℤ2⟩ state by use of local Rydberg π pulses. In plotting, we delay the theory curves and the {|1⟩, |r⟩} basis measurement by 10 ns to account for the fact that the Raman π pulse we apply cuts off the final 10 ns of the Rydberg evolution, when measuring in the {|0⟩, |1⟩} basis. c, Numerical simulations of the single-site Renyi entropy on two adjacent sites in the idealized ‘PXP’ model of perfect nearest-neighbor blockade14. The system size is 24 atoms with periodic boundary conditions, showing the same out-of-phase oscillations in the entanglement entropy of the two sublattices. d, Diagram of the constrained Hilbert space of the system14. The early-time, out-of-phase entropy oscillations75 of the scars can be understood in this constrained Hilbert space picture, where the scar dynamics are known to take the state from the left end (|rgrgrgrg⟩) to the right end (|grgrgrgr⟩) (dark circles represent |r⟩ and white circles represent |g⟩)14. Near these crystalline ends of this constrained Hilbert space, the Rydberg atoms can fluctuate (high entropy), but the ground state atoms are pinned (low entropy). Our analysis shows that entanglement between atoms on the same sublattice contributes to the eventual degradation of the revival fidelity of the |ℤ2⟩ state.CC BY · PubMed Central

Verification

Claims the paper makes

The claims and statistics of this paper haven’t been checked yet.

Free: it reads the open-access text and checks the first 5 claims that cite a source we can check. Create a free account to check every claim.

A few free checks a day · papers already verified open instantly · results are public

Claims other papers make about this one

Each is checked against this paper’s own text: does it say what the citing paper says it does?

18 more claims about this paper

Create a free account to see every claim other papers make about this one.

See all claims — free account

Self-check

Percentages, sums and reported differences re-computed from the paper’s own numbers.

The self-check needs the paper’s full text.

Citations

Cites

Show all 83 references

Research works printed but not linked: 2

  1. Gullion, T., Baker, D. B. & Conradi, M. S. New, compensated Carr–Purcell sequences. J. Magn. Reson. 89, 479–484 (1990).
  2. Hein, M. et al. Entanglement in graph states and its applications. In Proc. International School of Physics “Enrico Fermi” (eds Casati, G. et al.) Vol. 162, 115–218 (IOS Press, 2006).

Cited by

See all 25

Metadata

Authors
Bluvstein, D., Levine, H., Semeghini, G., Wang, T. T., Ebadi, S., Kalinowski, M., Keesling, A., Maskara, N., Pichler, H., Greiner, M., Vuletić, V., & Lukin, M. D.
Affiliations
  • Harvard University (US)
  • Austrian Academy of Sciences (AT)
  • Massachusetts Institute of Technology (US)
Corresponding author
Lukin, Mikhail D.
Venue
Nature
Published
2022-04-20
Volume
604
Issue
7906
Pages
451-456
ISSN
  • 0028-0836 (ISSN-L)
  • 1476-4687
OpenAlex
W4200629850
Cited by
14
References
80
Citations by year
2026: 1 · 2025: 2 · 2024: 5 · 2023: 6
FWCI
1.33
Type
journal article
Language
en
Open access
Licence
Locations
  • Nature (publishedVersion, cc-by)
  • PubMed Central (publishedVersion, cc-by)
  • PubMed (publishedVersion)
  • arXiv (Cornell University) (submittedVersion)
  • RePEc: Research Papers in Economics (submittedVersion)
  • DSpace@MIT (Massachusetts Institute of Technology) (submittedVersion, cc-by-nc)
  • OSTI OAI (U.S. Department of Energy Office of Scientific and Technical Information) (submittedVersion)
  • arXiv (Cornell University)
Funders
  • National Science Foundation (1745303, W911NF-20-1-0082)
  • U.S. Department of Energy (DESC0021013, DESC0021110, 7568717)
  • Hertz Foundation
  • Defense Advanced Research Projects Agency (W911NF2010021)
  • National Defense Science and Engineering Graduate
  • Multidisciplinary University Research Initiative (W911NF2010082)
  • Center for Ultracold Atoms, Massachusetts Institute of Technology
  • Office of Naval Research
  • Army Research Office (W911NF-21-1-, W911NF-20-1-0082, W911NF-21-1-0367, W911NF)
Topics
  • Physical Sciences › Physics and Astronomy › Atomic and Molecular Physics, and Optics › Cold Atom Physics and Bose-Einstein Condensates
  • Physical Sciences › Physics and Astronomy › Atomic and Molecular Physics, and Optics › Quantum Information and Cryptography
  • Physical Sciences › Computer Science › Artificial Intelligence › Quantum Computing Algorithms and Architecture
Keywords
quantum processors, coherent transport, optical tweezers, hyperfine qubits, cluster states, Steane code, surface code, toric code, entanglement entropy, quantum many-body scars, scalable quantum computing

About these checks

Registry, retraction, Cites and statistics results are computed, not judged, with one exception: a printed reference that no index lists is read once by a model before it counts as a citation error. Claims are extracted by a model and kept only when their quote appears verbatim in the text; each cited source is then checked, with a model’s help, for whether it says what the claim relies on. Those verdicts can be wrong — read the claim’s quote and the cited source before relying on one.

Statistics and arithmetic are recomputed, not judged.

Confidence bands are shown only for fields calibrated on our annotated test set. None is calibrated yet, so no band is shown.

What counts as a claim ›How we measure confidence ›How we check this ›

Are you an author, or do you see a problem with this page? Request a review

How to cite

Cite CoChat for the checks on this page, and the paper for its own findings.

This page
CoChat. (2026). Citation check: A quantum processor based on coherent transport of entangled atom arrays. https://app.cochat.ai/papers/10.1038/s41586-022-04592-6
The paper
Bluvstein, D., Levine, H., Semeghini, G., Wang, T. T., Ebadi, S., Kalinowski, M., Keesling, A., Maskara, N., Pichler, H., Greiner, M., Vuletić, V., & Lukin, M. D. (2022). A quantum processor based on coherent transport of entangled atom arrays. Nature. https://doi.org/10.1038/s41586-022-04592-6

Data sources

Bibliographic data: Semantic Scholar, OpenAlex, Crossref.

Contains information from the Semantic Scholar Academic Graph Datasets, made available under the ODC Attribution License (ODC-BY 1.0).

Semantic Scholar’s data is described in: Kinney, R., et al. (2023). The Semantic Scholar Open Data Platform. arXiv:2301.10140.