

The DOI matches its Crossref record; 62 of the 62 references it cites were found in a registry or an index.
Microbial peptides activate tumour-infiltrating lymphocytes in glioblastoma
Open accessAbstract
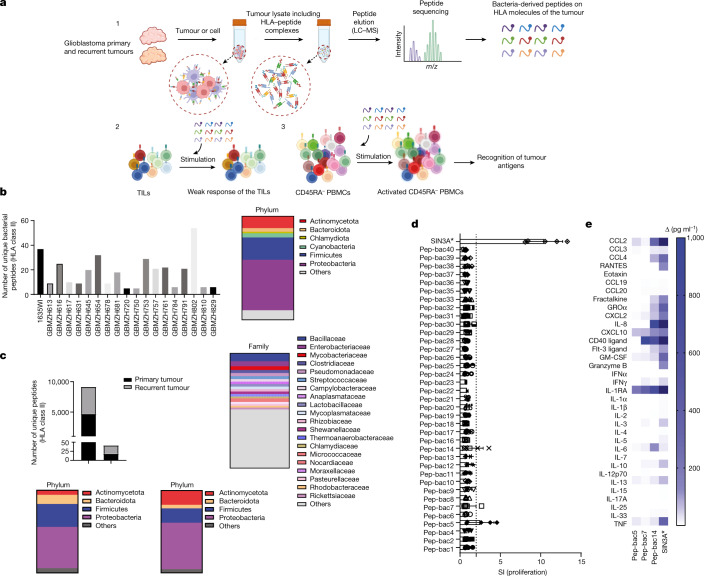
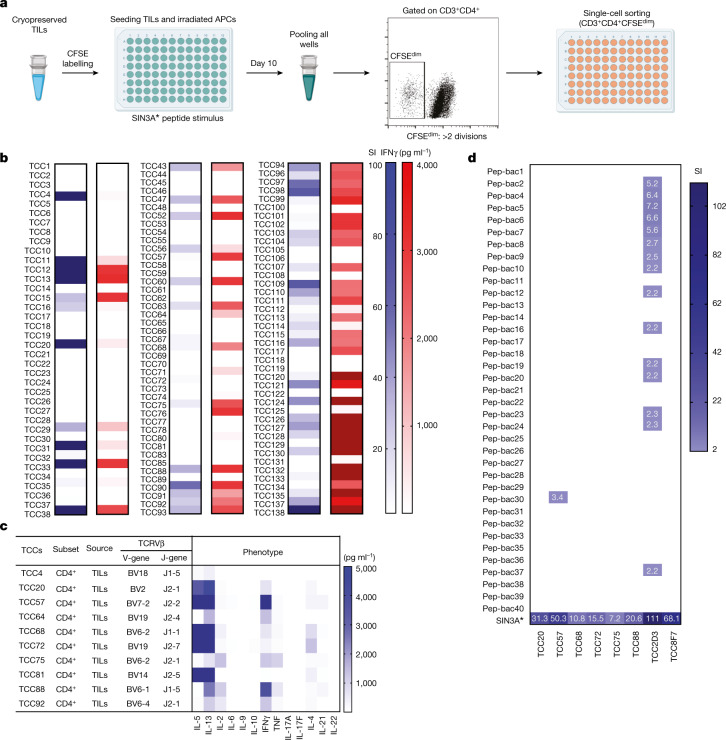
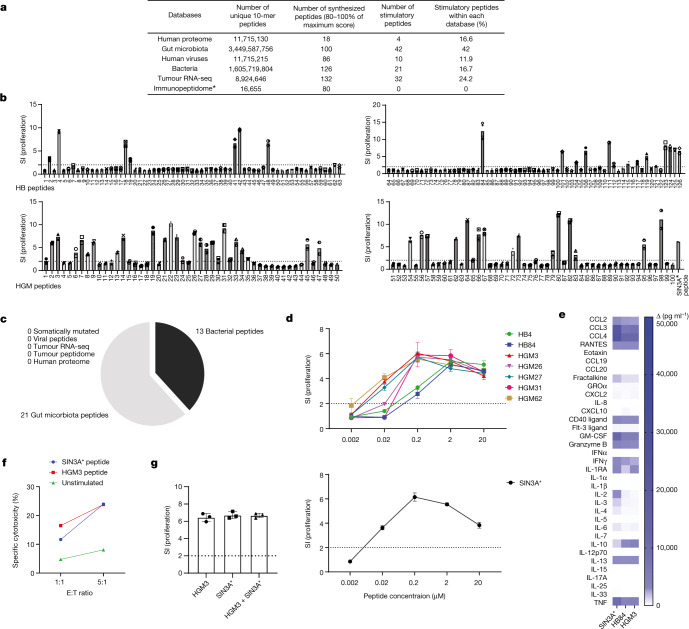
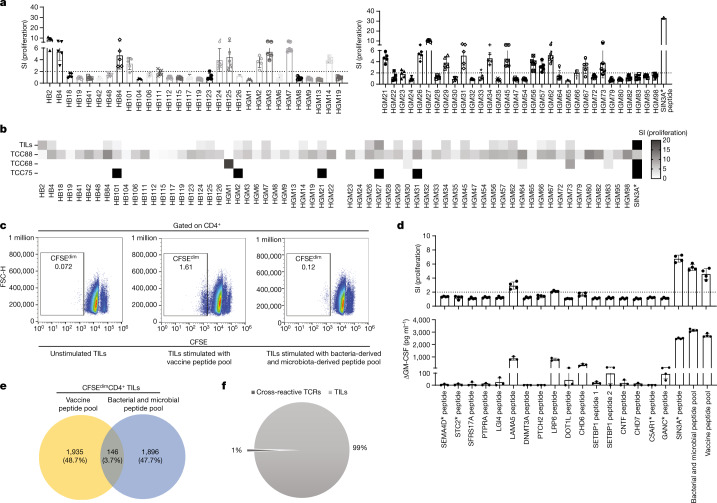
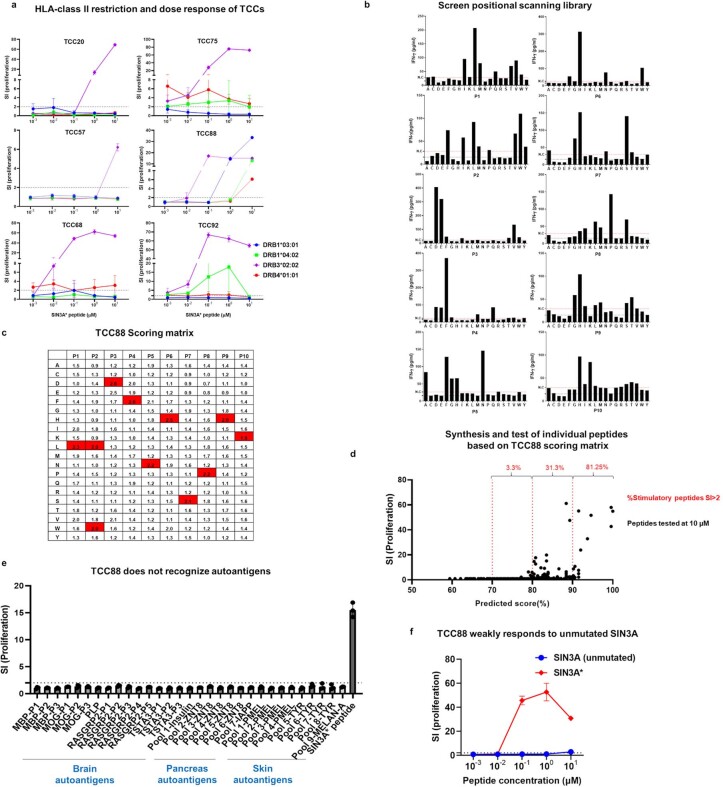
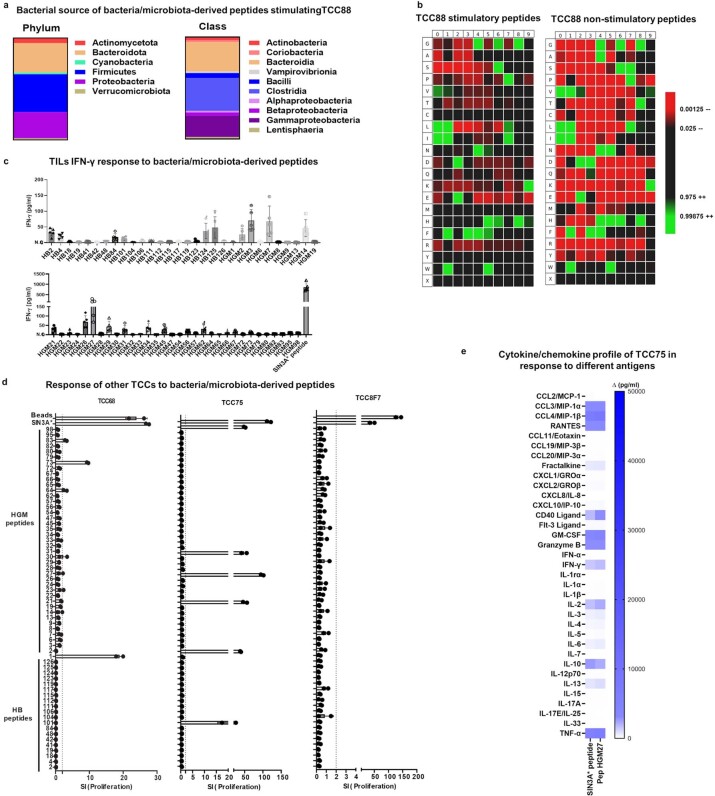
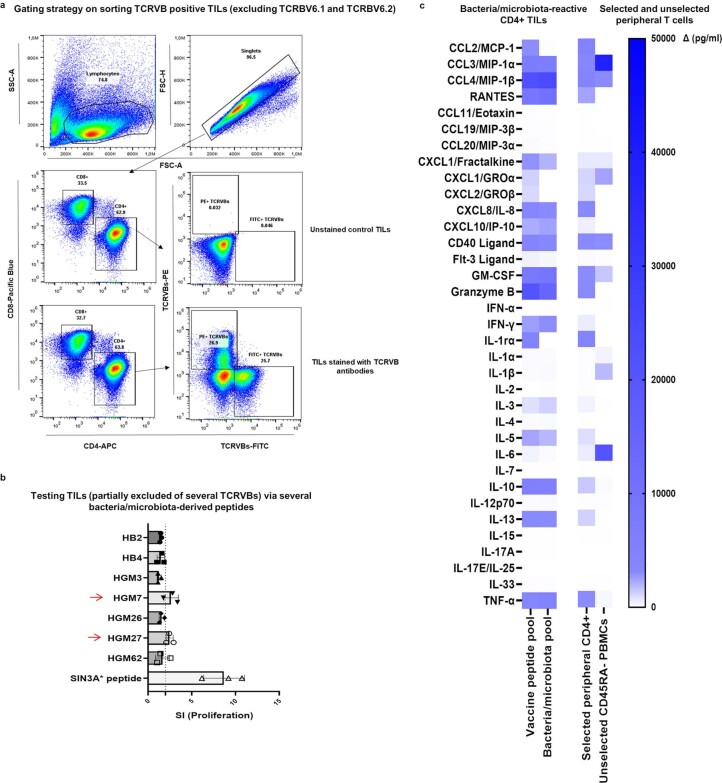
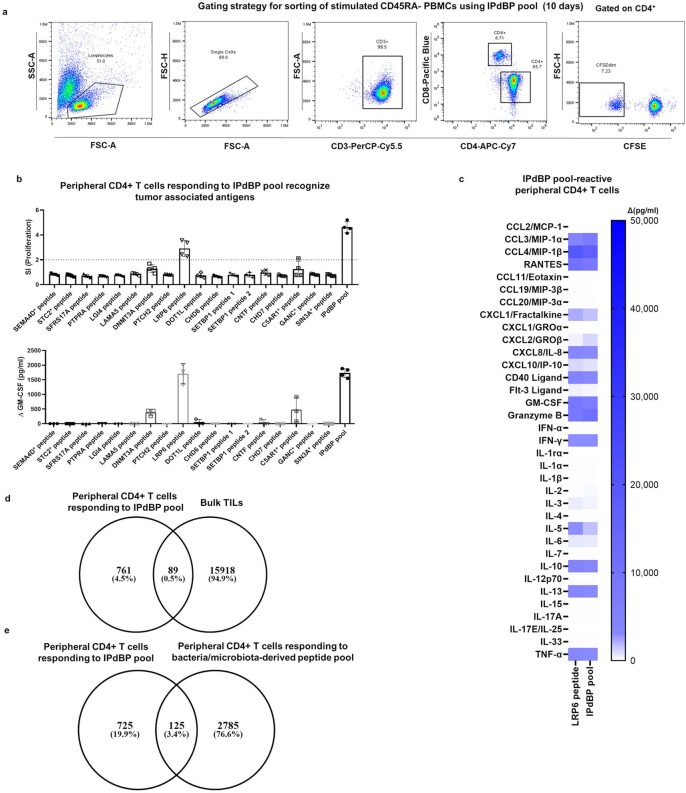
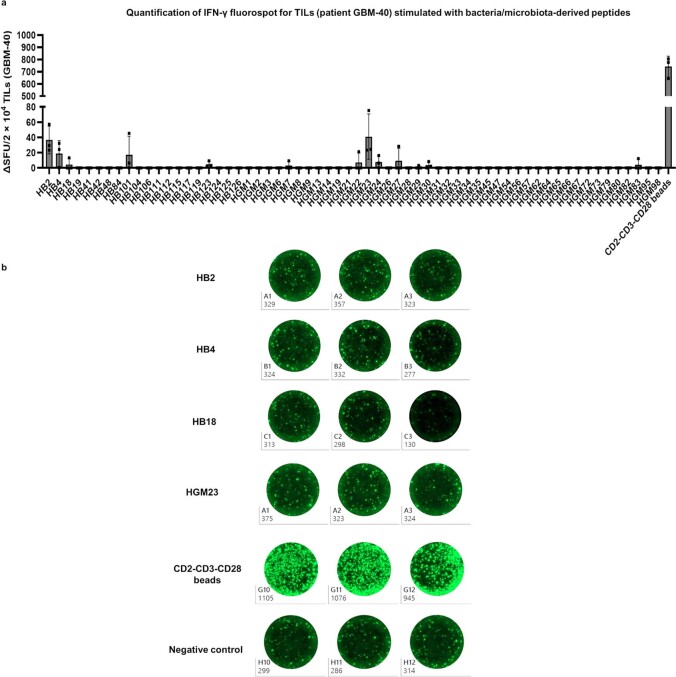
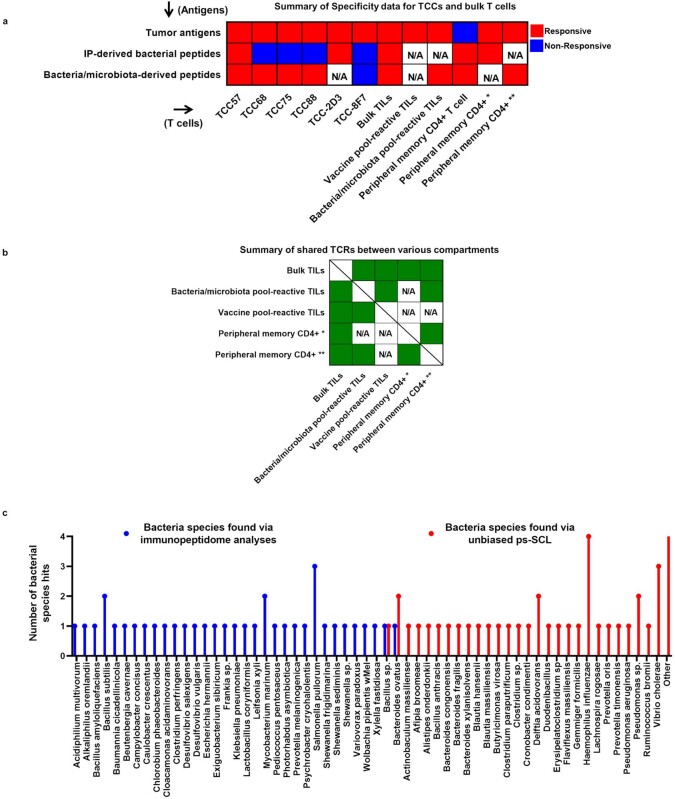
Abstract Microbial organisms have key roles in numerous physiological processes in the human body and have recently been shown to modify the response to immune checkpoint inhibitors1,2. Here we aim to address the role of microbial organisms and their potential role in immune reactivity against glioblastoma. We demonstrate that HLA molecules of both glioblastoma tissues and tumour cell lines present bacteria-specific peptides. This finding prompted us to examine whether tumour-infiltrating lymphocytes (TILs) recognize tumour-derived bacterial peptides. Bacterial peptides eluted from HLA class II molecules are recognized by TILs, albeit very weakly. Using an unbiased antigen discovery approach to probe the specificity of a TIL CD4+ T cell clone, we show that it recognizes a broad spectrum of peptides from pathogenic bacteria, commensal gut microbiota and also glioblastoma-related tumour antigens. These peptides were also strongly stimulatory for bulk TILs and peripheral blood memory cells, which then respond to tumour-derived target peptides. Our data hint at how bacterial pathogens and bacterial gut microbiota can be involved in specific immune recognition of tumour antigens. The unbiased identification of microbial target antigens for TILs holds promise for future personalized tumour vaccination approaches.
Overview
The claims and statistics of this paper haven’t been checked yet.
Run the check — free, no account needed. It reads the open-access text and checks the sources it cites.
Integrity signals
Registry
Cites
Statistics
Figures
Verification
Claims the paper makes
The claims and statistics of this paper haven’t been checked yet.
Run the check — free, no account needed. It reads the open-access text and checks the sources it cites.
Claims other papers make about this one
Each is checked against this paper’s own text: does it say what the citing paper says it does?
In the citing paper
“Moreover, the gut microbiome’s vast antigen reservoir may facilitate cross-reactivity between bacterial and tumor antigens, thereby enhancing antitumor immune responses (Fluckiger et al., 2020; Naghavian et al., 2023).”
From Microbiota-centered interventions to boost immune checkpoint blockade therapies (2025) · cites this paper as Naghavian et al., 2023
Self-check
Percentages, sums and reported differences re-computed from the paper’s own numbers.
The self-check needs the paper’s full text.
Citations
Cites
Search and clustering orders of magnitude faster than BLAST
Edgar, R. C. (2010) · Bioinformatics · doi:10.1093/bioinformatics/btq461 · Cited by 21,098
Pérez-Riverol, Y., Csordas, A., Bai, J.-W., Bernal-Llinares, M., Hewapathirana, S., Kundu, D. J., Inuganti, A., Griss, J., Mayer, G., Eisenacher, M., et al. (2018) · Nucleic Acids Res. · doi:10.1093/nar/gky1106 · Cited by 6,216
Gut microbiome influences efficacy of PD-1-based immunotherapy against epithelial tumors
Routy, B., Le Chatelier, E., Derosa, L., Duong, C. P. M., Alou, M. T., Daillère, R., Fluckiger, A., Messaoudene, M., Rauber, C., Roberti, M. P., et al. (2018) · Science · doi:10.1126/science.aan3706 · Cited by 5,671 · cited 2×
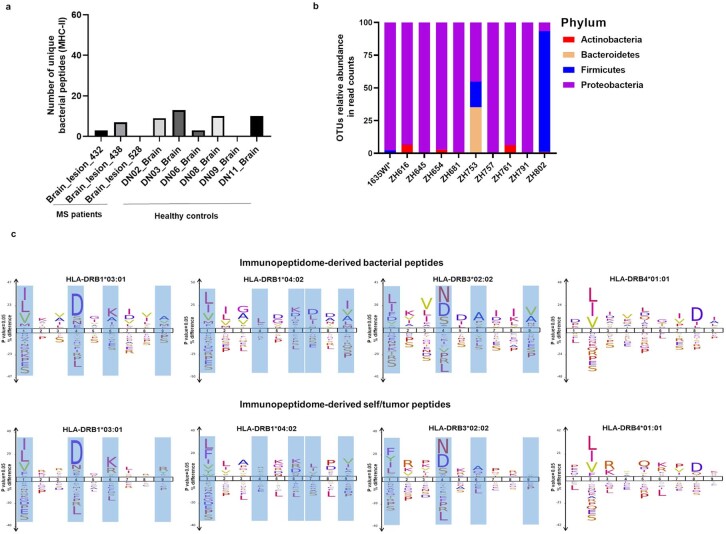
“a, Schematic of the immunopeptidome analyses of glioblastoma tissue, from which eluted peptides were annotated using the UniProt bacteria database (1).”
MethodResultGut microbiome modulates response to anti-PD-1 immunotherapy in melanoma patients
Gopalakrishnan, V., Spencer, C. N., Nezi, L., Reuben, A., Andrews, M. C., Karpinets, T. V., Prieto, P. A., Vicente, D., Hoffman, K., Wei, S. C., et al. (2018) · Science · doi:10.1126/science.aan4236 · Cited by 4,812
Ribosomal Database Project: data and tools for high throughput rRNA analysis
Cole, J. R., Wang, Q., Fish, J. A., Chai, B., McGarrell, D. M., Sun, Y., Brown, C. T., Porras‐Alfaro, A., Kuske, C. R., & Tiedje, J. M. (2013) · Nucleic Acids Research · doi:10.1093/nar/gkt1244 · Cited by 4,480
Cancer immunotherapy comes of age
Mellman, I., Coukos, G., & Dranoff, G. (2011) · Nature · doi:10.1038/nature10673 · Cited by 3,893
IFN-γ–related mRNA profile predicts clinical response to PD-1 blockade
Ayers, M., Lunceford, J., Nebozhyn, M., Murphy, E., Loboda, A., Kaufman, D. R., Albright, A., Cheng, J. D., Kang, S. P., Shankaran, V., et al. (2017) · Journal of Clinical Investigation · doi:10.1172/jci91190 · Cited by 3,788
Anticancer immunotherapy by CTLA-4 blockade relies on the gut microbiota
Vétizou, M., Pitt, J. M., Daillère, R., Lepage, P., Waldschmitt, N., Flament, C., Rusakiewicz, S., Routy, B., Roberti, M. P., Duong, C. P. M., et al. (2015) · Science · doi:10.1126/science.aad1329 · Cited by 3,488 · cited 1×
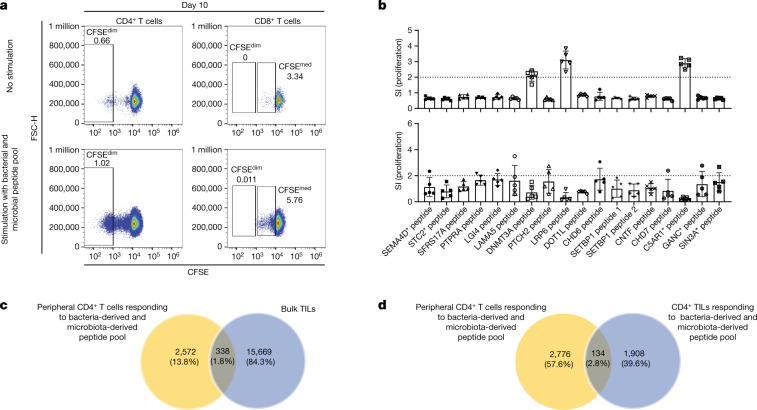
“These data show that (1) T cells with reactivity against bacterial peptides that are presented on HLA class II molecules, that is, the immunopeptidome, within the tumour exist in the peripheral blood, (2) memory T cells that recognize bacteria and microbiota that had been identified by analysing a tumour neoantigen-re…”
ResultThe commensal microbiome is associated with anti-PD-1 efficacy in metastatic melanoma patients
Matson, V., Fessler, J., Bao, R., Chongsuwat, T., Zha, Y., Alegre, M.-L., Luke, J. J., & Gajewski, T. F. (2018) · Science · doi:10.1126/science.aao3290 · Cited by 3,107
An immunogenic personal neoantigen vaccine for patients with melanoma
Ott, P. A., Hu, Z., Keskin, D. B., Shukla, S. A., Sun, J., Bozym, D. J., Zhang, W., Luoma, A., Giobbie-Hurder, A., Peter, L., et al. (2017) · Nature · doi:10.1038/nature22991 · Cited by 2,936
Cited by
Sorted by citations
Lin, H., Liu, C., Hu, A.-K., Zhang, D., Yang, H., & Mao, Y. Q. (2024) · Journal of Hematology & Oncology · doi:10.1186/s13045-024-01544-7 · Cited by 462
Cancer organoids 2.0: modelling the complexity of the tumour immune microenvironment
Polak, R., Zhang, E., & Kuo, C. J. (2024) · Nature reviews. Cancer · doi:10.1038/s41568-024-00706-6 · Cited by 347
Probiotic neoantigen delivery vectors for precision cancer immunotherapy
Redenti, A., Im, J., Redenti, B. J., Li, F., Rouanne, M., Sheng, Z., Sun, W. Y., Gurbatri, C. R., Huang, S., Komaranchath, M., et al. (2024) · Nature · doi:10.1038/s41586-024-08033-4 · Cited by 216
Gut microbiota shapes cancer immunotherapy responses
Lei, W., Zhou, K., Lei, Y., Li, Q., & Zhu, H. (2025) · npj Biofilms and Microbiomes · doi:10.1038/s41522-025-00786-8 · Cited by 182
Role of the microbiota in response to and recovery from cancer therapy
Blake, S. J., Wolf, Y., Boursi, B., & Lynn, D. J. (2023) · Nature reviews. Immunology · doi:10.1038/s41577-023-00951-0 · Cited by 151
Intracellular bacteria in cancer—prospects and debates
Schorr, L., Mathies, M., Elinav, E., & Puschhof, J. (2023) · npj Biofilms and Microbiomes · doi:10.1038/s41522-023-00446-9 · Cited by 116
Targeting endothelial permeability in the EPR effect
Lahooti, B., Akwii, R. G., Zahra, F. T., Sajib, M. S., Λάμπρου, Μ., Alobaida, A., Lionakis, M. S., Mattheolabakis, G., & Mikelis, C. M. (2023) · Journal of Controlled Release · doi:10.1016/j.jconrel.2023.07.039 · Cited by 114
Glioblastoma vaccines: past, present, and opportunities
Xiong, Z., Raphael, I., Olin, M. R., Okada, H., Li, X., & Kohanbash, G. (2024) · EBioMedicine · doi:10.1016/j.ebiom.2023.104963 · Cited by 97
Melanoma and microbiota: Current understanding and future directions
Routy, B., Jackson, T., Mählmann, L., Baumgartner, C. K., Blaser, M., Byrd, A., Corvaia, N., Couts, K., Davar, D., Derosa, L., et al. (2024) · Cancer Cell · doi:10.1016/j.ccell.2023.12.003 · Cited by 89
Hypoxia within the glioblastoma tumor microenvironment: a master saboteur of novel treatments
Feldman, L. A. (2024) · Frontiers in Immunology · doi:10.3389/fimmu.2024.1384249 · Cited by 97
Prediction of tumor-reactive T cell receptors from scRNA-seq data for personalized T cell therapy
Tan, C. L., Lindner, K. A. M., Boschert, T., Meng, Z., Rodriguez-Ehrenfried, A., Roia, A. D., Haltenhof, G., Faenza, A., Imperatore, F., Bunse, L., et al. (2024) · Nature Biotechnology · doi:10.1038/s41587-024-02161-y · Cited by 94
Navigating established and emerging biomarkers for immune checkpoint inhibitor therapy
Wang, S. L., & Chan, T. A.-T. (2025) · Cancer Cell · doi:10.1016/j.ccell.2025.03.006 · Cited by 80
Broadening oncological boundaries: the intratumoral microbiota
Lu, Y.-Q., Qiao, H., Tan, X.-R., & Liu, N. (2024) · Trends in Microbiology · doi:10.1016/j.tim.2024.01.007 · Cited by 66
Stimulation of tumoricidal immunity via bacteriotherapy inhibits glioblastoma relapse
Zhang, Y., Xi, K., Fu, Z., Zhang, Y., Cheng, B., Feng, F., Dong, Y., Fang, Z., Zhang, Y., Shen, J., et al. (2024) · Nature Communications · doi:10.1038/s41467-024-48606-5 · Cited by 65
Cytotoxic CD4+ T cells in chronic viral infections and cancer
Malyshkina, A., Brüggemann, A., Paschen, A., & Dittmer, U. (2023) · Frontiers in Immunology · doi:10.3389/fimmu.2023.1271236 · Cited by 56
Golikova, E., Alshevskaya, A., Alrhmoun, S., Sivitskaya, N. A., & Sennikov, S. V. (2024) · Journal of Translational Medicine · doi:10.1186/s12967-024-05703-9 · Cited by 50
The impact of the gut microbiome on tumor immunotherapy: from mechanism to application strategies
Guo, C., Kong, L., Xiao, L., Liu, K., Cui, H., Xin, Q., Gu, X., Jiang, C., & Wu, J. (2023) · Cell & Bioscience · doi:10.1186/s13578-023-01135-y · Cited by 48
Zhu, B., Bai, Y., Yeo, Y. Y., Lu, X., Rovira‐Clavé, X., Chen, H. M., Yeung, J., Nkosi, D., Glickman, J. N., Delgado‐González, A., et al. (2025) · Nature Communications · doi:10.1038/s41467-025-56237-7 · Cited by 55
Cai, Y., Gong, M., Zeng, M., Leng, F., Lv, D., Guo, J., Wang, H., Li, Y., Lin, Q., Jing, J., et al. (2025) · Science Advances · doi:10.1126/sciadv.adv6445 · Cited by 46
Pan-cancer atlas of tumor-resident microbiome, immunity and prognosis
Sheng, D., Jin, C., Yue, K., Yue, M., Liang, Y., Xue, X., Li, P., Zhao, G., & Zhang, L. (2024) · Cancer Letters · doi:10.1016/j.canlet.2024.217077 · Cited by 46
Zeng, C., Zhang, C., He, C., & Song, H. (2023) · BMC Genomics · doi:10.1186/s12864-023-09885-2 · Cited by 43
Exploring the gut microbiota and its potential as a biomarker in gliomas
Aljarrah, D., Chalour, N., Zorgani, A., Nissan, T. A., & Pranjol, M. Z. I. (2024) · Biomedicine & Pharmacotherapy · doi:10.1016/j.biopha.2024.116420 · Cited by 40
Endotoxin-Free Outer Membrane Vesicles for Safe and Modular Anticancer Immunotherapy
Chen, M.-Y., Cheng, T.-W., Pan, Y., Mou, C., Chiang, Y., Lin, W., Hu, C. J., & Mou, Y. (2025) · ACS Synthetic Biology · doi:10.1021/acssynbio.4c00483 · Cited by 41
Microbiota-mediated mechanisms of mucosal immunity across the lifespan
Iliev, I. D., Blander, J. M., Collins, N., Guo, C., Longman, R., Sonnenberg, G. F., Zeng, M. Y., & Artis, D. (2025) · Nature Immunology · doi:10.1038/s41590-025-02281-w · Cited by 55
Therapeutic approaches to modulate the immune microenvironment in gliomas
Sarantopoulos, A., Ene, C., & Aquilanti, E. (2024) · npj Precision Oncology · doi:10.1038/s41698-024-00717-4 · Cited by 36
Multi-omics analysis reveals the interplay between intratumoral bacteria and glioma
Li, T., Zhao, Z., Peng, M., Zhang, L., Wang, C., Luo, F., Zeng, M., Sun, K., Fang, Z., Luo, Y., et al. (2024) · mSystems · doi:10.1128/msystems.00457-24 · Cited by 36
Self-citationMicrobial signals in primary and metastatic brain tumors
Morad, G., Damania, A. V., Melendez, B., Singh, B. B., Veguilla, F. J., Soto, R. A., Hoballah, Y. M., Sahasrabhojane, P. V., Wong, M. C., Ahmed, M. M., et al. (2025) · Nature Medicine · doi:10.1038/s41591-025-03957-4 · Cited by 40
Gut microbiota: A double-edged sword in immune checkpoint blockade immunotherapy against tumors
Wang, J., Zhu, N., Su, L., & Yang, R. (2023) · Cancer Letters · doi:10.1016/j.canlet.2023.216582 · Cited by 35
Self-citationLiao, K., Wen, J., Liu, Z., Zhang, B., Zhang, X., Fu, Y., Zhang, W., Hu, H., Ai, K., Zhu, W., et al. (2025) · Ageing Research Reviews · doi:10.1016/j.arr.2025.102820 · Cited by 34
The multifaceted roles of Akkermansia muciniphila in neurological disorders
Ma, X., Liu, Q., & Yang, G. (2025) · Trends in Neurosciences · doi:10.1016/j.tins.2025.04.004 · Cited by 36
A polyvalent vaccine for selectively killing tumor-associated bacteria to prevent cancer metastasis
Kang, Z., Chen, L., Li, P., Zheng, Z., Shen, J., Xiao, Z., Yu, M., Yang, Y., & Chen, Q. (2025) · Science Advances · doi:10.1126/sciadv.adt0341 · Cited by 30
Zhu, X., Zhang, X., Guo, J., He, L., Wang, F., Qiu, Z., Li, A., Zhang, J., Gao, F., & Li, W. (2024) · Small · doi:10.1002/smll.202401655 · Cited by 27
Intratumoral Microbiome: Foe or Friend in Reshaping the Tumor Microenvironment Landscape?
Kyriazi, A. A., Karaglani, M., Agelaki, S., & Baritaki, S. (2024) · Cells · doi:10.3390/cells13151279 · Cited by 27
Role of gut microbiota in regulating immune checkpoint inhibitor therapy for glioblastoma
Zhang, H., Hong, Y., Wu, T., Ben, E., Li, S., Hu, L., & Xie, T. (2024) · Frontiers in Immunology · doi:10.3389/fimmu.2024.1401967 · Cited by 27
The immunology of brain tumors
Bunse, L., Bunse, T., Kilian, M., Quintana, F. J., & Platten, M. (2025) · Science Immunology · doi:10.1126/sciimmunol.ads0449 · Cited by 28
Huang, J., Gong, C., & Zhou, A. (2023) · Therapeutic Advances in Medical Oncology · doi:10.1177/17588359231204854 · Cited by 30
Gut Microbiota–Related Biomarkers in Immuno-Oncology
Silva, C. A. C., Fidelle, M., Almonte, A. A., Derosa, L., & Zitvogel, L. (2025) · Annual Review of Pharmacology and Toxicology · doi:10.1146/annurev-pharmtox-061124-102218 · Cited by 22
Cancer microbiota: a focus on tumor-resident bacteria
Vella, G., & Rescigno, M. (2025) · EMBO Reports · doi:10.1038/s44319-025-00482-w · Cited by 25
Microbiota and glioma: a new perspective from association to clinical translation
Wang, W., Ou, Z., Huang, X., Wang, J., Li, Q., Wen, M., & Zheng, L. (2024) · Gut Microbes · doi:10.1080/19490976.2024.2394166 · Cited by 23
Self-citationExploring effects of gut microbiota on tertiary lymphoid structure formation for tumor immunotherapy
Liu, Y., Li, F., Wang, J., & Yang, R. (2025) · Frontiers in Immunology · doi:10.3389/fimmu.2024.1518779 · Cited by 22
Self-citationMicrobial modulation as a game changer: Boosting immunotherapy efficacy in breast cancer
Xia, F., Yi, Q., Xu, Z., Zhou, Z., Tang, H., Zhang, K., & Yan, Y. (2025) · Seminars in Cancer Biology · doi:10.1016/j.semcancer.2025.10.006 · Cited by 24
Ma, X., Zhang, J., Jiang, Q., Li, Y., & Yang, G. (2024) · EBioMedicine · doi:10.1016/j.ebiom.2024.105516 · Cited by 20
Microbiota-centered interventions to boost immune checkpoint blockade therapies
Almonte, A. A., Thomas, S., & Zitvogel, L. (2025) · Journal of Experimental Medicine · doi:10.1084/jem.20250378 · Cited by 19
The war between the immune system and the tumor - using immune biomarkers as tracers
Yang, K., Lu, R., Mei, J., Cao, K., Zeng, T., Hua, Y., Huang, X., Li, W., & Yin, Y. (2024) · Biomarker Research · doi:10.1186/s40364-024-00599-5 · Cited by 22
Totter, E., von Einsiedel, E., Regazzoni, L., & Schuerle, S. (2025) · Advanced Drug Delivery Reviews · doi:10.1016/j.addr.2025.115577 · Cited by 20
Cytotoxic CD4+ T cells: origin, biological functions, diseases and therapeutic targets
Lai, L., Ran, S., Li, Y., Cui, J., Zhang, X., Yu, J., Zou, Y., Cheng, Z., Xia, J., & Wu, J. (2026) · Signal Transduction and Targeted Therapy · doi:10.1038/s41392-025-02533-z · Cited by 24
Krawczyk, A. E., Sladowska, G. E., & Strzałka‐Mrozik, B. (2025) · Cancers · doi:10.3390/cancers17050719 · Cited by 17
Modulation of the Immune Environment in Glioblastoma by the Gut Microbiota
Green, G. B. H., Cox-Holmes, A. N., Potier, A. C. E., Marlow, G. H., & McFarland, B. C. (2024) · Biomedicines · doi:10.3390/biomedicines12112429 · Cited by 16
Neoantigens in cancer immunotherapy: quantity vs. quality
Wolf, Y., & Samuels, Y. (2023) · Molecular Oncology · doi:10.1002/1878-0261.13483 · Cited by 16
Huang, X., Chen, X., Wan, G., Yang, D., Zhu, D., Jia, L., & Zheng, J. (2024) · BMC Cancer · doi:10.1186/s12885-024-11982-8 · Cited by 15
Oncolytic Therapies for Glioblastoma: Advances, Challenges, and Future Perspectives
Alomarı, O., Eyvazova, H., Güney, B., Juhmani, R. A., Odabaş, H., Al-Rawabdeh, L., Mokresh, M. E., Erginoğlu, U., Keleş, A., & Başkaya, M. K. (2025) · Cancers · doi:10.3390/cancers17152550 · Cited by 14
Personalized Cancer Vaccines: Current Advances and Emerging Horizons
Lu, L., Lu, X., & Luo, W. (2025) · Vaccines · doi:10.3390/vaccines13121231 · Cited by 15
The Role of Bacteria in Central Nervous System Tumors: Opportunities and Challenges
Zhang, R., Li, X., & Zhang, S. (2024) · Microorganisms · doi:10.3390/microorganisms12061053 · Cited by 13
Gigi, E., Gavert, N. S., Raijman-Nagar, L., Zwang, Y., Zemach, H., Livyatan, I., Levy‐Barda, A., Laviv, Y., Kanner, A. A., Benouaich‐Amiel, A., et al. (2025) · Nature Cancer · doi:10.1038/s43018-025-01073-3 · Cited by 12
Microbiome modulation of antigen presentation in tolerance and inflammation
He, Y., Mohapatra, G., Asokan, S., Nobs, S. P., & Elinav, E. (2024) · Current Opinion in Immunology · doi:10.1016/j.coi.2024.102471 · Cited by 13
The Role of Gut Microbiome on Glioblastoma Oncogenesis and Malignant Evolution
Mohamed, Z. S., Wu, Q., Jacome, M. A., Chen, J., & Etame, A. B. (2025) · International Journal of Molecular Sciences · doi:10.3390/ijms26072935 · Cited by 14
Li, W., Chen, Q., Fan, J., Han, Z., Song, W., Zeng, X., & Zhang, X. (2024) · Advanced Materials · doi:10.1002/adma.202402532 · Cited by 13
Yao, P., Gao, M., Hu, W., Wang, J., Wang, Y., Wang, Q., & Ji, J. (2024) · Pharmacological Research · doi:10.1016/j.phrs.2024.107209 · Cited by 11
Self-citationMicrobes in the tumor microenvironment: New additions to break the tumor immunotherapy dilemma
Zhou, L., Fan, S., Zhang, W., Wang, D., & Tang, D. (2024) · Microbiological Research · doi:10.1016/j.micres.2024.127777 · Cited by 12
Therapeutic Targeting of Glioblastoma and the Interactions with Its Microenvironment
Genoud, V., Kinnersley, B., Brown, N. F., Ottaviani, D., & Mulholland, P. J. (2023) · Cancers · doi:10.3390/cancers15245790 · Cited by 10
Cui, T., Chen, S., Liu, S., Niu, X., Wang, J., Ao, R., Cai, H., Huang, H., Yu, M., Peng, S., et al. (2025) · Nature Nanotechnology · doi:10.1038/s41565-025-02064-2 · Cited by 10
Self-citationMicroEpitope: an atlas of immune epitopes derived from cancer microbiomes
Li, D., Cai, Y., Liu, K., Lv, D., Zeng, M., Wen, L., Lv, C., Guo, J., Xu, K., Ding, N., et al. (2024) · Nucleic Acids Research · doi:10.1093/nar/gkae877 · Cited by 10
Jaeghere, E. A. D., Hamerlinck, H., Tuyaerts, S., Lippens, L., Nuffel, A. M. T. V., Baiden-Amissah, R. E. M., Vuylsteke, P., Henry, S., Trinh, X. B., van Dam, P. A., et al. (2024) · Gynecologic Oncology · doi:10.1016/j.ygyno.2024.10.020 · Cited by 10
Wu, C., Luo, F., Zhu, Y., Liu, C., Chen, Z., Wang, X., Tan, J., & Liu, Q. (2025) · Exploration · doi:10.1002/exp.20240087 · Cited by 11
From Gut to Brain: The Impact of Short-Chain Fatty Acids on Brain Cancer
Saadh, M. J., Allela, O. Q. B., Kareem, R. A., Sanghvi, G. V., Menon, S. V., Sharma, P., Tomar, B. S., Sharma, A., Sameer, H. N., Hamad, A. K., et al. (2025) · NeuroMolecular Medicine · doi:10.1007/s12017-025-08830-8 · Cited by 9
Gut reactions: harnessing microbial metabolism to fuel next-generation cancer immunotherapy
Almonte, A. A., & Zitvogel, L. (2025) · Journal for ImmunoTherapy of Cancer · doi:10.1136/jitc-2025-011540 · Cited by 9
Strategic Advances in Targeted Delivery Carriers for Therapeutic Cancer Vaccines
Wu, J., Liang, J., Zhang, Y., Dong, C., Tan, D., Wang, H., Zheng, Y., & He, Q. (2025) · International Journal of Molecular Sciences · doi:10.3390/ijms26146879 · Cited by 9
Molecular mimicry as a driver of T cell-mediated tumour immunity
Rossjohn, J., Nezi, L., Walz, J. S., Tagliamonte, M., & Buonaguro, L. (2025) · Trends in Immunology · doi:10.1016/j.it.2025.07.012 · Cited by 10
Self-citationYeo, K. K. L., Li, R., Wu, F., Bouras, G. S., H., L., Smith, E., Wormald, P., Valentine, R. J., Psaltis, A. J., Vreugde, S., et al. (2024) · Journal of Medical Microbiology · doi:10.1099/jmm.0.001799 · Cited by 10
Surgical site infections after glioblastoma surgery: boon or bane?
Hounchonou, H. F., Bajgora, G., Esmaeilzadeh, M., Hartmann, C. J., & Krauss, J. K. (2024) · Journal of Cancer Research and Clinical Oncology · doi:10.1007/s00432-023-05528-x · Cited by 8
Yu, J., Meng, S., Xuan, T., Wang, Z., Qu, L., Cao, F., & Li, J. (2024) · Discover Oncology · doi:10.1007/s12672-024-01359-5 · Cited by 7
Vaccine therapies for glioma: clinical frontiers and potential breakthrough
Xing, Y., Liu, C., Feng, Y., Li, S., & Chen, Y. (2025) · Frontiers in Oncology · doi:10.3389/fonc.2025.1613332 · Cited by 9
Zhao, K., Huang, Y., Chang, L., Wang, B., Ye, M., & Qi, J. (2025) · Frontiers in Oncology · doi:10.3389/fonc.2025.1691719 · Cited by 8
Yang, J., Dai, Y., & Li, J. (2026) · Oncology Reviews · doi:10.3389/or.2025.1687901 · Cited by 7
Leveraging intratumoral probiotics for pancreatic cancer immunotherapy via xenophagy
Li, B., Liu, G., Zhu, Y., Chen, L., Zhang, N., Zhu, X., Sun, Y., Liu, X., Liu, W., Ma, Y., et al. (2026) · Cell Host & Microbe · doi:10.1016/j.chom.2026.02.010 · Cited by 7
Harnessing microbial antigens as cancer antigens: a promising avenue for cancer immunotherapy
Zhang, T., Zhang, X., Chen, J., Zhang, X., & Zhang, Y. (2024) · Frontiers in Immunology · doi:10.3389/fimmu.2024.1411490 · Cited by 7
Microbiome unlocks cancer immunotherapeutic potential: State of the art and future
Luo, H.-Y., Cao, L., Zhou, K., Xiao, Y., Li, Z., Liu, B., & Bu, L. (2025) · Seminars in Cancer Biology · doi:10.1016/j.semcancer.2025.08.001 · Cited by 6
Intratumoral Microbiome: Impact on Cancer Progression and Cellular Immunotherapy
Leonov, G. E., Starodubova, A. V., Makhnach, O. V., Goldshtein, D. V., & Salikhova, D. I. (2025) · Cancers · doi:10.3390/cancers18010100 · Cited by 7
Contextualizing TH17 cells in cancer
Pang, D., Bertocchi, A., Powrie, F. M., & Pohin, M. (2026) · Nature reviews. Immunology · doi:10.1038/s41577-025-01250-6 · Cited by 7
Wall Teichoic Acids Are Direct Molecular Targets of Antimicrobial Peptides in Gram-Positive Bacteria
Sandeep, A., Zaatouf, L., Arnold, A. A., Warschawski, D. E., & Marcotte, I. (2026) · Journal of the American Chemical Society · doi:10.1021/jacs.5c18971 · Cited by 6
Deciphering the Tumor–Immune–Microbe Interactions in HPV-Negative Head and Neck Cancer
Hu, M., Coleman, S. S., Fadlullah, M. Z. H., Spakowicz, D. J., Chung, C. H., & Tan, A. C. (2023) · Genes · doi:10.3390/genes14081599 · Cited by 6
Breast tumor microbiome regulates anti-tumor immunity and T cell-associated metabolites
Liu, C.-C., Grencewicz, D. J., Chakravarthy, K., Li, L., Liepold, R., Wolf, M. R., Marcho, L. M., Sangwan, N., Tzeng, A., Hoyd, R., et al. (2026) · Scientific Reports · doi:10.1038/s41598-026-48719-5 · Cited by 6
The Unexpected Benefit of TCR Cross-Reactivity in Cancer Immunotherapy
Bieberich, F., & Reddy, S. T. (2023) · Cancer Research · doi:10.1158/0008-5472.can-23-2594 · Cited by 6
Antibiotic nanoparticles boost antitumor immunity
Han, K., Cho, Y. S., & Moon, J. J. (2023) · Nature Biotechnology · doi:10.1038/s41587-023-02046-6 · Cited by 6
Beneficial infections of the enterovirus genus in patients with liver cancer
Ma, L., Hung, M., Mehrabadi, F. R., Wang, L., Li, Q., Forgues, M., Wang, K. C., Budhu, A., Candia, J., Chaisaingmongkol, J., et al. (2025) · Gut · doi:10.1136/gutjnl-2024-334681 · Cited by 5
Keretsu, S., Hana, T., Lee, A., Kedei, N., Malik, N., Kim, H. M., Spurgeon, J., Khayrullina, G., Ruf, B., Hara, A., et al. (2025) · Neuro-Oncology Advances · doi:10.1093/noajnl/vdaf173 · Cited by 5
Wang, J., Su, Z., Zhang, X., Wang, S., Chen, X., Xu, X., He, B., & Zheng, Y. (2025) · Biomaterials · doi:10.1016/j.biomaterials.2025.123915 · Cited by 5
Self-citationDubiński, P., Odzimek, M., Podlewski, S., & Brola, W. (2025) · International Journal of Molecular Sciences · doi:10.3390/ijms27010444 · Cited by 5
Fang, X., Tong, W., Wu, S., Zhu, Z., & Zhu, J. (2024) · ONCOLOGIE · doi:10.1515/oncologie-2023-0511 · Cited by 5
Zonulin as Gatekeeper in Gut–Brain Axis: Dysregulation in Glioblastoma
Hagemeyer, H., Hellwinkel, O., & Bello, J. P. (2024) · Biomedicines · doi:10.3390/biomedicines12081649 · Cited by 5
Talpin, A., Maia, A. R. R., Carpier, J.-M., Kulakowski, G., Aubergeon, L., Kervevan, J., Gaal, C., Strozzi, F., Billerey, C., Amable, L., et al. (2025) · Journal for ImmunoTherapy of Cancer · doi:10.1136/jitc-2024-010192 · Cited by 7
Silva, C. A. C., Almonte, A. A., & Zitvogel, L. (2025) · Biomolecules · doi:10.3390/biom15040504 · Cited by 5
Morsy, Y., Walberg, Ã., Wawrzyniak, P., Hubeli, B., Truscello, L., Mamie, C., Niechcial, A., Gueguen, E., Manzini, R., Gottier, C., et al. (2025) · Gut Microbes · doi:10.1080/19490976.2025.2530157 · Cited by 4
Guan, X., Bu, F., Fu, Y., Zhang, H., Xiang, H., Chen, X., Chen, T., Wu, X.-J., Wu, K., Liu, L., et al. (2024) · iScience · doi:10.1016/j.isci.2024.111338 · Cited by 6
Exploring the role of LOX family in glioma progression and immune modulation
Liu, C., Qiao, H., Li, H., Hu, X., Yan, M., Fu, Z., Zhang, H., Wang, Y., & Du, N. (2025) · Frontiers in Immunology · doi:10.3389/fimmu.2025.1512186 · Cited by 5
Research and Clinical Progress of Therapeutic Tumor Vaccines
Dong, C., Zhuang, L., Tan, D., Sun, H., Liang, J., Wei, D., Zheng, Y., Zhang, L., Liu, S., Zhang, Y., et al. (2025) · Vaccines · doi:10.3390/vaccines13070672 · Cited by 5
Self-citationThe role and challenges of intratumoral microbiota in colorectal cancer immunotherapy
Hao, M., Xu, H., Li, M., & Jiao, D. (2025) · Frontiers in Pharmacology · doi:10.3389/fphar.2025.1634703 · Cited by 4
Immunologic specificity in glioblastoma: Antigen discovery and translational implications
Hill, C. M., Wang, A. Z., Hsueh, B., Ramirez, R., Sherpa, N. D., Costa, M. A., Williams, O., Mao, L., & Dunn, G. P. (2025) · Neuro-Oncology Advances · doi:10.1093/noajnl/vdaf028 · Cited by 5
Immunotherapy and targeted therapy for high grade gliomas: current and future directions
Hsueh, B., Steuart, S. J., Odukoya, A. O., Prager, B. C., Kim, Y. J., Hill, C. M., Choi, B. D., & Dunn, G. P. (2025) · Journal of Neuro-Oncology · doi:10.1007/s11060-025-05315-3 · Cited by 5
Zhang, Y., Chen, S., Ma, J., Sun, X., & Zhou, X. (2026) · Cancer Immunology Immunotherapy · doi:10.1007/s00262-026-04309-y · Cited by 4
Metadata
- Authors
- Naghavian, R., Faigle, W., Oldrati, P., Wang, J., Toussaint, N. C., Qiu, Y., Medici, G., Wacker, M., Freudenmann, L. K., Bonté, P.-E., Weller, M., Regli, L., Amigorena, S., Rammensee, H.-G., Walz, J. S., Brugger, S. D., Mohme, M., Zhao, Y., Sospedra, M., Neidert, M. C., & Martin, R.
- Affiliations
- University of Zurich (CH)
- Inserm (FR)
- University of Science and Technology of China (CN)
- SIB Swiss Institute of Bioinformatics (CH)
- German Cancer Research Center (DE)
- Universität Hamburg (DE)
- National Institutes of Health (US)
- ORCID
- Naghavian, Reza
- Faigle, Wolfgang
- Oldrati, Pietro
- Wang, Jian
- Toussaint, Nora C.
- Qiu, Yuhan
- Medici, Gioele
- Wacker, Marcel
- Freudenmann, Lena K.
- Bonté, Pierre-Emmanuel
- Weller, Michael
- Regli, Luca
- Amigorena, Sebastian
- Rammensee, Hans-Georg
- Walz, Juliane S.
- Brugger, Silvio D.
- Mohme, Malte
- Zhao, Yingdong
- Sospedra, Mireia
- Neidert, Marian C.
- Martin, Roland
- Venue
- Nature
- Published
- 2023-05-17
- Volume
- 617
- Issue
- 7962
- Pages
- 807-817
- ISSN
- 0028-0836 (ISSN-L)
- 1476-4687
- PMC
- PMC10208956
- OpenAlex
- W4376959488
- Cited by
- 163
- References
- 61
- Citations by year
- 2026: 38 · 2025: 60 · 2024: 49 · 2023: 15
- FWCI
- 17.76
- Type
- journal article
- Language
- en
- Open access
- hybrid
- doi.org
- Locations
- Nature (publishedVersion, cc-by)
- PubMed Central (publishedVersion, cc-by)
- PubMed (publishedVersion)
- Repository for Publications and Research Data (ETH Zurich) (submittedVersion, cc-by)
- RePEc: Research Papers in Economics (submittedVersion)
- Zurich Open Repository and Archive (University of Zurich) (submittedVersion, cc-by)
- ETH Zürich Research Collection
- Funders
- National Science Foundation
- Schweizerischer Nationalfonds zur Förderung der Wissenschaftlichen Forschung (153213)
- Universität Zürich
- FP7 Ideas: European Research Council (340733)
- Topics
- Life Sciences › Immunology and Microbiology › Immunology › Immunotherapy and Immune Responses
- Health Sciences › Medicine › Oncology › Cancer Immunotherapy and Biomarkers
- Life Sciences › Immunology and Microbiology › Immunology › T-cell and B-cell Immunology
- Keywords
- glioblastoma, tumor-infiltrating lymphocytes, bacterial peptides, HLA class II, tumor antigen presentation, gut microbiota, commensal bacteria, pathogenic bacteria, CD4+ T cells, personalized cancer immunotherapy, immune checkpoint inhibitors
- MeSH terms
- Gastrointestinal Microbiome, Histocompatibility Antigens Class II, Antigens, Neoplasm, Bacteria, Bacterial Proteins, Glioblastoma, HLA Antigens, Humans, Peptide Fragments, Symbiosis, CD4-Positive T-Lymphocytes, Lymphocytes, Tumor-Infiltrating, Cancer Vaccines, Cell Line, Tumor
About these checks
Registry, retraction, Cites and statistics results are computed, not judged, with one exception: a printed reference that no index lists is read once by a model before it counts as a citation error. Claims are extracted by a model and kept only when their quote appears verbatim in the text; each cited source is then checked, with a model’s help, for whether it says what the claim relies on. Those verdicts can be wrong — read the claim’s quote and the cited source before relying on one.
Statistics and arithmetic are recomputed, not judged.
Confidence bands are shown only for fields calibrated on our annotated test set. None is calibrated yet, so no band is shown.
What counts as a claim ›How we measure confidence ›How we check this ›
Are you an author, or do you see a problem with this page? Request a review
