

mRNA structure regulates protein expression through changes in functional half-life
Open accessPublished version of a preprint
The DOI matches its Crossref record; 57 of the 57 references it cites were found in a registry or an index.
Abstract
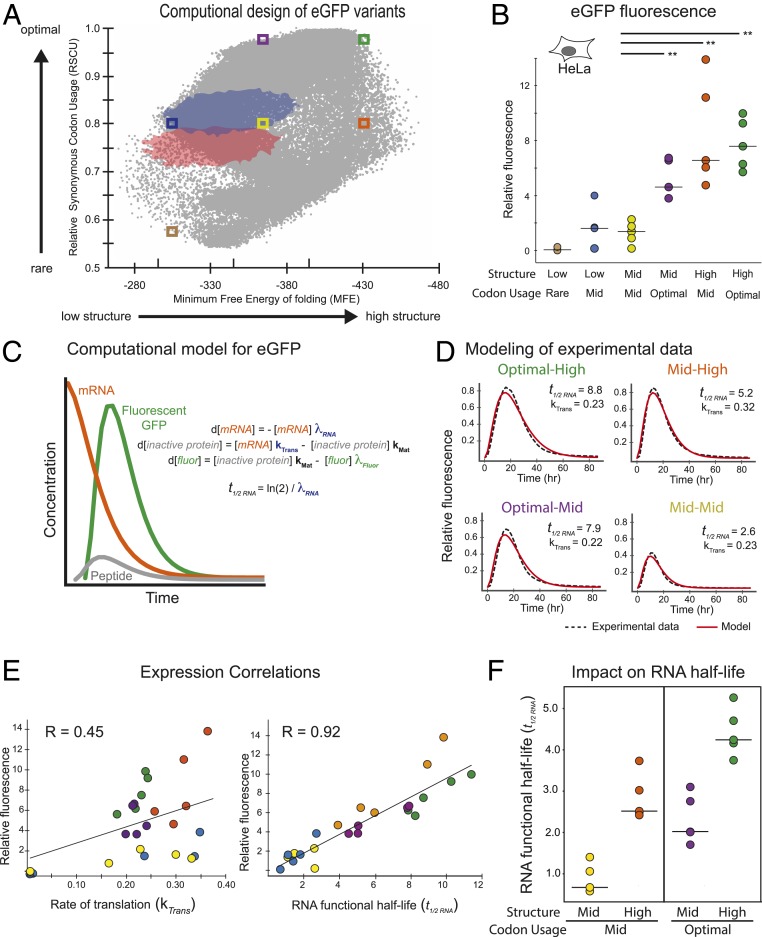
Messenger RNAs (mRNAs) encode information in both their primary sequence and their higher order structure. The independent contributions of factors like codon usage and secondary structure to regulating protein expression are difficult to establish as they are often highly correlated in endogenous sequences. Here, we used 2 approaches, global inclusion of modified nucleotides and rational sequence design of exogenously delivered constructs, to understand the role of mRNA secondary structure independent from codon usage. Unexpectedly, highly expressed mRNAs contained a highly structured coding sequence (CDS). Modified nucleotides that stabilize mRNA secondary structure enabled high expression across a wide variety of primary sequences. Using a set of eGFP mRNAs with independently altered codon usage and CDS structure, we find that the structure of the CDS regulates protein expression through changes in functional mRNA half-life (i.e., mRNA being actively translated). This work highlights an underappreciated role of mRNA secondary structure in the regulation of mRNA stability.
Overview
The claims and statistics of this paper haven’t been checked yet.
Free: it reads the open-access text and checks the first 5 claims that cite a source we can check. Create a free account to check every claim.
Integrity signals
Registry
Cites
Statistics
Figures
Verification
Claims the paper makes
The claims and statistics of this paper haven’t been checked yet.
Free: it reads the open-access text and checks the first 5 claims that cite a source we can check. Create a free account to check every claim.
Claims other papers make about this one
Each is checked against this paper’s own text: does it say what the citing paper says it does?
The source backs part of the claim, not all of it — or backs it for a different population, condition or comparison.
In the citing paper
“Increasing secondary structure lengthens mRNA half-life, which, together with optimal codons, improves protein expression5.”
From Algorithm for optimized mRNA design improves stability and immunogenicity (2023) · cites this paper as [5]
Experimental — accuracy not yet measuredThe source backs part of the claim, not all of it — or backs it for a different population, condition or comparison.
In the citing paper
“Previous work5 established two main objectives for mRNA design, stability and codon optimality, which synergize to increase protein expression.”
From Algorithm for optimized mRNA design improves stability and immunogenicity (2023) · cites this paper as [5]
Experimental — accuracy not yet measuredThe source backs part of the claim, not all of it — or backs it for a different population, condition or comparison.
In the citing paper
“However, mRNA molecules are chemically unstable and prone to degrade, which leads to insufficient protein expression5”
From Algorithm for optimized mRNA design improves stability and immunogenicity (2023) · cites this paper as [5]
Experimental — accuracy not yet measuredThe source backs part of the claim, not all of it — or backs it for a different population, condition or comparison.
In the citing paper
“Increasing secondary structure lengthens mRNA half-life, which, together with optimal codons, improves protein expression5.”
From Algorithm for optimized mRNA design improves stability and immunogenicity (2023) · cites this paper as [5]
Experimental — accuracy not yet measuredThe source backs part of the claim, not all of it — or backs it for a different population, condition or comparison.
In the citing paper
“However, mRNA molecules are chemically unstable and prone to degrade, which leads to insufficient protein expression5”
From Algorithm for optimized mRNA design improves stability and immunogenicity (2023) · cites this paper as [5]
Experimental — accuracy not yet measured
13 more claims about this paper
Create a free account to see every claim other papers make about this one.
Self-check
Percentages, sums and reported differences re-computed from the paper’s own numbers.
The self-check needs the paper’s full text.
Citations
Cites
Karikó, K., Buckstein, M., Ni, H., & Weissman, D. (2005) · Immunity · doi:10.1016/j.immuni.2005.06.008 · Cited by 2,728 · cited 1×
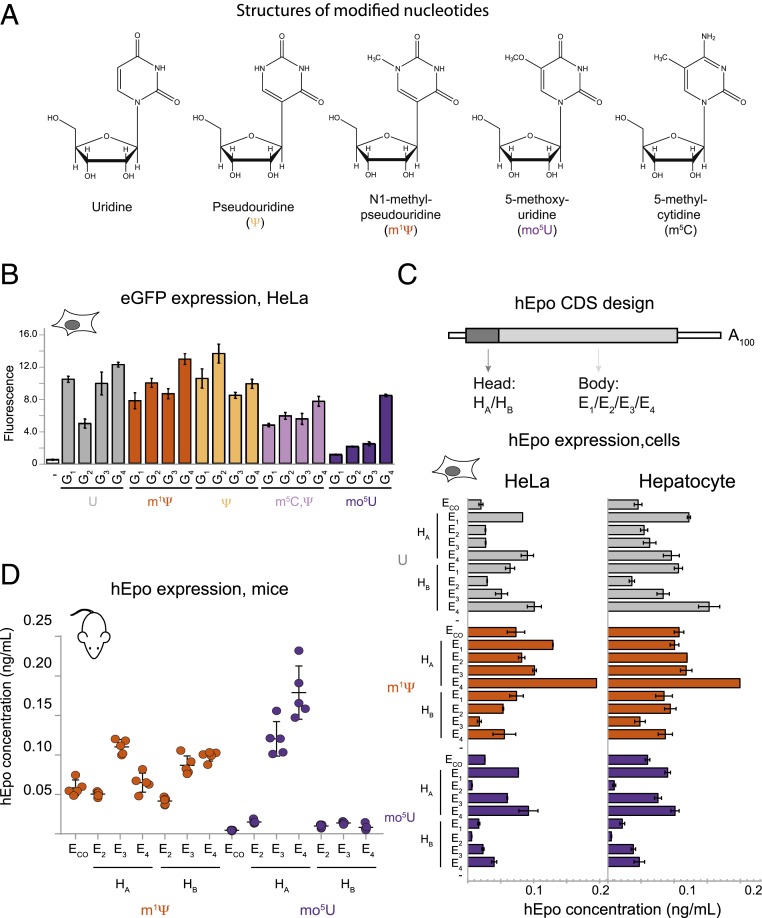
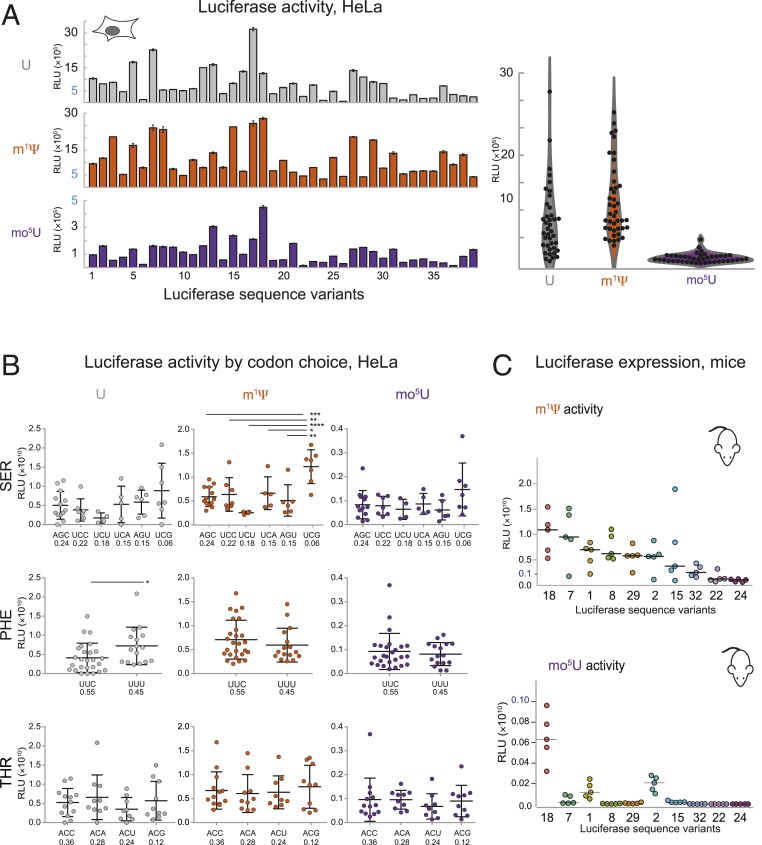
“To assess the degree to which the above conclusions from cell lines translated to animals, we examined protein expression in mice from formulated hEpo and Luc mRNA variants containing two nucleotide modifications shown to have reduced immunogenicity (m(1)Y and mo(5)U) (Kariko et al., 2005).”
A "Silent" Polymorphism in the MDR 1 Gene Changes Substrate Specificity
Kimchi-Sarfaty, C., Oh, J. M., Kim, I.-W., Sauna, Z. E., Calcagno, A. M., Ambudkar, S. V., & Gottesman, M. M. (2007) · Science · doi:10.1126/science.1135308 · Cited by 2,416 · cited 1×
“Another possibility is that structure leads to ribosome pausing at specific locations in the peptide, crucial for proper protein folding, and therefore activity, of certain multidomain proteins (32, 33).”
Karikó, K., Muramatsu, H., Welsh, F. A., Ludwig, J., Kato, H., Akira, S., & Weissman, D. (2008) · Molecular Therapy · doi:10.1038/mt.2008.200 · Cited by 1,930 · cited 2×
“For comparison with a previous study documenting the effects of modified nucleotides on RNA immunogenicity (16), we also made eGFP mRNA wherein both U and C were substituted with Ψ and 5-methyl-cytidine (m(5)C), respectively.”
Synonymous but not the same: the causes and consequences of codon bias
Plotkin, J. B., & Kudla, G. (2011) · Nature Reviews Genetics · doi:10.1038/nrg2899 · Cited by 1,685 · cited 1×
“Highly expressed mRNAs tended to have increased GC content, consistent with previous reports (17), but not all high GC sequences were high expressers (SI Appendix, Figs.”
ResultCodon bias and heterologous protein expression
Gustafsson, C., Govindarajan, S., & Minshull, J. (2004) · Trends in Biotechnology · doi:10.1016/j.tibtech.2004.04.006 · Cited by 1,330 · cited 1×
“Synonymous codon choice directly impacts translation, with highly expressed genes tending to include more "optimal" codons (Gustafsson et al., 2004; Hinnebusch et al., 2016; Horstick et al., 2015; Pop et al., 2014).”
Codon usage tabulated from international DNA sequence databases: status for the year 2000
Nakamura, Y. (2000) · Nucleic Acids Research · doi:10.1093/nar/28.1.292 · Cited by 1,254 · cited 2×
“Using probabilities weighted by frequency in the human transcriptome (Nakamura et al., 2000) generates a similar-shaped distribution, but shifted to both significantly higher RSCU (0.”
MethodInfluentialImproved Green Fluorescent Protein by Molecular Evolution Using DNA Shuffling
Crameri, A., Whitehorn, E. A., Tate, E., & Stemmer, W. P. C. (1996) · Nature Biotechnology · doi:10.1038/nbt0396-315 · Cited by 1,187 · cited 1×
“Realtime, continuous expression data were fit by a model including rate constants for mRNA translation, mRNA functional half-life, maturation of eGFP protein into its fluorescent form (28), and eGFP protein degradation (Fig.”
Xia, T., SantaLucia, J., Burkard, M. E., Kierzek, R., Schroeder, S. J., Jiao, X., Cox, C., & Turner, D. H. (1998) · Biochemistry · doi:10.1021/bi9809425 · Cited by 1,140 · cited 8×
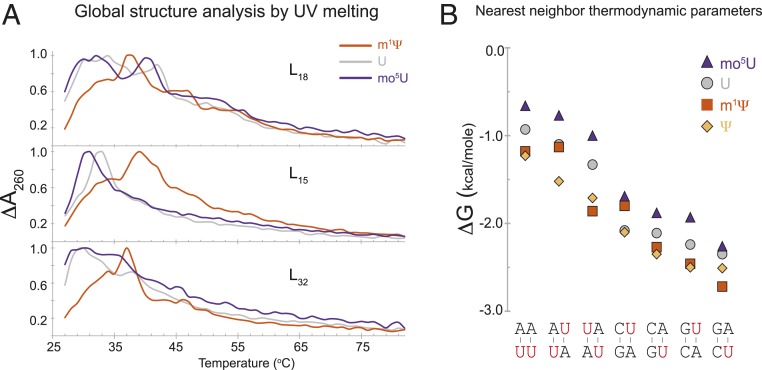
“Nearest-neighbor thermodynamic parameters along with the experimentally determined error for Watson-crick base pairs containing unmodified uridine (values from (Xia et al., 1998)), Y, m(1)Y, or mo(5)U.”
InfluentialTranslational control by 5′-untranslated regions of eukaryotic mRNAs
Hinnebusch, A. G., Ivanov, I. P., & Sonenberg, N. (2016) · Science · doi:10.1126/science.aad9868 · Cited by 1,079 · cited 1×
“Synonymous codon choice directly impacts translation, with highly expressed genes tending to include more "optimal" codons (Gustafsson et al., 2004; Hinnebusch et al., 2016; Horstick et al., 2015; Pop et al., 2014).”
Codon Optimality Is a Major Determinant of mRNA Stability
Presnyak, V., Alhusaini, N., Chen, Y.-H., Martin, S., Morris, N., Kline, N., Olson, S., Weinberg, D., Baker, K. E., Graveley, B. R., et al. (2015) · Cell · doi:10.1016/j.cell.2015.02.029 · Cited by 1,078 · cited 5×
“Regions of increased rare codon frequency have been shown to decrease protein expression and mRNA stability (Presnyak et al., 2015; Weinberg et al., 2016).”
InfluentialSelf-citation
Cited by
SARS-CoV-2 mRNA Vaccine Design Enabled by Prototype Pathogen Preparedness
Corbett, K. S., Edwards, D. K., Leist, S. R., Abiona, O. M., Boyoglu-Barnum, S., Gillespie, R. A., Himansu, S., Schäfer, A., Ziwawo, C. T., DiPiazza, A. T., et al. (2020) · Nature · doi:10.1038/s41586-020-2622-0 · Cited by 1,615
Self-citationmRNA-lipid nanoparticle COVID-19 vaccines: structure and stability
Schoenmaker, L., Witzigmann, D., Kulkarni, J. A., Verbeke, R., Kersten, G., Jiskoot, W., & Crommelin, D. J. A. (2021) · International Journal of Pharmaceutics · doi:10.1016/j.ijpharm.2021.120586 · Cited by 1,566
“Moreover, there are also indications that m1 Ψ increases base stacking and the melting point of mRNA, thereby making mRNA more stable (Mauger et al., 2019; Zhao and He, 2015).”
mRNA-based therapeutics: powerful and versatile tools to combat diseases
Qin, S., Tang, X., Chen, Y., Chen, K., Fan, N., Xiao, W., Zheng, Q., Li, G., Teng, Y., Wu, M., et al. (2022) · Signal Transduction and Targeted Therapy · doi:10.1038/s41392-022-01007-w · Cited by 771
“Increasing the GC content by replacing rare codons in ORFs protects mRNA from endoribonuclease degradation and enhances mRNA protein expression in vivo.(71,72) In addition, functional peptides are crucial for mRNA Fig.”
BackgroundAdvances in COVID-19 mRNA vaccine development
Fang, E., Liu, X., Li, M., Zhang, Z., Song, L., Zhu, B., Wu, X., Liu, J., Zhao, D., & Li, Y. (2022) · Signal Transduction and Targeted Therapy · doi:10.1038/s41392-022-00950-y · Cited by 601
“Currently, nucleoside-modified mRNA vaccines employ 100% chemically modified nucleosides replacing natural nucleosides, and m(1)ψ is often used to replace uridine during IVT to improve the safety and stability of mRNA vaccines.(52,134,172) At present, mRNA vaccines that have entered clinical trials or been approved fo…”
MethodRoles of mRNA poly(A) tails in regulation of eukaryotic gene expression
Passmore, L. A., & Coller, J. (2022) · Nature Reviews Molecular Cell Biology · doi:10.1038/s41580-021-00417-y · Cited by 569
Metadata
- Authors
- Mauger, D. M., Cabral, B. J., Presnyak, V., Su, S. V., Reid, D. W., Goodman, B., Link, K., Khatwani, N., Reynders, J., Moore, M. J., & McFadyen, I. J.
- Affiliations
- Platform Research, Moderna, Inc., Cambridge, MA 02139
- Corresponding author
- Moore, Melissa J.
- Venue
- Proceedings of the National Academy of Sciences
- Publisher
- National Academy of Sciences
- Published
- 2019-11-11
- Volume
- 116
- Issue
- 48
- Pages
- 24075-24083
- ISSN
- 0027-8424 (ISSN-L)
- 1091-6490
- PMC
- PMC6883848
- OpenAlex
- W2983889514
- Semantic Scholar
- 5893e4255a022371c1bbef16899698c3e704ff58
- Cited by
- 555
- References
- 56
- Citations by year
- 2026: 76 · 2025: 105 · 2024: 104 · 2023: 73 · 2022: 98 · 2021: 71 · 2020: 26 · 2019: 2
- FWCI
- 16.54
- Type
- journal article
- Language
- en
- Open access
- hybrid
- doi.org
- Licence
- Locations
- Proceedings of the National Academy of Sciences (publishedVersion, cc-by)
- bioRxiv (Cold Spring Harbor Laboratory) (acceptedVersion)
- PubMed Central (publishedVersion, cc-by)
- PubMed (publishedVersion)
- Funders
- Moderna
- Topics
- Life Sciences › Biochemistry, Genetics and Molecular Biology › Molecular Biology › RNA and protein synthesis mechanisms
- Life Sciences › Biochemistry, Genetics and Molecular Biology › Molecular Biology › RNA Research and Splicing
- Life Sciences › Biochemistry, Genetics and Molecular Biology › Molecular Biology › RNA Interference and Gene Delivery
- Keywords
- mRNA secondary structure, mRNA stability, mRNA half-life, codon usage, protein expression regulation, modified nucleotides, mRNA translation
- MeSH terms
- Half-Life, HeLa Cells, Humans, Nucleic Acid Conformation, Proteins, RNA, Messenger, Protein Biosynthesis, RNA Stability
About these checks
Registry, retraction, Cites and statistics results are computed, not judged, with one exception: a printed reference that no index lists is read once by a model before it counts as a citation error. Claims are extracted by a model and kept only when their quote appears verbatim in the text; each cited source is then checked, with a model’s help, for whether it says what the claim relies on. Those verdicts can be wrong — read the claim’s quote and the cited source before relying on one.
Statistics and arithmetic are recomputed, not judged.
Confidence bands are shown only for fields calibrated on our annotated test set. None is calibrated yet, so no band is shown.
What counts as a claim ›How we measure confidence ›How we check this ›
Are you an author, or do you see a problem with this page? Request a review
How to cite
Cite CoChat for the checks on this page, and the paper for its own findings.
- This page
- CoChat. (2026). Citation check: mRNA structure regulates protein expression through changes in functional half-life. https://app.cochat.ai/papers/10.1073/pnas.1908052116
- The paper
- Mauger, D. M., Cabral, B. J., Presnyak, V., Su, S. V., Reid, D. W., Goodman, B., Link, K., Khatwani, N., Reynders, J., Moore, M. J., & McFadyen, I. J. (2019). mRNA structure regulates protein expression through changes in functional half-life. Proceedings of the National Academy of Sciences. https://doi.org/10.1073/pnas.1908052116
Data sources
Bibliographic data: Semantic Scholar, OpenAlex, Crossref.
Contains information from the Semantic Scholar Academic Graph Datasets, made available under the ODC Attribution License (ODC-BY 1.0).
Semantic Scholar’s data is described in: Kinney, R., et al. (2023). The Semantic Scholar Open Data Platform. arXiv:2301.10140.
