

The DOI matches its Crossref record; 23 of the 23 references it cites were found in a registry or an index.
The selection landscape and genetic legacy of ancient Eurasians
Published version of a preprint
Abstract
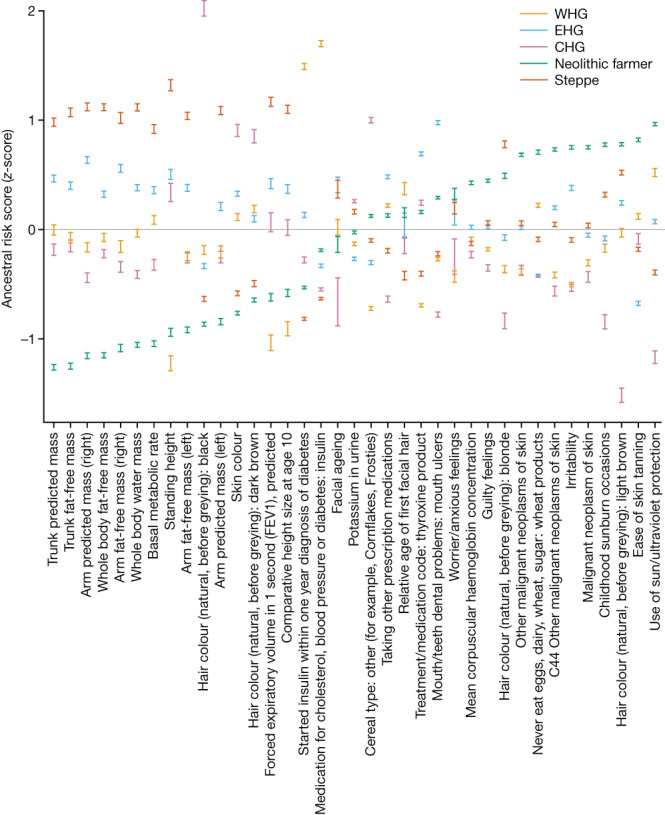
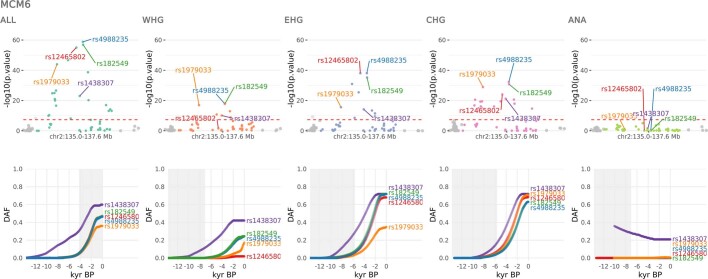
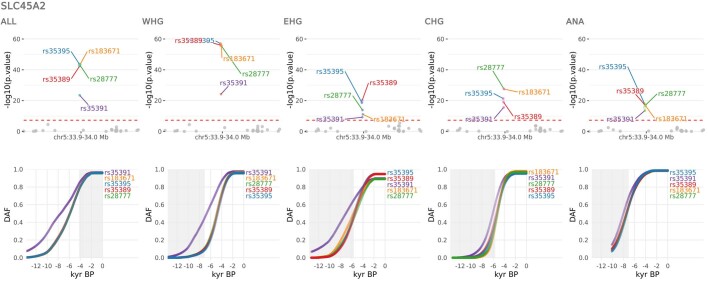
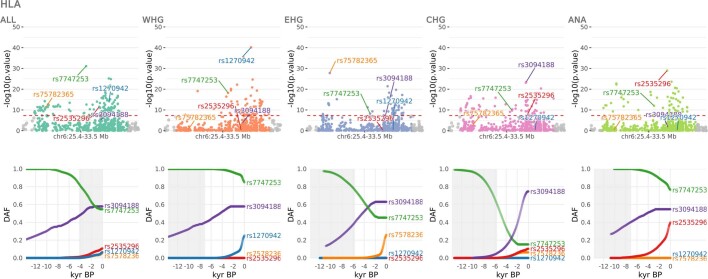
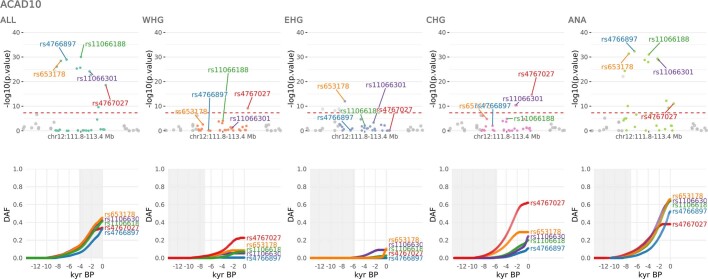
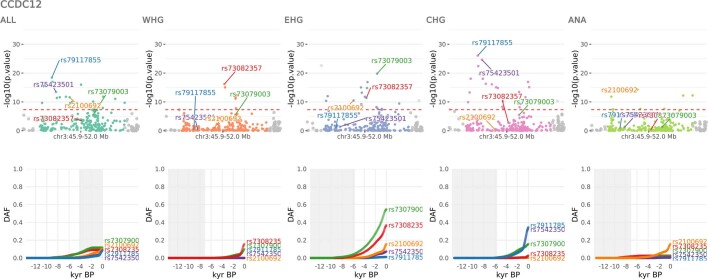
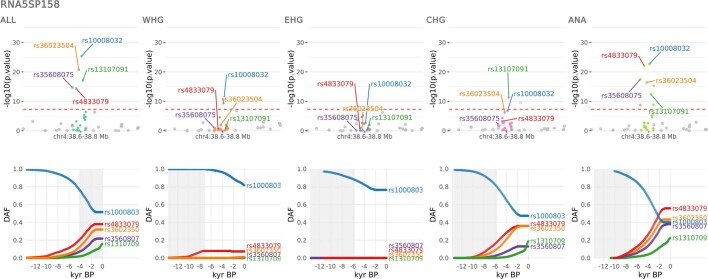
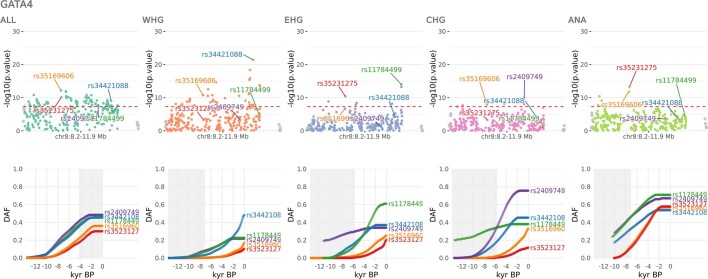
The Holocene (beginning around 12,000 years ago) encompassed some of the most significant changes in human evolution, with far-reaching consequences for the dietary, physical and mental health of present-day populations. Using a dataset of more than 1,600 imputed ancient genomes 1 , we modelled the selection landscape during the transition from hunting and gathering, to farming and pastoralism across West Eurasia. We identify key selection signals related to metabolism, including that selection at the FADS cluster began earlier than previously reported and that selection near the LCT locus predates the emergence of the lactase persistence allele by thousands of years. We also find strong selection in the HLA region, possibly due to increased exposure to pathogens during the Bronze Age. Using ancient individuals to infer local ancestry tracts in over 400,000 samples from the UK Biobank, we identify widespread differences in the distribution of Mesolithic, Neolithic and Bronze Age ancestries across Eurasia. By calculating ancestry-specific polygenic risk scores, we show that height differences between Northern and Southern Europe are associated with differential Steppe ancestry, rather than selection, and that risk alleles for mood-related phenotypes are enriched for Neolithic farmer ancestry, whereas risk alleles for diabetes and Alzheimer’s disease are enriched for Western hunter-gatherer ancestry. Our results indicate that ancient selection and migration were large contributors to the distribution of phenotypic diversity in present-day Europeans.
Overview
The claims and statistics of this paper haven’t been checked yet.
Run the check — free, no account needed. It reads the open-access text and checks the sources it cites.
Integrity signals
Registry
Cites
Statistics
Figures
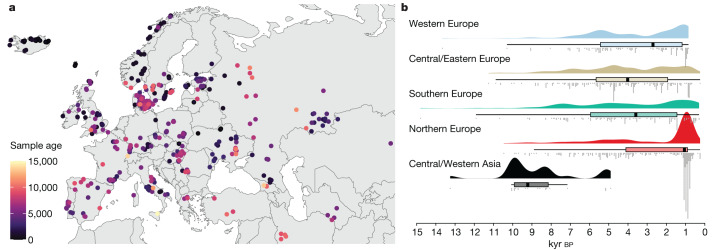
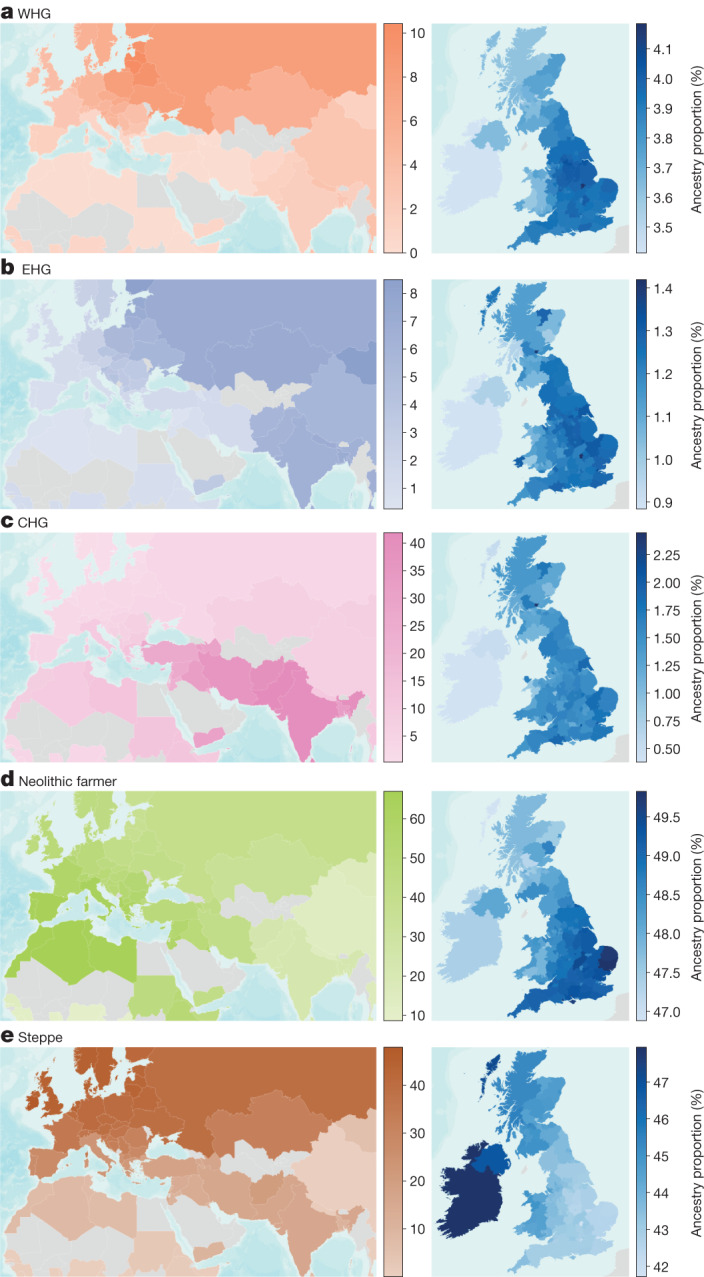
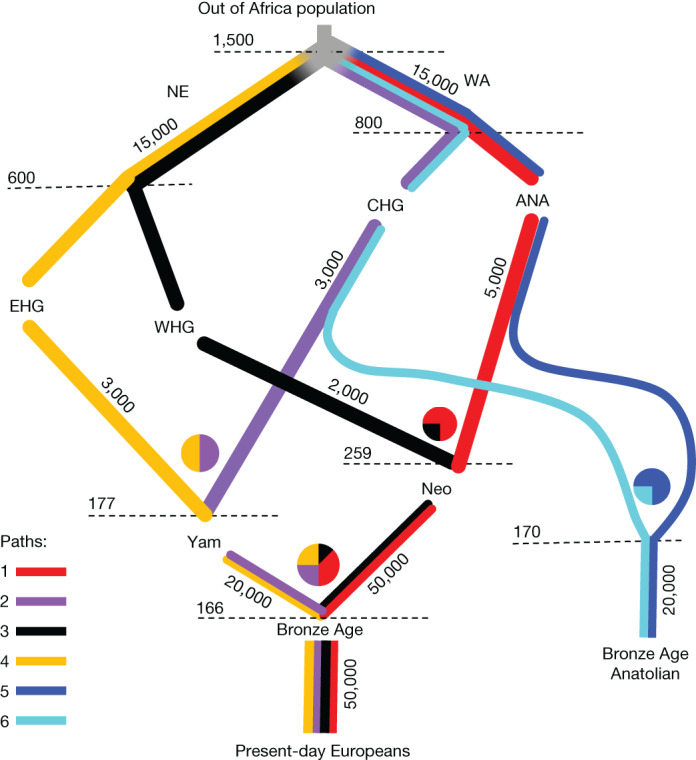
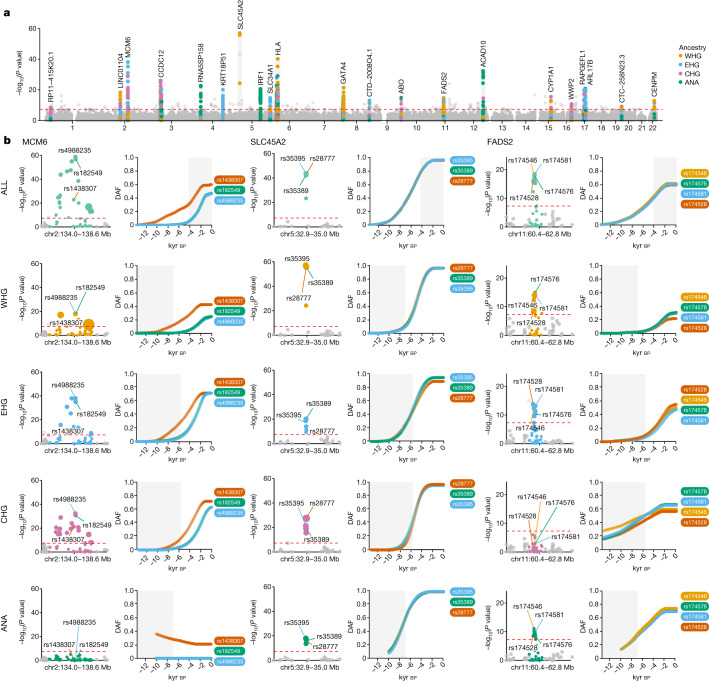
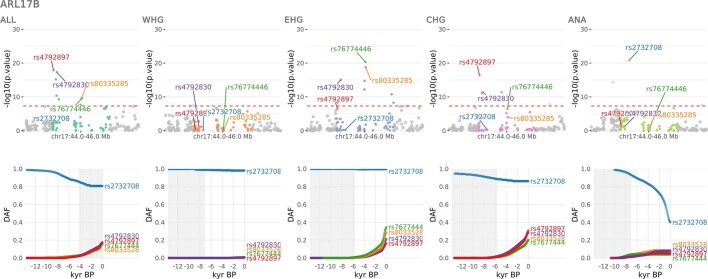
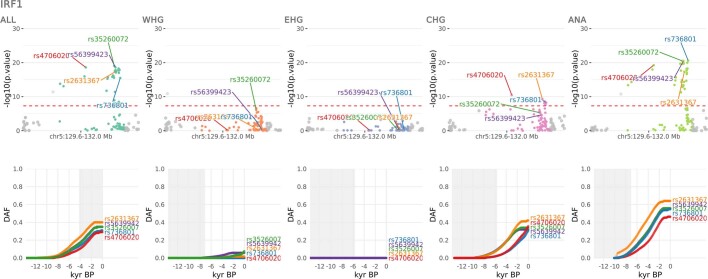
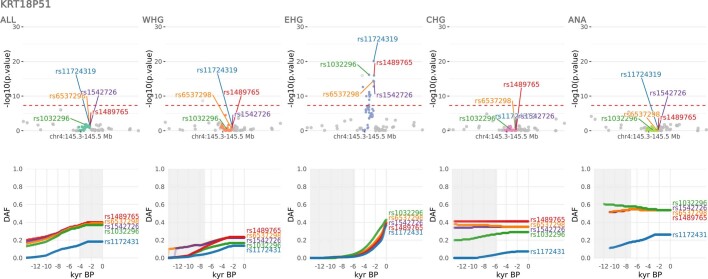
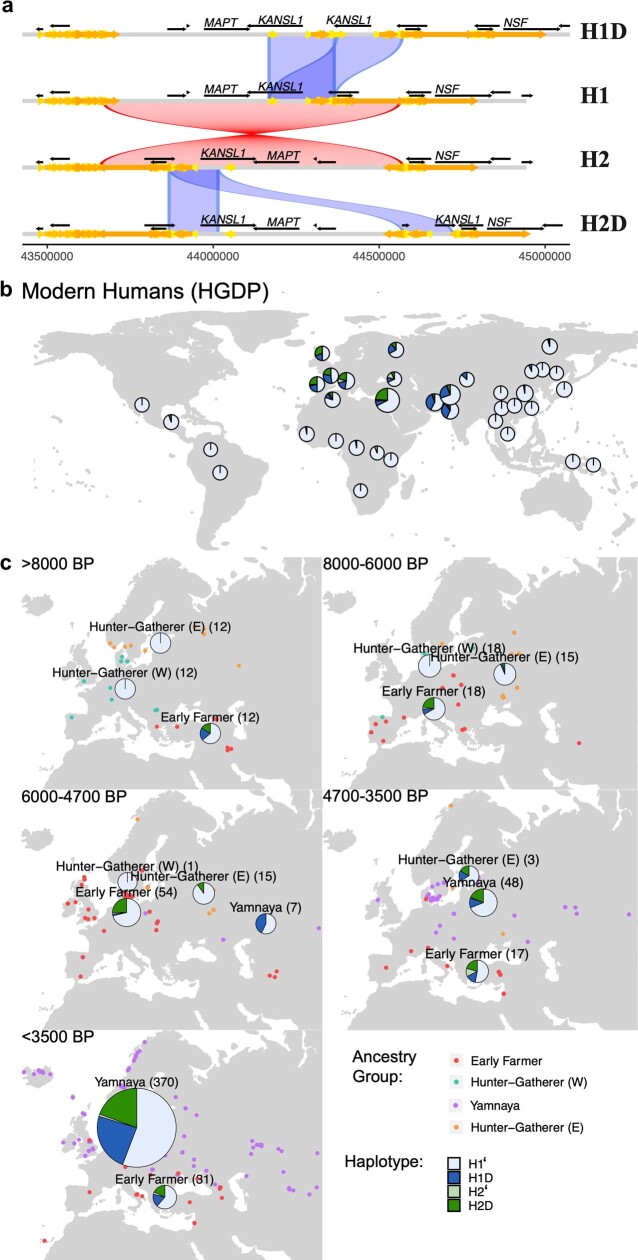
Verification
Claims the paper makes
The claims and statistics of this paper haven’t been checked yet.
Run the check — free, no account needed. It reads the open-access text and checks the sources it cites.
Claims other papers make about this one
Each is checked against this paper’s own text: does it say what the citing paper says it does?
The cited source says what the claim attributes to it.
In the citing paper
“We note, however, that this interpretation reflects only two axes of a potentially broader selective landscape that probably also involves other fitness-relevant phenotypes, including immunity58,59.”
From Genetic trade-offs in fertility and longevity explain the maintenance of disease-associated alleles in humans (2026) · cites this paper as [58]
Self-check
Percentages, sums and reported differences re-computed from the paper’s own numbers.
The self-check needs the paper’s full text.
Citations
Cites
A global reference for human genetic variation
The 1000 Genomes Project Consortium, authors, C., Auton, A., Abecasis, G. R., Steering committee, Altshuler, D. M., Durbin, R. M., Abecasis, G. R., Bentley, D. R., Chakravarti, A., et al. (2015) · Nature · doi:10.1038/nature15393 · Cited by 18,247
Self-citationFinnGen provides genetic insights from a well-phenotyped isolated population
Kurki, M. I., Karjalainen, J., Palta, P., Sipilä, T. P., Kristiansson, K., Donner, K. M., Reeve, M. P., Laivuori, H., Aavikko, M., Kaunisto, M. A., et al. (2023) · Nature · doi:10.1038/s41586-022-05473-8 · Cited by 4,233
Genome-wide detection and characterization of positive selection in human populations
The International HapMap Consortium, Sabeti, P. C., Varilly, P., Fry, B., Lohmueller, J., Hostetter, E., Cotsapas, C., Xie, X., Byrne, E. H., McCarroll, S. A., et al. (2007) · Nature · doi:10.1038/nature06250 · Cited by 2,131
Massive migration from the steppe was a source for Indo-European languages in Europe
Haak, W., Lazaridis, I., Patterson, N., Rohland, N., Mallick, S., Llamas, B., Brandt, G., Nordenfelt, S., Harney, E., Stewardson, K., et al. (2015) · Nature · doi:10.1038/nature14317 · Cited by 1,940
The Simons Genome Diversity Project: 300 genomes from 142 diverse populations
Mallick, S., Li, H., Lipson, M., Mathieson, I., Gymrek, M., Racimo, F., Zhao, M., Chennagiri, N., Nordenfelt, S., Tandon, A., et al. (2016) · Nature · doi:10.1038/nature18964 · Cited by 1,584
Self-citationPopulation genomics of Bronze Age Eurasia
Allentoft, M. E., Sikora, M., Sjögren, K.-G., Rasmussen, S., Rasmussen, M., Stenderup, J., Damgaard, P. B., Schroeder, H., Ahlström, T., Vinner, L., et al. (2015) · Nature · doi:10.1038/nature14507 · Cited by 1,550
Self-citationGenome-wide patterns of selection in 230 ancient Eurasians
Mathieson, I., Lazaridis, I., Rohland, N., Mallick, S., Patterson, N., Roodenberg, S. A., Harney, E., Stewardson, K., Fernandes, D., Novak, M., et al. (2015) · Nature · doi:10.1038/nature16152 · Cited by 1,515
Human Demographic History Impacts Genetic Risk Prediction across Diverse Populations
Martin, A. R., Gignoux, C. R., Walters, R. K., Wojcik, G. L., Neale, B. M., Gravel, S., Daly, M. J., Bustamante, C. D., & Kenny, E. E. (2017) · The American Journal of Human Genetics · doi:10.1016/j.ajhg.2017.03.004 · Cited by 1,391
The evolution of human skin coloration
Jablonski, N. G., & Chaplin, G. (2000) · Journal of Human Evolution · doi:10.1006/jhev.2000.0403 · Cited by 1,212 · cited 1×
“…skin are important in equatorial regions owing to its protection against ultraviolet radiation, whereas lighter skin has been selected for at higher latitudes (where ultraviolet radiation is less intense) because some ultraviolet penetration is required for cutaneous synthesis of vitamin D 64,65 .”
BackgroundInference of Population Structure using Dense Haplotype Data
Lawson, D. J., Hellenthal, G., Myers, S., & Falush, D. (2012) · PLoS Genetics · doi:10.1371/journal.pgen.1002453 · Cited by 1,188
Self-citation
Research works printed but not linked: 73
- Allentoft, M. E. et al. Population genomics of post-glacial western Eurasia. Nature https://doi.org/10.1038/s41586-023-06865-0 (2024). · DOI
- Page, A. E. et al. Reproductive trade-offs in extant hunter-gatherers suggest adaptive mechanism for the Neolithic expansion. Proc. Natl Acad. Sci. USA 113, 4694–4699 (2016). · DOI
- Marciniak, S., Bergey, C., Silva, A. M. & Hałuszko, A. An integrative skeletal and paleogenomic analysis of prehistoric stature variation suggests relatively reduced health for early European farmers. Proc. Natl Acad. Sci. USA 119, e2106743119 (2022). · DOI
- Visscher, P. M. et al. 10 years of GWAS discovery: biology, function and translation. Am. J. Hum. Genet. 101, 5–22 (2017). · DOI · Paper page
- Bycroft, C. et al. The UK Biobank resource with deep phenotyping and genomic data. Nature 562, 203–209 (2018). · DOI · Paper page
- Vitti, J. J., Grossman, S. R. & Sabeti, P. C. Detecting natural selection in genomic data. Annu. Rev. Genet. 47, 97–120 (2013). · DOI · Paper page
- Ju, D. & Mathieson, I. The evolution of skin pigmentation-associated variation in West Eurasia. Proc. Natl Acad. Sci. USA 118, e2009227118 (2021). · DOI
- Wilde, S. et al. Direct evidence for positive selection of skin, hair and eye pigmentation in Europeans during the last 5,000 y. Proc. Natl Acad. Sci. USA 111, 4832–4837 (2014). · DOI · Paper page
- Sousa da Mota, B. et al. Imputation of ancient human genomes. Nat. Commun. 14, 3660 (2023). · DOI
- Hellenthal, G. et al. A genetic atlas of human admixture history. Science 343, 747–751 (2014). · DOI · Paper page
- Sikora, M. et al. The population history of northeastern Siberia since the Pleistocene. Nature 570, 182–188 (2019). · DOI · Paper page
- Shinde, V. et al. An ancient Harappan genome lacks ancestry from Steppe pastoralists or Iranian farmers. Cell 179, 729–735 (2019). · DOI
- Galinsky, K. J., Loh, P.-R., Mallick, S., Patterson, N. J. & Price, A. L. Population structure of UK Biobank and ancient Eurasians reveals adaptation at genes influencing blood pressure. Am. J. Hum. Genet. 99, 1130–1139 (2016). · DOI
- Patterson, N. et al. Large-scale migration into Britain during the Middle to Late Bronze Age. Nature 601, 588–594 (2022). · DOI
- Olalde, I. et al. The Beaker phenomenon and the genomic transformation of northwest Europe. Nature 555, 190–196 (2018). · DOI · Paper page
- Zaidi, A. A. & Mathieson, I. Demographic history mediates the effect of stratification on polygenic scores. eLife 9, e61548 (2020). · DOI · Paper page
- Speidel, L., Forest, M., Shi, S. & Myers, S. R. A method for genome-wide genealogy estimation for thousands of samples. Nat. Genet. 51, 1321–1329 (2019). · DOI · Paper page
- Speidel, L. et al. Inferring population histories for ancient genomes using genome-wide genealogies. Mol. Biol. Evol. 38, 3497–3511 (2021). · DOI
- Stern, A. J., Wilton, P. R. & Nielsen, R. An approximate full-likelihood method for inferring selection and allele frequency trajectories from DNA sequence data. PLoS Genet. 15, e1008384 (2019). · DOI
- Buniello, A. et al. The NHGRI-EBI GWAS Catalog of published genome-wide association studies, targeted arrays and summary statistics 2019. Nucleic Acids Res. 47, D1005–D1012 (2019). · DOI · Paper page
- Souilmi, Y. et al. Admixture has obscured signals of historical hard sweeps in humans. Nat. Ecol. Evol. 6, 2003–2015 (2022). · DOI
- Enattah, N. S. et al. Independent introduction of two lactase-persistence alleles into human populations reflects different history of adaptation to milk culture. Am. J. Hum. Genet. 82, 57–72 (2008). · DOI
- Ségurel, L. & Bon, C. On the evolution of lactase persistence in humans. Annu. Rev. Genomics Hum. Genet. 18, 297–319 (2017). · DOI
- Segurel, L. et al. Why and when was lactase persistence selected for? Insights from Central Asian herders and ancient DNA. PLoS Biol. 18, e3000742 (2020). · DOI
- Enattah, N. S. et al. Identification of a variant associated with adult-type hypolactasia. Nat. Genet. 30, 233–237 (2002). · DOI
- Wang, L. et al. A MicroRNA linking human positive selection and metabolic disorders. Cell 183, 684–701 (2020). · DOI
- Evershed, R. P. et al. Dairying, diseases and the evolution of lactase persistence in Europe. Nature 608, 336–345 (2022). · DOI
- Mallick, S. et al. The Allen Ancient DNA Resource (AADR): a curated compendium of ancient human genomes. Preprint at bioRxiv https://doi.org/10.1101/2023.04.06.535797 (2023). · DOI
- Willer, C. J. et al. Discovery and refinement of loci associated with lipid levels. Nat. Genet. 45, 1274–1283 (2013). · DOI
- Gallois, A. et al. A comprehensive study of metabolite genetics reveals strong pleiotropy and heterogeneity across time and context. Nat. Commun. 10, 4788 (2019). · DOI
- Buckley, M. T. et al. Selection in Europeans on fatty acid desaturases associated with dietary changes. Mol. Biol. Evol. 34, 1307–1318 (2017). · DOI
- Ye, K., Gao, F., Wang, D., Bar-Yosef, O. & Keinan, A. Dietary adaptation of FADS genes in Europe varied across time and geography. Nat. Ecol. Evol. 1, 167 (2017). · DOI
- Mathieson, S. & Mathieson, I. FADS1 and the timing of human adaptation to agriculture. Mol. Biol. Evol. 35, 2957–2970 (2018). · DOI
- Lazaridis, I. The evolutionary history of human populations in Europe. Curr. Opin. Genet. Dev. 53, 21–27 (2018). · DOI
- Luu, K., Bazin, E. & Blum, M. G. B. pcadapt: an R package to perform genome scans for selection based on principal component analysis. Mol. Ecol. Resour. 17, 67–77 (2017). · DOI
- Sánchez-Solana, B., Li, D.-Q. & Kumar, R. Cytosolic functions of MORC2 in lipogenesis and adipogenesis. Biochim. Biophys. Acta 1843, 316–326 (2014). · DOI
- Kim, S. V. et al. GPR15-mediated homing controls immune homeostasis in the large intestine mucosa. Science 340, 1456–1459 (2013). · DOI
- Nguyen, L. P. et al. Role and species-specific expression of colon T cell homing receptor GPR15 in colitis. Nat. Immunol. 16, 207–213 (2015). · DOI
- Monteleone, G. et al. Mongersen, an oral SMAD7 antisense oligonucleotide and Crohn’s disease. N. Engl. J. Med. 372, 1104–1113 (2015). · DOI
- Morris, J. A. et al. An atlas of genetic influences on osteoporosis in humans and mice. Nat. Genet. 51, 258–266 (2018). · DOI · Paper page
- Brinkworth, J. F. & Barreiro, L. B. The contribution of natural selection to present-day susceptibility to chronic inflammatory and autoimmune disease. Curr. Opin. Immunol. 31, 66–78 (2014). · DOI
- Barrie, W. et al. Elevated genetic risk for multiple sclerosis emerged in steppe pastoralist populations. Nature https://doi.org/10.1038/s41586-023-06618-z (2024). · DOI · Paper page
- Jones, A. V. et al. GWAS of self-reported mosquito bite size, itch intensity and attractiveness to mosquitoes implicates immune-related predisposition loci. Hum. Mol. Genet. 26, 1391–1406 (2017). · DOI
- Gutierrez-Achury, J. et al. Functional implications of disease-specific variants in loci jointly associated with coeliac disease and rheumatoid arthritis. Hum. Mol. Genet. 25, 180–190 (2016). · DOI
- Stefansson, H. et al. A common inversion under selection in Europeans. Nat. Genet. 37, 129–137 (2005). · DOI
- Steinberg, K. M. et al. Structural diversity and African origin of the 17q21.31 inversion polymorphism. Nat. Genet. 44, 872–880 (2012). · DOI
- Kılınç, G. M. et al. The demographic development of the first farmers in Anatolia. Curr. Biol. 26, 2659–2666 (2016). · DOI
- Jones, E. R. et al. The Neolithic transition in the Baltic was not driven by admixture with early European farmers. Curr. Biol. 27, 576–582 (2017). · DOI
- Andreadis, A., Brown, W. M. & Kosik, K. S. Structure and novel exons of the human tau gene. Biochemistry 31, 10626–10633 (1992). · DOI
- Jansen, P. R. et al. Genome-wide analysis of insomnia in 1,331,010 individuals identifies new risk loci and functional pathways. Nat. Genet. 51, 394–403 (2019). · DOI
- Desikan, R. S. et al. Genetic overlap between Alzheimer’s disease and Parkinson’s disease at the MAPT locus. Mol. Psychiatry 20, 1588–1595 (2015). · DOI
- Aoki, K. Sexual selection as a cause of human skin colour variation: Darwin’s hypothesis revisited. Ann. Hum. Biol. 29, 589–608 (2002). · DOI
- Lona-Durazo, F. et al. Meta-analysis of GWA studies provides new insights on the genetic architecture of skin pigmentation in recently admixed populations. BMC Genet. 20, 59 (2019). · DOI
- Engelsen, O. The relationship between ultraviolet radiation exposure and vitamin D status. Nutrients 2, 482–495 (2010). · DOI
- Voight, B. F., Kudaravalli, S., Wen, X. & Pritchard, J. K. A map of recent positive selection in the human genome. PLoS Biol. 4, e72 (2006). · DOI
- Wu, H. et al. Transcriptome sequencing to detect the potential role of long noncoding RNAs in salt-sensitive hypertensive rats. BioMed Res. Int. 2019, 2816959 (2019). · DOI
- Wang, L. et al. Peakwide mapping on chromosome 3q13 identifies the kalirin gene as a novel candidate gene for coronary artery disease. Am. J. Hum. Genet. 80, 650–663 (2007). · DOI
- Zhang, K. et al. Genetic implication of a novel thiamine transporter in human hypertension. J. Am. Coll. Cardiol. 63, 1542–1555 (2014). · DOI
- Zang, X.-L. et al. Association of a SNP in SLC35F3 gene with the risk of hypertension in a Chinese Han population. Front. Genet. 7, 108 (2016). · DOI
- Russo, L. et al. Cholesterol 25-hydroxylase (CH25H) as a promoter of adipose tissue inflammation in obesity and diabetes. Mol. Metab. 39, 100983 (2020). · DOI · Paper page
- Demir, A., Kahraman, R., Candan, G. & Ergen, A. The role of FAS gene variants in inflammatory bowel disease. Turk. J. Gastroenterol. 31, 356–361 (2020). · DOI
- Izawa, T. et al. ASXL2 regulates glucose, lipid and skeletal homeostasis. Cell Rep. 11, 1625–1637 (2015). · DOI
- Vazirani, R. P. et al. Disruption of adipose Rab10-dependent insulin signaling causes hepatic insulin resistance. Diabetes 65, 1577–1589 (2016). · DOI
- Thapa, D. et al. The protein acetylase GCN5L1 modulates hepatic fatty acid oxidation activity via acetylation of the mitochondrial β-oxidation enzyme HADHA. J. Biol. Chem. 293, 17676–17684 (2018). · DOI
- Ong, H. S. & Yim, H. C. H. in Regulation of Inflammatory Signaling in Health and Disease (ed. Xu, D.) 153–174 (Springer, 2017). · DOI · Paper page
- Girirajan, S., Campbell, C. D. & Eichler, E. E. Human copy number variation and complex genetic disease. Annu. Rev. Genet. 45, 203–226 (2011). · DOI
- Weise, A. et al. Microdeletion and microduplication syndromes. J. Histochem. Cytochem. 60, 346–358 (2012). · DOI
- Sudmant, P. H. et al. Diversity of human copy number variation and multicopy genes. Science 330, 641–646 (2010). · DOI · Paper page
- Crawford, K. et al. Medical consequences of pathogenic CNVs in adults: analysis of the UK Biobank. J. Med. Genet. 56, 131–138 (2019). · DOI · Paper page
- Corder, E. H. et al. Gene dose of apolipoprotein E type 4 allele and the risk of Alzheimer’s disease in late onset families. Science 261, 921–923 (1993). · DOI · Paper page
- Kolbe, D. et al. Current allele distribution of the human longevity gene APOE in Europe can mainly be explained by ancient admixture. Aging Cell 22, e13819 (2023). · DOI
- Rosenstock, E. et al. Human stature in the Near East and Europe ca. 10,000–1000 bc: its spatiotemporal development in a Bayesian errors-in-variables model. Archaeol. Anthropol. Sci. 11, 5657–5690 (2019). · DOI
- Field, Y. et al. Detection of human adaptation during the past 2000 years. Science 354, 760–764 (2016). · DOI · Paper page
Cited by
Sorted by citations
Brigos-Barril, E., Vasallo, C., Farré, X., Morcillo-Suárez, C., Polo-Alonso, S., Rodríguez-Fernández, B., Valenzuela, A., Sarabia, C., Bosch, E., Laayouni, H., et al. (2026) · Nature Ecology & Evolution · doi:10.1038/s41559-026-03140-z · Cited by 6
Bose, A., Sengupta, M., Maitra, S., Bandyopadhyay, A. R., & Schaschl, H. (2026) · Frontiers in Genetics · doi:10.3389/fgene.2026.1870791 · Cited by 2
Metadata
- Authors
- Irving-Pease, E. K., Refoyo-Martínez, A., Barrie, W., Ingason, A., Pearson, A., Fischer, A., Sjögren, K.-G., Halgren, A. S., Macleod, R., Demeter, F., Henriksen, R. A., Vimala, T., McColl, H., Vaughn, A. H., Speidel, L., Stern, A. J., Scorrano, G., Ramsøe, A., Schork, A. J., Rosengren, A., Zhao, L., Kristiansen, K., Iversen, A. K. N., Fugger, L., Sudmant, P. H., Lawson, D. J., Durbin, R., Korneliussen, T., Werge, T., Allentoft, M. E., Sikora, M., Nielsen, R., Racimo, F., & Willerslev, E.
- ORCID
- Irving-Pease, Evan K.
- Fischer, Anders
- Sjögren, Karl-Göran
- Halgren, Alma S.
- Macleod, Ruairidh
- Henriksen, Rasmus A.
- McColl, Hugh
- Scorrano, Gabriele
- Rosengren, Anders
- Zhao, Lei
- Iversen, Astrid K. N.
- Fugger, Lars
- Sudmant, Peter H.
- Lawson, Daniel J.
- Durbin, Richard
- Korneliussen, Thorfinn
- Werge, Thomas
- Allentoft, Morten E.
- Sikora, Martin
- Nielsen, Rasmus
- Racimo, Fernando
- Willerslev, Eske
- Venue
- Nature
- Published
- 2024-01-10
- Volume
- 625
- Issue
- 7994
- Pages
- 312-320
- ISSN
- 0028-0836
- 1476-4687
- PMC
- PMC10781624
- Cited by
- 126
- References
- 23
- Language
- en
About these checks
Registry, retraction, Cites and statistics results are computed, not judged, with one exception: a printed reference that no index lists is read once by a model before it counts as a citation error. Claims are extracted by a model and kept only when their quote appears verbatim in the text; each cited source is then checked, with a model’s help, for whether it says what the claim relies on. Those verdicts can be wrong — read the claim’s quote and the cited source before relying on one.
Statistics and arithmetic are recomputed, not judged.
Confidence bands are shown only for fields calibrated on our annotated test set. None is calibrated yet, so no band is shown.
What counts as a claim ›How we measure confidence ›How we check this ›
Are you an author, or do you see a problem with this page? Request a review
