

The DOI matches its Crossref record; 100 of the 101 references it cites were found in a registry or an index, and 1 are not checked yet; 2 of the 72 sources its claims cite were checked for support.
Clonal tracing with somatic epimutations reveals dynamics of blood ageing
Open accessPublished version of a preprint
Abstract
Current approaches used to track stem cell clones through differentiation require genetic engineering1,2 or rely on sparse somatic DNA variants3,4, which limits their wide application. Here we discover that DNA methylation of a subset of CpG sites reflects cellular differentiation, whereas another subset undergoes stochastic epimutations and can serve as digital barcodes of clonal identity. We demonstrate that targeted single-cell profiling of DNA methylation5 at single-CpG resolution can accurately extract both layers of information. To that end, we develop EPI-Clone, a method for transgene-free lineage tracing at scale. Applied to mouse and human haematopoiesis, we capture hundreds of clonal differentiation trajectories across tens of individuals and 230,358 single cells. In mouse ageing, we demonstrate that myeloid bias and low output of old haematopoietic stem cells6 are restricted to a small number of expanded clones, whereas many functionally young-like clones persist in old age. In human ageing, clones with and without known driver mutations of clonal haematopoieis7 are part of a spectrum of age-related clonal expansions that display similar lineage biases. EPI-Clone enables accurate and transgene-free single-cell lineage tracing on hematopoietic cell state landscapes at scale. The discovery that DNA methylation of different CpG sites can serve as digital barcodes of clonal identity led to the development of EPI-Clone, an algorithm that enables single-cell lineage tracing through cellular differentiation at scale.
Verified 2026-11-12 · 1 reference not checked yet
Overview
CoChat Summary
Written by AI from the paper’s full text.
TL;DR
The paper introduces EPI-Clone, a transgene-free single-cell lineage-tracing method that uses static CpG methylation epimutations as clonal barcodes while dynamic CpGs report differentiation state. Applied to mouse and human haematopoiesis, it reveals age-related clonal expansions, including HSC-expanded clones in mice and a spectrum of CH and non-CH expansions in humans.
Key findings
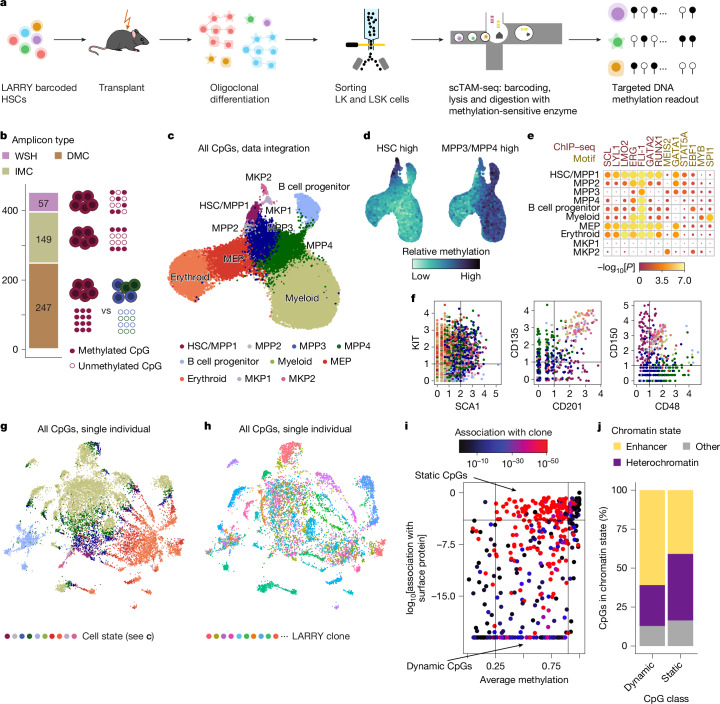
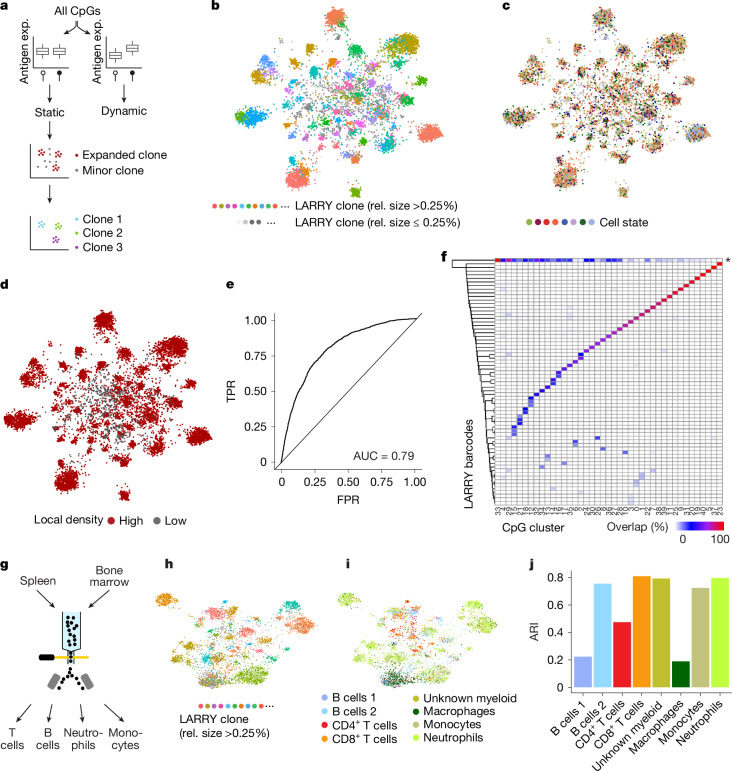
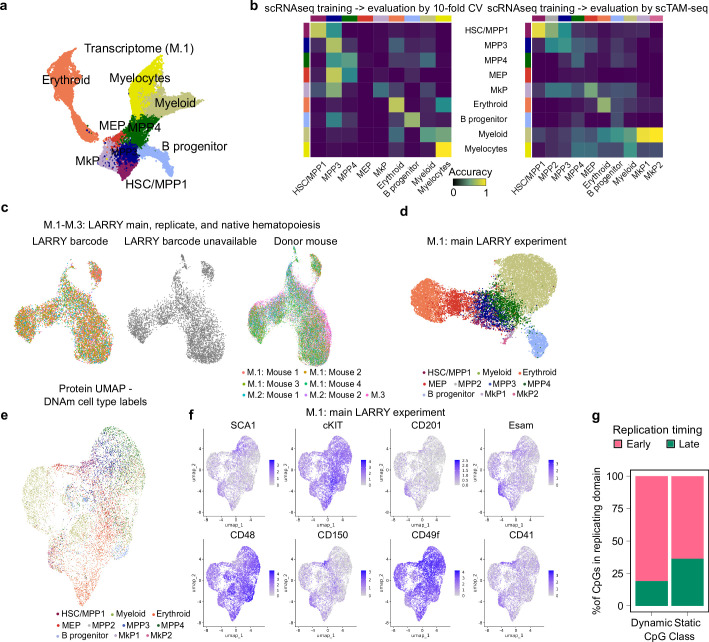
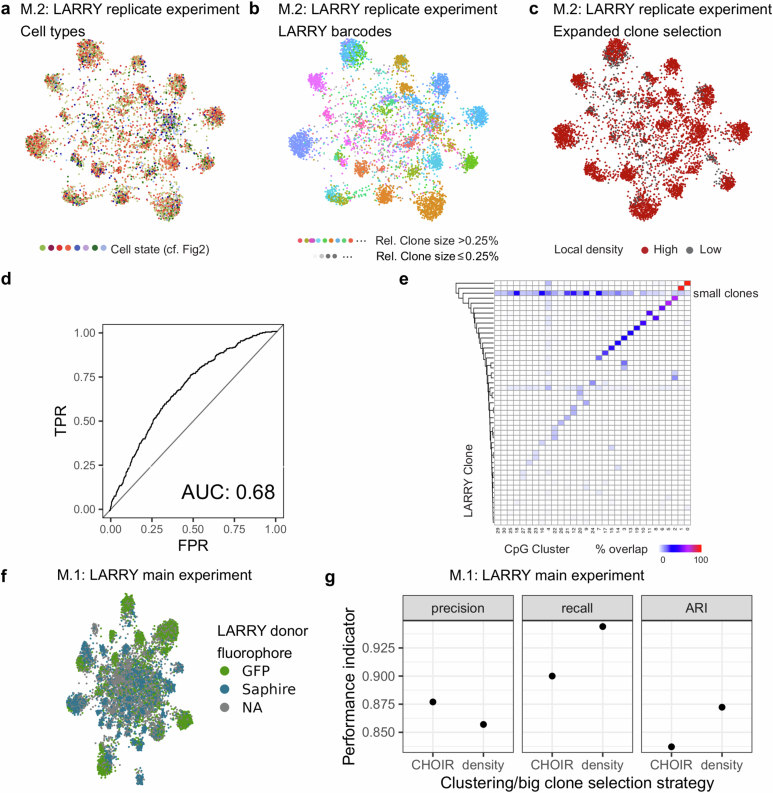
- DNA methylation at static CpGs encodes clonal identity and dynamic CpGs encode differentiation; EPI-Clone identified expanded clones with AUC 0.79 and ARI 0.88 versus LARRY ground truth in experiment M.1, with a biological replicate showing AUC 0.68 and ARI 0.82.
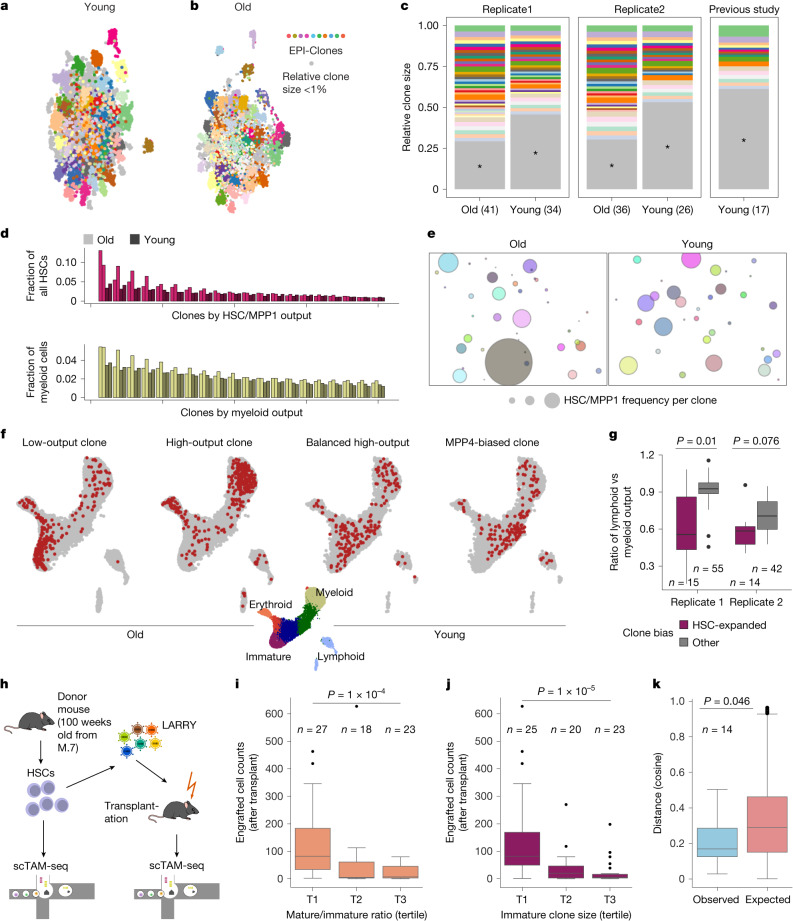
- In mouse ageing, old mice had more expanded clones and individually larger clones than young mice (two-sided Wilcoxon test P = 0.012); rare HSC-expanded clones were mostly myeloid-biased (P = 0.01 replicate 1; P = 0.076 replicate 2) and engrafted poorly.
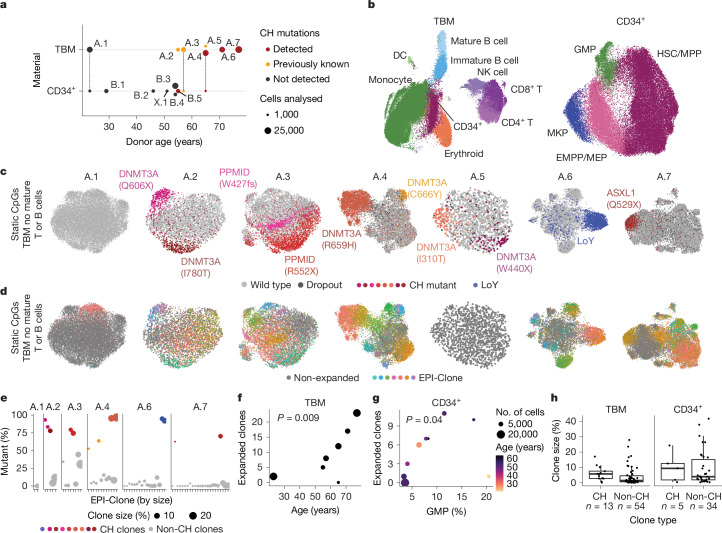
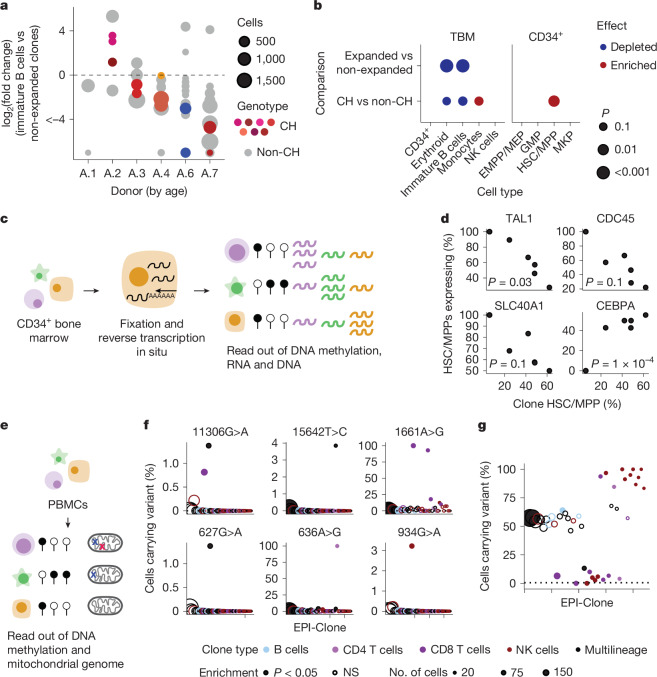
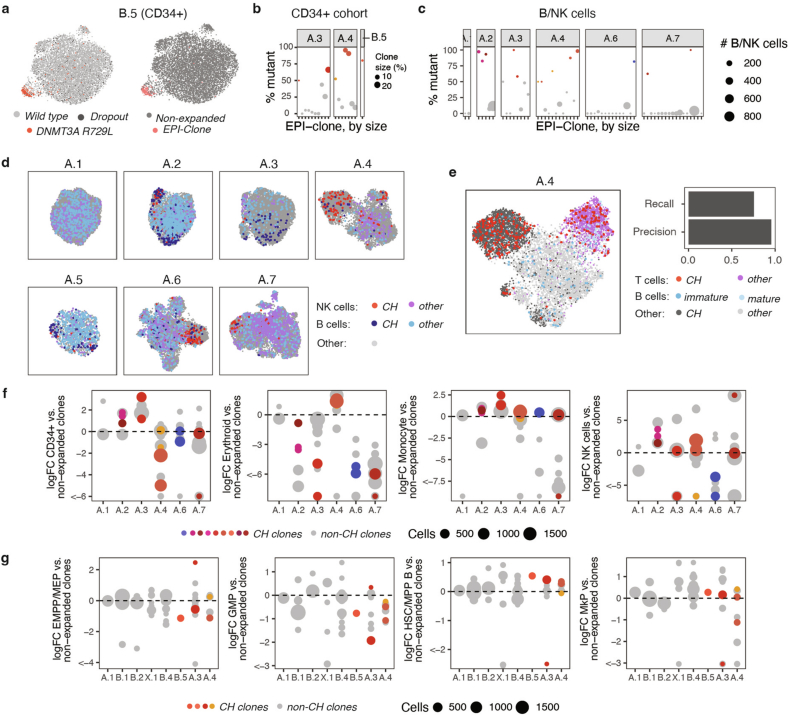
- In human bone marrow, 135,432 single cells were profiled; EPI-Clone recapitulated CH clones in all donors except A.5, CH-dominated clones were on average 78.8% mutant and WT-dominated clones 95.4% wild-type, and 67 other clonal expansions were identified in the seven TBM donors.
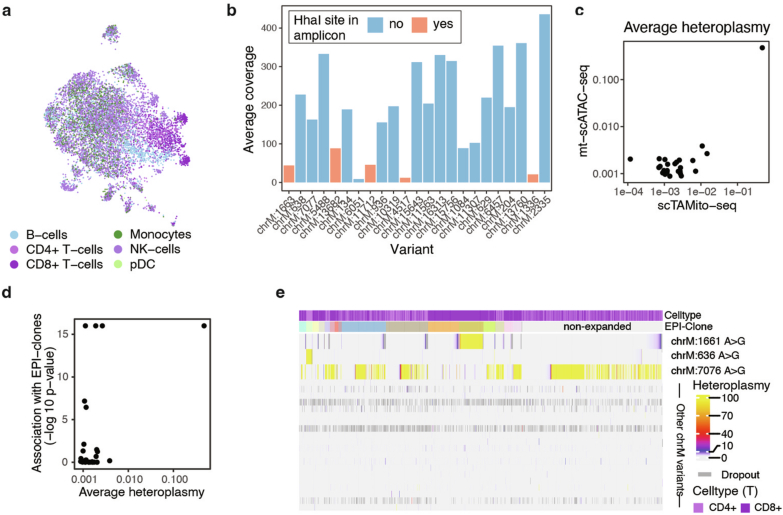
- CH and non-CH clones formed a spectrum of age-related clonal expansions with similar lineage biases; expanded clones were depleted from B cell and erythroid lineages, CH clones were enriched in HSCs/MPPs, and only 5 of 23 previously identified mtDNA variants had clear phylogenetic relationships with EPI-Clone clones, while 16 did not segregate with them.
Methods
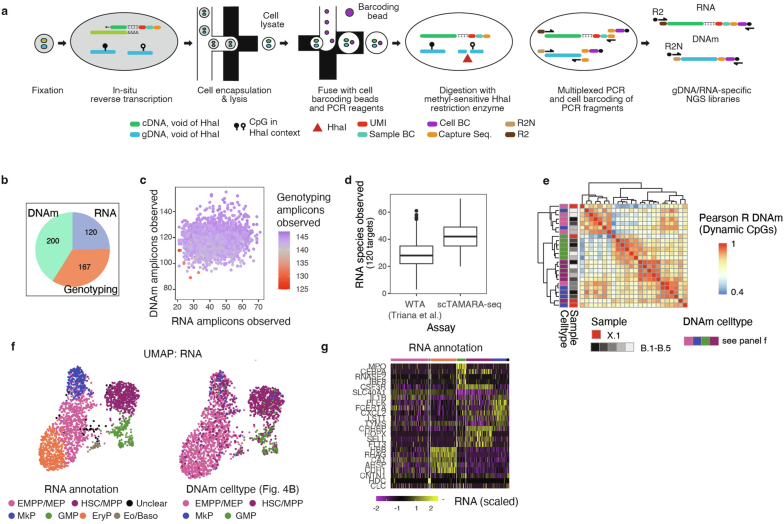
- scTAM-seq was performed on the Mission Bio Tapestri platform with HhaI digestion to read methylation at single-CpG resolution, plus oligonucleotide-tagged surface antibodies; LARRY barcodes, CH mutations, mitochondrial variants, and targeted RNA were read from the same cells in dedicated experiments.
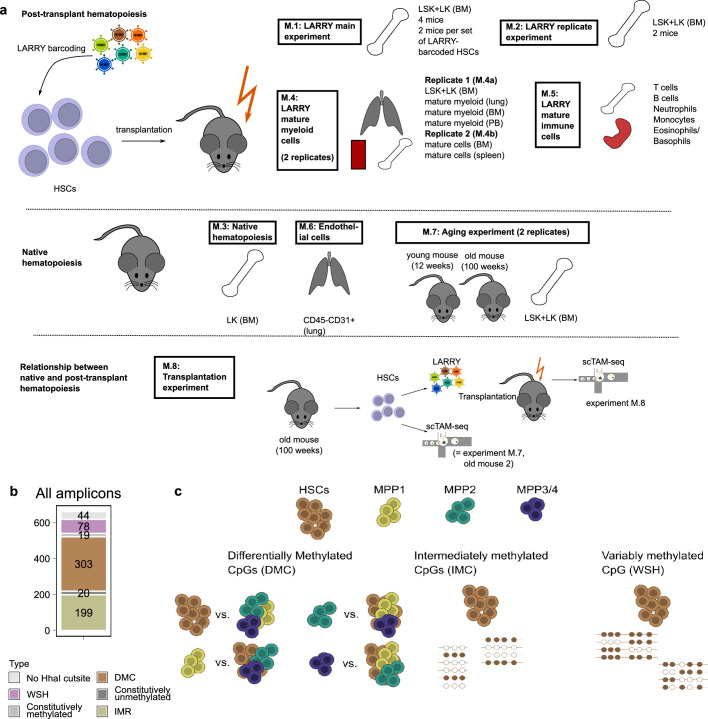
- Mouse experiments M.1–M.8 included LARRY-barcoded HSC transplants, native young and old mice, mature immune and endothelial cells, and an aged-donor transplant; human cohorts A.1–A.7, B.1–B.5, X.1, and X.2 included CD34+-enriched total bone marrow and CD34+ samples, with 230,358 single cells profiled overall.
- EPI-Clone identifies static CpGs by lack of surface-antigen association, detects cells from expanded clones by local density in PCA space or CHOIR, and clusters expanded cells; analyses used Seurat, scanorama, scmap, and mutation calling for CH and mtDNA.
Limitations
- The paper states that EPI-Clone can assign only cells belonging to expanded clones to their clone of origin; cells from very small clones (<0.25% after transplant and <1% in native haematopoiesis) can be identified as not belonging to expanded clones, but their clonal identity cannot be inferred with the cell numbers used.
- The paper also notes that scTAM-seq requires design of a species-specific targeting panel, that donor A.5 was covered with substantially fewer cells, and that CH mutation overlap probably underestimates true overlap owing to allelic dropout.
- Evident from the text: mouse experiments used one or two biological replicates, no randomization or blinding, and no statistical methods for sample size choice; human cohorts were modest in donor number, and some clonal ground truth relied on partial markers such as CH mutations, LoY, or mtDNA variants.
Model-written summary. Check it against the paper before relying on it.
Integrity signals
Registry
Cites
Statistics
Figures
Verification
Claims the paper makes
77 Own result · 33 Own interpretation · 30 Check pending · 21 Own method · 11 Not checked yet · 3 No full text of the sources · 1 Partly supported · 1 No basis given · accuracy not yet measured
A check of a cited source is scheduled, or we don’t hold its full text yet; the claim is checked once it runs.
In the paper
“These clone sizes are in line with a study that genetically barcoded adult haematopoietic clones in situ33 (Fig. 3c).”
§ Clonal tracing with somatic epimutations reveals dynamics of blood ageing > HSC-expanded clones in mouse ageing
What the sources say
- Not checked yetcites [33] Rodriguez-Fraticelli, A. E. et al. Clonal analysis of lineage fate in native haematopoiesis. Nature 553, 212–216 (2018). source
A check is scheduled.
plainstates an association- Asserted: passes — The authors put it forward as true.
- Checkable: passes — It can be checked against evidence.
- Load-bearing: unclear — It is unclear whether the paper’s conclusions depend on it.
- Based: passes — The paper gives a reason why it holds.
- Not checked yet
A result the paper reports from its own data — it cites no other source for it, so there is none to check. The quote shows it is in the paper.
In the paper
“Applied to mouse and human haematopoiesis, we capture hundreds of clonal differentiation trajectories across tens of individuals and 230,358 single cells.”
§ Clonal tracing with somatic epimutations reveals dynamics of blood ageing > Abstract
plain- Asserted: passes — The authors put it forward as true.
- Checkable: passes — It can be checked against evidence.
- Load-bearing: passes — The paper’s conclusions depend on it.
- Based: passes — The paper gives a reason why it holds.
A result the paper reports from its own data — it cites no other source for it, so there is none to check. The quote shows it is in the paper.
In the paper
“When comparing the EPI-Clone result, we observed more expanded clones in the old mice than in the young mice (Fig. 3c and Supplementary Figs. 6 and 7).”
§ Clonal tracing with somatic epimutations reveals dynamics of blood ageing > HSC-expanded clones in mouse ageing
plainstates an association- Asserted: passes — The authors put it forward as true.
- Checkable: passes — It can be checked against evidence.
- Load-bearing: passes — The paper’s conclusions depend on it.
- Based: passes — The paper gives a reason why it holds.
A result the paper reports from its own data — it cites no other source for it, so there is none to check. The quote shows it is in the paper.
In the paper
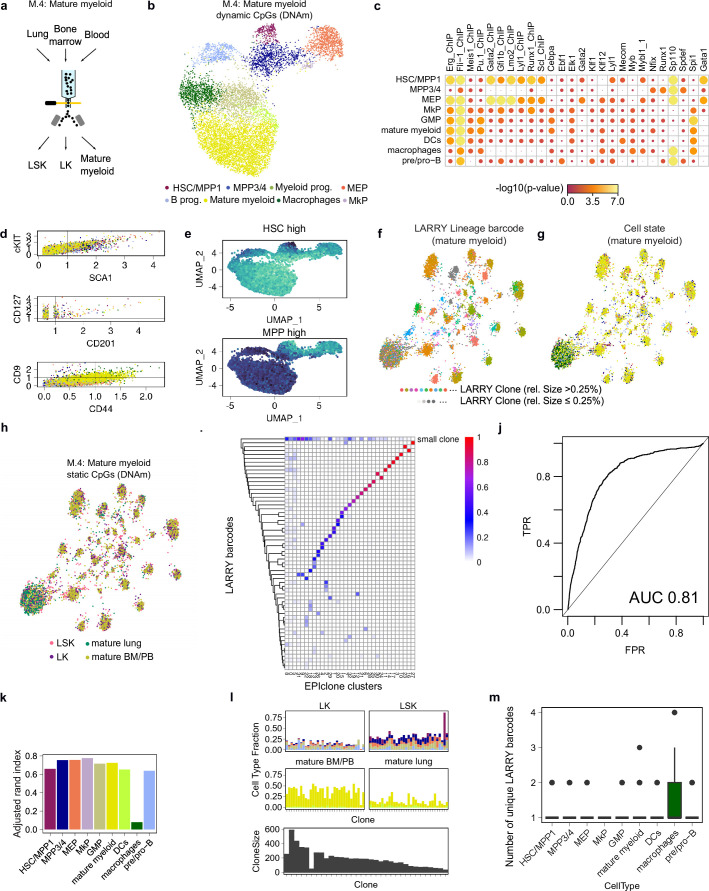
“Using the static CpGs defined from experiment M.1, EPI-Clone again produced clonal clustering that recapitulated ground-truth clonal labels (Fig. 2h).”
§ Clonal tracing with somatic epimutations reveals dynamics of blood ageing > The EPI-Clone algorithm
plainstates an association- Asserted: passes — The authors put it forward as true.
- Checkable: passes — It can be checked against evidence.
- Load-bearing: passes — The paper’s conclusions depend on it.
- Based: passes — The paper gives a reason why it holds.
A check of a cited source is scheduled, or we don’t hold its full text yet; the claim is checked once it runs.
In the paper
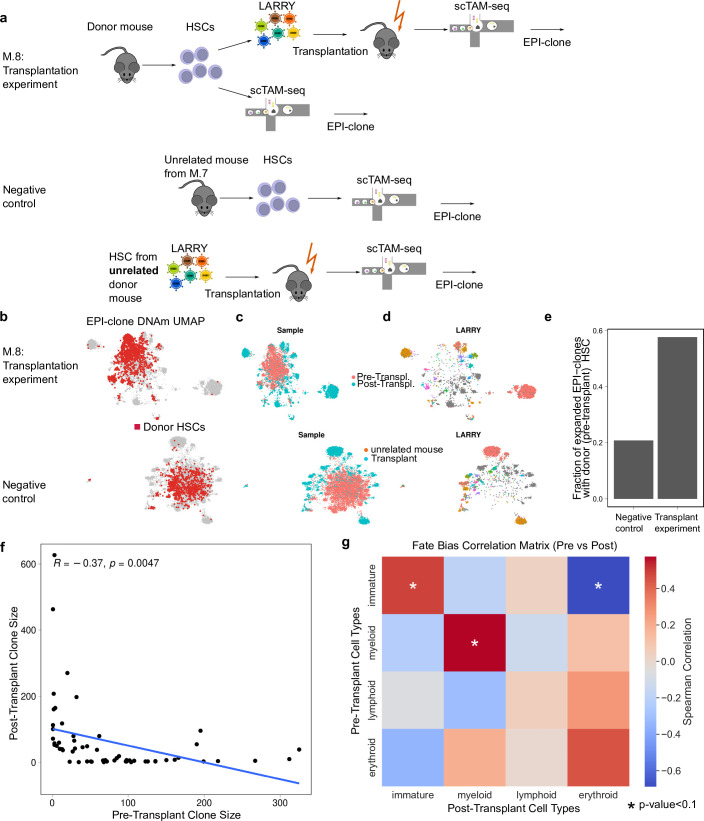
“HSCs with abundant progeny before transplant showed poor engraftment, a result in line with serial transplantation studies using lentiviral barcoding8,33 (Fig. 3i and Extended Data Fig. 6f).”
§ Clonal tracing with somatic epimutations reveals dynamics of blood ageing > HSC-expanded clones in mouse ageing
What the sources say
- Not checked yetcites [8] Weinreb, C., Rodriguez-Fraticelli, A., Camargo, F. D. & Klein, A. M. Lineage tracing on transcriptional landscapes links state to fate during differentiation. Science 367, eaaw3381 (2020). source
A check is scheduled.
- Not checked yetcites [33] Rodriguez-Fraticelli, A. E. et al. Clonal analysis of lineage fate in native haematopoiesis. Nature 553, 212–216 (2018). source
A check is scheduled.
plainstates an associationSingle case- Asserted: passes — The authors put it forward as true.
- Checkable: passes — It can be checked against evidence.
- Load-bearing: passes — The paper’s conclusions depend on it.
- Based: passes — The paper gives a reason why it holds.
- Not checked yet
- Probably not a substantial claim. 38
- It may state two separate claims as one. 58
- The quote only partly states this claim. 1
Create a free account to see these claims.
Create a free account to see these assumptions.
81 more claims
Create a free account to see all 177 claims and to verify the 62 references still open.
Citations
Cites
Integrated analysis of multimodal single-cell data
Hao, Y., Hao, S., Andersen-Nissen, E., Mauck, W. M., Zheng, S., Butler, A., Lee, M. J., Wilk, A. J., Darby, C., Zagar, M., et al. (2020) · doi:10.1101/2020.10.12.335331 · Cited by 15,508
Comprehensive Integration of Single-Cell Data
Stuart, T., Butler, A., Hoffman, P., Hafemeister, C., Papalexi, E., Mauck, W. M., Hao, Y., Stoeckius, M., Smibert, P., & Satija, R. (2019) · Cell · doi:10.1016/j.cell.2019.05.031 · Cited by 15,453
ggplot2: Elegant Graphics for Data Analysis
Wickham, H. (2009) · doi:10.1007/978-0-387-98141-3 · Cited by 14,447
Fast, sensitive and accurate integration of single-cell data with Harmony
Korsunsky, I., Millard, N., Fan, J., Slowikowski, K., Zhang, F., Wei, K., Baglaenko, Y., Brenner, M., Loh, P.-R., & Raychaudhuri, S. (2019) · Nature Methods · doi:10.1038/s41592-019-0619-0 · Cited by 10,488
Complex heatmaps reveal patterns and correlations in multidimensional genomic data
Gu, Z., Eils, R., & Schlesner, M. (2016) · Bioinformatics · doi:10.1093/bioinformatics/btw313 · Cited by 10,178
Hafemeister, C., & Satija, R. (2019) · Genome Biology · doi:10.1186/s13059-019-1874-1 · Cited by 4,479 · cited 1×
“To generate a low-dimensional representation of the protein data only, we opted to use SCTransform 64 , which produced an improved cell-state resolution.”
Single-Cell Transcriptome Atlas of Murine Endothelial Cells
Kalucka, J. M., de Rooij, L. P. M. H., Goveia, J., Rohlenová, K., Dumas, S. J., Meta, E., Conchinha, N. V., Taverna, F., Teuwen, L.-A. M. N., Veys, K., et al. (2020) · Cell · doi:10.1016/j.cell.2020.01.015 · Cited by 1,385
Clonal hematopoiesis in human aging and disease
Jaiswal, S., & Ebert, B. L. (2019) · Science · doi:10.1126/science.aan4673 · Cited by 1,156 · cited 1×
“6 and 7).”
Cell intrinsic alterations underlie hematopoietic stem cell aging
Rossi, D. J., Bryder, D., Zahn, J. M., Ahlenius, H., Sonu, R., Wagers, A. J., & Weissman, I. L. (2005) · Proceedings of the National Academy of Sciences · doi:10.1073/pnas.0503280102 · Cited by 1,152
Efficient integration of heterogeneous single-cell transcriptomes using Scanorama
Hie, B., Bryson, B., & Berger, B. (2019) · Nature Biotechnology · doi:10.1038/s41587-019-0113-3 · Cited by 974
Cited by
Epigenomic heterogeneity as a source of tumour evolution
Laisné, M., Lupien, M., & Vallot, C. (2024) · Nature reviews. Cancer · doi:10.1038/s41568-024-00757-9 · Cited by 100
Prummel, K. D., Woods, K., Kholmatov, M. M., Schmitt, E. C., Vlachou, E. P., Labyadh, M., Wehner, R., Poschmann, G., Stühler, K., Winter, S., et al. (2025) · Nature Communications · doi:10.1038/s41467-025-65803-y · Cited by 31
Sadiq, I. Z., Abubakar, F. S., Katsayal, B. S., Ibrahim, B., Adamu, A., Usman, M. A., Aliyu, M., Suleiman, M. A., & Muhammad, A. (2025) · Biomedical Engineering Advances · doi:10.1016/j.bea.2025.100172 · Cited by 26
New frameworks for hematopoiesis derived from single-cell genomics
Safina, K. R., & van Galen, P. (2024) · Blood · doi:10.1182/blood.2024024006 · Cited by 25
García, J. H. G. F., Valsecchi, C. I. K., & Basilicata, M. F. (2024) · Open Biology · doi:10.1098/rsob.240177 · Cited by 17
Redefining cellular reprogramming with advanced genomic technologies
Morris, S. A. (2025) · Nature Reviews Genetics · doi:10.1038/s41576-025-00899-y · Cited by 16
Aging of the Hematopoietic System: Mechanisms, Consequences, and Systemic Interactions
Miyawaki, M., Hashimoto, S., Ogawa, S., & Kase, Y. (2026) · Aging Cell · doi:10.1111/acel.70385 · Cited by 13
Charting single-cell lineages with synthetic and natural barcodes
Rodriguez-Fraticelli, A., & Parreno, V. (2026) · Nature Reviews Genetics · doi:10.1038/s41576-026-00943-5 · Cited by 12
Self-citationEvolving strategies for lineage tracing: Genetic markers, synthetic barcodes, and natural variants
Kang, Z., Chen, H., Li, S., Wang, S., & Zhou, B. (2026) · Cell stem cell · doi:10.1016/j.stem.2026.05.001 · Cited by 11
EpiCHAOS: a metric to quantify epigenomic heterogeneity in single-cell data
Kelly, K., Scherer, M., Braun, M. M., Lutsik, P., & Plass, C. (2024) · Genome biology · doi:10.1186/s13059-024-03446-w · Cited by 10
Self-citationStable clonal contribution of lineage-restricted stem cells to human hematopoiesis
Yoshizato, T., Nilsson, C. C., Grasso, F., Högstrand, K., Mazzi, S., Winroth, A., Lehander, M., Barbosa, I., Walldin, G., Blanco, T. M., et al. (2025) · Nature Genetics · doi:10.1038/s41588-025-02405-w · Cited by 9
Hartmann, M., Schönung, M., Rajak, J., Maurer, V., Hai, L., Bauer, K., Hakobyan, M., Stäble, S., Langstein, J., Jardine, L., et al. (2025) · Blood Cancer Discovery · doi:10.1158/2643-3230.bcd-25-0246 · Cited by 9
Self-citationComputational approaches for multimodal lineage tracing
Wang, K., He, X., & Hu, Z. (2026) · Nature Reviews Genetics · doi:10.1038/s41576-026-00969-9 · Cited by 7
Watt, S. M., & Roubelakis, M. G. (2025) · International Journal of Molecular Sciences · doi:10.3390/ijms26020671 · Cited by 7
Resolving leukemic stem cell heterogeneity and plasticity with single-cell multiomics
Huang, F. Y., Trumpp, A., & Stelmach, P. (2025) · Seminars in Hematology · doi:10.1053/j.seminhematol.2025.07.001 · Cited by 7
Mitochondrial clone tracing within spatially intact human tissuesPreprint
Bracht, S. A., Rong, J., Gier, R. A., DeMarshall, M., Golden, H., Dhakal, D., McDevitt, J. C., Mo, F., Furth, E. E., Strauss, A. L., et al. (2025) · bioRxiv (Cold Spring Harbor Laboratory) · doi:10.1101/2025.07.11.664452 · Cited by 7
Lineage tracing from cellular heritage to disease destiny
Zhu, H., Liu, X., Tang, M., Lui, K. O., & Zhou, B. (2026) · Nature Genetics · doi:10.1038/s41588-026-02628-5 · Cited by 6
Ontogenetic drivers of neutrophil heterogeneity
Hageb, A., Farjia, M., Osei-Sarpong, C., & Silvestre-Roig, C. (2025) · Experimental Hematology · doi:10.1016/j.exphem.2025.104863 · Cited by 6
Methylation Data Analysis and Interpretation
Zhu, Y., Mao, W., Hosseini, R., & Chikina, M. D. (2025) · Annual Review of Biomedical Data Science · doi:10.1146/annurev-biodatasci-120924-091033 · Cited by 6
Cardiopulmonary neuro-immune reflex: From afferent stress signaling to peripheral myeloid memory
Sugita, J., Chen, Z., Setoguchi, N., Goto, K., Kobayashi, A., Kani, K., Yang, Y., Ku, J., Ueno, K., Uchida, R., et al. (2025) · Journal of Cardiology · doi:10.1016/j.jjcc.2025.08.013 · Cited by 5
Lin, Y., Chen, X., Wu, L., Zhou, Y., & Lin, Y. (2026) · Cell Systems · doi:10.1016/j.cels.2026.101621 · Cited by 4
Clonal tracing of blood stem cells across mouse and human lifespans
Rodriguez-Fraticelli, A. (2025) · Blood · doi:10.1182/blood.2024028195 · Cited by 4
Self-citationDNA methylation meets lineage tracing: History, recent progress, and future directions
Fu, R., Chen, M., & Wang, S. (2025) · Quantitative Biology · doi:10.1002/qub2.70017 · Cited by 4
Ganuza, M., & Yoshimoto, M. (2025) · Experimental Hematology · doi:10.1016/j.exphem.2025.105352 · Cited by 4
Blood-based epigenetic instability linked to human aging and disease
Basrai, S., Nofech-Mozes, I., Detroja, R., Scolari, F. L., Bakhtiari, M., Arruda, A., Murphy, T., Bratman, S. V., Chan, S. M., Minden, M. D., et al. (2026) · Nature Communications · doi:10.1038/s41467-026-69430-z · Cited by 4
Spatio-DARLIN enables robust and efficient in situ lineage tracing in mice at single-cell resolution
Gao, J., Zhang, Z., Chen, D., Diao, S., Liu, S., Wang, S., & Li, L. (2026) · Nature Methods · doi:10.1038/s41592-026-03151-5 · Cited by 4
Modeling mitochondrial inheritance enables high-precision single-cell lineage tracing in humansPreprint
Gao, T. F., Weng, C., Johnson, I., Poeschla, M., Gudera, J. A., King, E. A., Rouya, C., Donovan, A., Bourke, L., Shao, Y., et al. (2026) · bioRxiv (Cold Spring Harbor Laboratory) · doi:10.64898/2026.02.12.705660 · Cited by 4
Decoding the tumor-aging axis: from bench to clinical
Wang, Y., Lv, G., Gao, X., Zheng, J. H., Huang, J., & Wang, Z. (2026) · Frontiers in Immunology · doi:10.3389/fimmu.2026.1823423 · Cited by 2
Kim, I. S. (2026) · Molecular Oncology · doi:10.1002/1878-0261.70303 · Cited by 2
A single-cell lens into the co-evolution of genotypes and phenotypes in cancer
Izzo, F., Prieto, T., Potenski, C. J., & Landau, D. A. (2026) · Nature reviews. Cancer · doi:10.1038/s41568-026-00970-8 · Cited by 2
Probabilistic cell lineage inference from mitochondrial mutationsPreprint
Seidel, S., Hård, J., Ferreira, P., Berkes, P., Jahn, K., Eriksson, C., Mold, J. E., Michaëlsson, J., Kuipers, J., & Beerenwinkel, N. (2025) · bioRxiv (Cold Spring Harbor Laboratory) · doi:10.1101/2025.02.28.640740 · Cited by 2
Hackett, S., Boniface, C. T., Fonseca, A. V. A., Ramos-Yamasaki, A. D., Watson, C. J., Bazin, H. M. L. *., Tan, A. B., Yu, H. L. L., Hanssen, L. L. P., Dev, H., et al. (2026) · bioRxiv (Cold Spring Harbor Laboratory) · doi:10.64898/2026.02.23.707349 · Cited by 2
Nongenetic evolution of the tumor: from challenges to new therapeutic opportunities
Oricchio, E. (2024) · Molecular Oncology · doi:10.1002/1878-0261.13753 · Cited by 1
Cossa, A., Dalmasso, A., Campani, G., Bugani, E., Caprioli, C., Bulla, N., Tirelli, A., Zhan, Y., & Pelicci, P. G. (2026) · Nature Communications · doi:10.1038/s41467-026-71607-5 · Cited by 1
Conventional and Alternative B Lymphopoiesis: Multiple Roads to Immunity
Chiron, A., Bessoles, S., Sarrabayrouse, G., Krzysiek, R., & Hacein‐Bey‐Abina, S. (2025) · Stem Cell Reviews and Reports · doi:10.1007/s12015-025-10999-1 · Cited by 1
Lineage-tracing technology for decoding cell evolution in pathophysiology: a bibliometric analysis
Zhang, L., Wang, X., Wang, S., Ma, Y., Cao, Y., Zhang, X., Lu, Y., Wang, S., & Wang, Y. (2025) · International Journal of Surgery · doi:10.1097/js9.0000000000003916 · Cited by 1
Methylation-based lineage tracing in cancer
Chen, J., Wu, B. Z., & Gaiti, F. (2025) · Blood · doi:10.1182/blood.2024028196 · Cited by 1
Wang, Q., Sun, X., Han, X., Zhang, X., Wang, W., Wang, H., Ren, H., & Gu, L. (2026) · MedComm – Oncology · doi:10.1002/mog2.70054 · Cited by 1
Plasticity and stringency: rethinking stem cell division modes
Bener, M. B., & Inaba, M. (2026) · Biochemical Society Transactions · doi:10.1042/bst20250202 · Cited by 1
Ph-chromosome-negative myeloproliferative neoplasms: clonal dynamics are the name of the game
Noorafrooz, M., Noorafrooz, R., Barosi, G., & Gale, R. P. (2026) · Blood Reviews · doi:10.1016/j.blre.2026.101385 · Cited by 1
Retrospective single cell lineage tracing with highly mutable homopolymers
Cheng, P.-C., Kamenev, D., Kameneva, P., Fitzpatrick, C., Adameyko, I. I., Kharchenko, P. V., & Zhang, K. (2026) · Nature Communications · doi:10.64898/2026.03.10.709901 · Cited by 1
Aging mechanisms and rejuvenation strategies for hematopoietic stem cells
Zhang, Y., Xu, Y., Shi, W., Cao, D., Guo, D.-A., & Yue, R. (2026) · Genome biology · doi:10.1186/s13059-026-04119-6 · Cited by 1
Bueno-Costa, A., Campillo‐Marcos, I., Casado-Peláez, M., Yassine, K., Noguera‐Castells, A., Zamora, L., Xicoy, B., Solé, F. G., Mata, C., Park, J., et al. (2026) · Leukemia · doi:10.1038/s41375-026-03015-z · Cited by 1
Unlocking the curative potential of gene transfer and editing for hematopoietic disorders
Shiroshita, K., Stolz, A., Malouf, C., Tran, V. L., Li, J., Weiss, M. J., & Naldini, L. (2026) · Experimental Hematology · doi:10.1016/j.exphem.2026.105493 · Cited by 1
Inference of clonal hematopoiesis using the collective behaviour of DNA methylation statesPreprint
Crofts, S., Grenko, C. M., Robertson, N. A., Kirschner, K., & Chandra, T. (2025) · bioRxiv (Cold Spring Harbor Laboratory) · doi:10.1101/2025.11.18.689122 · Cited by 1
X-CODE: a dual RNA barcoding system for multi-platform clonal tracking and spatial phenotypingPreprint
Rota, R., Flittner, E., Tartagni, M., Bourdim, M., Westlund, E., McKenzie, J. S., Devlin, A. J., Thankamony, A. P., Pandell, N., Gabel, F., et al. (2026) · bioRxiv (Cold Spring Harbor Laboratory) · doi:10.64898/2026.02.10.705126 · Cited by 1
Architectural fragility of gene regulatory networks underlies hematopoietic stem cell agingPreprint
Stevens, H. P., Yücel, A. D., Gould, R. A., Cai, G., Gladyshev, V. N., Pleşa, A. M., & Church, G. M. (2026) · bioRxiv (Cold Spring Harbor Laboratory) · doi:10.64898/2026.06.03.729976 · Cited by 1
Molecular mechanisms involved in the expansion of Tet2-/- hematopoietic stem cells upon stresses
Stolz, A. (2024) · theses.fr (ABES) · doi:10.70675/1570a347zc84az4834z8b5cz8e7395385c5b
Heterogeneity in platelet differentiation pathways
Winroth, A. (2025) · doi:10.69622/29064818
Epigenetic clues from cancer’s past foretell its future
Lutsik, P., Manojlović, V., & Vassiliou, G. S. (2025) · Nature · doi:10.1038/d41586-025-02256-9
Intermediately Methylated Regions in Normal Cells Are Epimutation Hotspots in CancerPreprint
Mahgoub, M., Abel, H., Davarapalli, N., Struthers, H., Kotnik, E. N., Johnson, B., Markovic, C., Fronick, C. C., Fulton, R. S., Meers, M. P., et al. (2025) · bioRxiv (Cold Spring Harbor Laboratory) · doi:10.1101/2025.09.18.677221
Lineage bias in hematopoietic stem cells: more niche or intrinsic factors?
Hayal, T. B., & Wu, C. (2025) · Haematologica · doi:10.3324/haematol.2025.288704
Weinstock, J. S., Conneely, K. N., Woo, J., Arvanitis, M., Machiela, M. J., & Russell, C. (2025) · medRxiv · doi:10.1101/2025.10.12.25337792
Bacterial exposure shapes the trajectory of immune ageingPreprint
Feldman, E., Hrúzik, M., Maecker, H. T., Roulet, A., Lelouvier, B., Milman, N., Lukačišin, M., & Shen-Orr, S. S. (2025) · bioRxiv (Cold Spring Harbor Laboratory) · doi:10.1101/2025.10.10.681722
Hematopoietic (stem) cells—The elixir of life?
Cerezo, E. L., Anderson, J., Vedrenne, E. D., Martín, N. Y., & Lengefeld, J. (2025) · FEBS Letters · doi:10.1002/1873-3468.70215
Bhuyan, G. S. (2025) · UNSWorks (University of New South Wales, Sydney, Australia) · doi:10.26190/unsworks/31517
Decoding the regulatory grammar of hematopoiesis using synthetic enhancers
Frömel, R. U. (2024) · Repositori digital de la UPF (Universitat Pompeu Fabra)
Self-citationBianchi, A. (2024) · Repositori digital de la UPF (Universitat Pompeu Fabra)
Self-citationSingleCellMQC: A comprehensive quality control workflow for single-cell multi-omics
Ji, D., Han, M., Lu, S., Zeng, J., & Zhong, W. (2026) · iScience · doi:10.1016/j.isci.2026.117398
scDNA: Single Cell DNA analysis software toolkit for subclonality discovery and assessmentPreprint
Bowman, M., Gounder, S. D., Singh, V., Shestova, O. E., Robinson, T. M., Zhang, A. X. W., Gandhi, A., Bandopadhyay, R., Cai, S. F., Levine, R. L., et al. (2025) · bioRxiv (Cold Spring Harbor Laboratory) · doi:10.64898/2025.12.19.694255
TimeFlow 2: An Unsupervised Cell Lineage Detection Method for Flow Cytometry Data
Liarou, M., Matthes, T., & Marchand‐Maillet, S. (2026) · Cytometry Part A · doi:10.1002/cytoa.70006
Charting clonal evolution and behavior with GoT-Multi
Gudera, J. A., & Sankaran, V. G. (2026) · Cell Genomics · doi:10.1016/j.xgen.2025.101077
Basic Research Advances and Clinical Implications of Tumor-Aging Interactions
王, 羽. (2026) · World Journal of Cancer Research · doi:10.12677/wjcr.2026.161005
Improving lymphopoiesis in aged bone marrow
Konturek-Cieśla, A., & Bryder, D. (2026) · Current Opinion in Hematology · doi:10.1097/moh.0000000000000923
Tissue Coordination in Aging and DiseasePreprint
Cleal, K. (2026) · Preprints.org · doi:10.20944/preprints202603.2059.v1
Tissue Coordination in Aging and DiseasePreprint
Cleal, K. (2026) · Preprints.org · doi:10.20944/preprints202603.2059.v2
Chemotherapy reshapes cellular clonal landscape via persister programs in breast cancer xenograftsPreprint
Kronheim, S., Wang, J. C. M., Chen, J. Y., Guerrero-Romero, D., Chin, S., Lerda, G., Lui, A. J. W., Rueda, O. M., Gaiti, F., Caldas, C., et al. (2026) · bioRxiv (Cold Spring Harbor Laboratory) · doi:10.64898/2026.04.02.716097
Destici, E., Mendenhall, E. M., & Goren, A. (2026) · Frontiers in Epigenetics and Epigenomics · doi:10.3389/freae.2026.1754553
Reconstruction of Tumor Evolution: Bulk Versus Single-Cell Approach
Xiao, J., He, K., Su, P., Zhu, J., Wang, N., Han, Z., & Su, X. (2026) · Journal of Shanghai Jiaotong University (Science) · doi:10.1007/s12204-026-2914-0
Stacpoole, Q., Iannarella, N., Johanson, T. M., Coughlan, H. D., & Allan, R. S. (2026) · bioRxiv (Cold Spring Harbor Laboratory) · doi:10.64898/2026.04.19.719299
Lu, X., Fang, H., Liu, Y., Liu, C., Fang, X., Matsunaga, A., Mori, S. F., Zhang, T., Wang, G., Zhou, G. I., et al. (2026) · MedComm · doi:10.1002/mco2.70747
Wen, S., Campos, R., Karpiński, M., Sharma, R., Manojlović, V., Deevi, S. V. V., O’Dell, S., Li, X., Hu, F., O’Connell, J., et al. (2026) · medRxiv · doi:10.64898/2026.05.17.26353391
Conception-calibrated male pediatric tumor mitotic clocks
John, J. V., & Shibata, D. (2026) · Communications Biology · doi:10.1038/s42003-026-10480-w
Transcriptional heterogeneity predicts and enables clonal selection in ageing haematopoiesisPreprint
Li, S., Dominici, M. D., Chen, K., Chen, X., Liu, Y., Zhang, Q., Chavez, J. S., Chen, X., Roeder, T. J., Oguro, H., et al. (2026) · Research Square · doi:10.21203/rs.3.rs-10046174/v1
Cell lineage tracing: How DNA-barcoding technologies reveal the secrets of ontogenesis
Drach, M., Shkarina, L. N., Бозов, К. Д., Primak, A. L., & Karagyaur, M. N. (2026) · Регенерация органов и тканей. · doi:10.60043/2949-5938-2026-1-6-23
Eggle, M., Mayakonda, A., Bartenhagen, C., Höfer, T., Westermann, F., & Körber, V. (2026) · bioRxiv (Cold Spring Harbor Laboratory) · doi:10.64898/2026.07.24.740074
Self-citationSun, L., Chen, D., Zhang, X., Fan, H., Zhao, Y., Huang, Y., Wu, Y., Lou, Y., & Zhang, D. (2026) · BMC Genomics · doi:10.1186/s12864-026-13224-6
RNA Prominence in the Expanded Central Molecular Biology Dogma
Haseltine, W. A., & Patarca, R. (2026) · Springer eBooks · doi:10.1007/978-3-032-31089-7_4
Embracing non-linearity in human ageing
Grolaux, R., Teschendorff, A. E., & Eynon, N. (2026) · Nature Reviews Genetics · doi:10.1038/s41576-026-00993-9
Cell Lineage Tracing: How DNA-Barcoding Technologies Reveal the Secrets of Ontogenesis
Drach, M., Shkarina, L. N., Бозов, К. Д., Primak, A. L., & Karagyaur, M. N. (2026) · Cell and Tissue Biology · doi:10.1134/s1990519x26060027
Liu, Y., Park, J., Amaya, L., Junyent, S., Sun, X., Xiao, J. S., Wang, Y., Wang, H., Lu, Y., Nakagawa, S., et al. (2026) · bioRxiv (Cold Spring Harbor Laboratory) · doi:10.64898/2026.10.06.756974
Scalable methylome-transcriptome profiling resolves clonal organization in human hematopoiesisPreprint
Shao, J., Chen, M., Liu, Y., Sun, J., Zhang, G., Zheng-yi, Y., Lin, H., Ren, M., Pei, S., Peng, J., et al. (2026) · bioRxiv (Cold Spring Harbor Laboratory) · doi:10.64898/2026.10.08.757494
Tissue coordination in ageing and disease
Cleal, K. (2026) · Ageing Research Reviews · doi:10.1016/j.arr.2026.103422
Velten, L., Bowness, J. S., Martinez, A. B., Bařinka, J., Schulte-Schrepping, J., Renders, S., Waclawiczek, A., Leppä, A., Trumpp, A., Raffel, S., et al. (2026) · Experimental Hematology · doi:10.1016/j.exphem.2026.105524
Self-citationIdentifying novel anti-ageing targets for the epigenetic reprogramming of hematopoietic stem cells
Stacpoole, Q. (2026) · Minerva Access (University of Melbourne)
Single-cell tumour phylogenetics
Gawron, J., Kuipers, J., Li, A., Raphael, B. J., Markowetz, F., & Beerenwinkel, N. (2026) · Nature reviews. Cancer · doi:10.1038/s41568-026-00992-2
The self-renewing lymphoid-biased hematopoietic stem cells support long-term lymphopoiesis in micePreprint
Ma, Y., Li, X., Li, X., Wang, L., Xu, Y., Zhai, J., Wang, J., Lan, Y., Zhou, B., Cheng, T., et al. (2026) · bioRxiv (Cold Spring Harbor Laboratory) · doi:10.64898/2026.11.02.763559
Ueno, K., & Nakayama, Y. (2026) · Frontiers in Cardiovascular Medicine · doi:10.3389/fcvm.2026.2002298
Metadata
- Authors
- Scherer, M., Singh, I., Braun, M. M., Szu-Tu, C., Sanchez Sanchez, P., Lindenhofer, D., Jakobsen, N. A., Körber, V., Kardorff, M., Nitsch, L., Kautz, P., Rühle, J., Bianchi, A., Cozzuto, L., Frömel, R., Beneyto-Calabuig, S., Lareau, C., Satpathy, A. T., Beekman, R., Steinmetz, L. M., Raffel, S., Ludwig, L. S., Vyas, P., Rodriguez-Fraticelli, A., & Velten, L.
- Affiliations
- German Cancer Research Center (DE)
- Institute for Research in Biomedicine (ES)
- Universitat Pompeu Fabra (ES)
- German Centre for Cardiovascular Research (DE)
- University of Oxford (GB)
- University Hospital Heidelberg (DE)
- Max Delbrück Center (DE)
- Barcelona Institute of Science and Technology (ES)
- Memorial Sloan Kettering Cancer Center (US)
- Parker Institute for Cancer Immunotherapy (US)
- Institució Catalana de Recerca i Estudis Avançats (ES)
- Corresponding author
- Rodriguez-Fraticelli, Alejo
- Velten, Lars
- ORCID
- Scherer, Michael
- Singh, Indranil
- Braun, Martina Maria
- Sanchez Sanchez, Pedro
- Lindenhofer, Dominik
- Jakobsen, Niels Asger
- Körber, Verena
- Kardorff, Michael
- Nitsch, Lena
- Kautz, Pauline
- Rühle, Julia
- Bianchi, Agostina
- Cozzuto, Luca
- Frömel, Robert
- Beneyto-Calabuig, Sergi
- Lareau, Caleb
- Satpathy, Ansuman T.
- Beekman, Renée
- Steinmetz, Lars M.
- Raffel, Simon
- Ludwig, Leif S.
- Vyas, Paresh
- Rodriguez-Fraticelli, Alejo
- Velten, Lars
- Venue
- Nature
- Published
- 2025-05-21
- Volume
- 643
- Issue
- 8071
- Pages
- 478-487
- ISSN
- 0028-0836 (ISSN-L)
- 1476-4687
- PMC
- PMC12240852
- OpenAlex
- W4410551310
- Semantic Scholar
- 432419f2032b46caaaf3eb1aa445ee0f4fa38314
- Cited by
- 89
- References
- 100
- Citations by year
- 2026: 52 · 2025: 29
- FWCI
- 17.73
- Type
- journal article
- Language
- en
- Open access
- hybrid
- doi.org
- Licence
- Locations
- Nature (publishedVersion, cc-by)
- bioRxiv (Cold Spring Harbor Laboratory) (submittedVersion, cc-by-nc)
- Europe PMC (PubMed Central) (publishedVersion, cc-by-nc-nd)
- PubMed Central (publishedVersion, cc-by-nc-nd)
- PubMed (publishedVersion)
- Dipòsit Digital de la Universitat de Barcelona (Universitat de Barcelona) (publishedVersion, cc-by-nc-nd)
- Repositori digital de la UPF (Universitat Pompeu Fabra) (publishedVersion, cc-by-nc-nd)
- PubMed Central (submittedVersion, cc-by-nc)
- MDC Repository (Max-Delbrueck-Center for Molecular Medicine) (submittedVersion)
- Funders
- European Commission
- Blood Cancer UK (13008)
- National Institutes of Health
- National Heart, Lung, and Blood Institute (K99HL146983)
- National Human Genome Research Institute (R00HG012579)
- National Cancer Institute (P30CA008748)
- Topics
- Life Sciences › Biochemistry, Genetics and Molecular Biology › Molecular Biology › Single-cell and spatial transcriptomics
- Life Sciences › Biochemistry, Genetics and Molecular Biology › Molecular Biology › Epigenetics and DNA Methylation
- Health Sciences › Medicine › Hematology › Acute Myeloid Leukemia Research
- Keywords
- clonal tracing, DNA methylation, hematopoiesis, hematopoietic stem cells, clonal hematopoiesis, single-cell lineage tracing, myeloid bias, clonal expansion, driver mutations, cell differentiation
- MeSH terms
- Adult, Aged, Aging, Animals, Cell Differentiation, Clone Cells, Female, Hematopoiesis, Hematopoietic Stem Cells, Humans, Male, Mice, Inbred C57BL, Mutation, Stochastic Processes, Cellular Senescence, CpG Islands, Cell Lineage, DNA Methylation, Epigenesis, Genetic, Mice, Single-Cell Analysis
About these checks
Registry, retraction, Cites and statistics results are computed, not judged, with one exception: a printed reference that no index lists is read once by a model before it counts as a citation error. Claims are extracted by a model and kept only when their quote appears verbatim in the text; each cited source is then checked, with a model’s help, for whether it says what the claim relies on. Those verdicts can be wrong — read the claim’s quote and the cited source before relying on one.
A language model drew the claims from the paper on 2026-11-12, under version 3 of the claim definition (model deepseek-v4.1-flash, prompt extract-v3).
A second model labelled each claim on 2026-11-12 (model jev-1.13-20260917, definition revision gold-guideline-v0.2).
Statistics and arithmetic are recomputed, not judged.
Confidence bands are shown only for fields calibrated on our annotated test set. None is calibrated yet, so no band is shown.
What counts as a claim ›How we measure confidence ›How we check this ›
Are you an author, or do you see a problem with this page? Request a review
