

Normalization and variance stabilization of single-cell RNA-seq data using regularized negative binomial regression
Open accessPublished version of a preprint
The DOI matches its Crossref record; 41 of the 42 references it cites were found in a registry or an index; 23 of the 27 sources its claims cite were checked for support.
Abstract
Single-cell RNA-seq (scRNA-seq) data exhibits significant cell-to-cell variation due to technical factors, including the number of molecules detected in each cell, which can confound biological heterogeneity with technical effects. To address this, we present a modeling framework for the normalization and variance stabilization of molecular count data from scRNA-seq experiments. We propose that the Pearson residuals from “regularized negative binomial regression,” where cellular sequencing depth is utilized as a covariate in a generalized linear model, successfully remove the influence of technical characteristics from downstream analyses while preserving biological heterogeneity. Importantly, we show that an unconstrained negative binomial model may overfit scRNA-seq data, and overcome this by pooling information across genes with similar abundances to obtain stable parameter estimates. Our procedure omits the need for heuristic steps including pseudocount addition or log-transformation and improves common downstream analytical tasks such as variable gene selection, dimensional reduction, and differential expression. Our approach can be applied to any UMI-based scRNA-seq dataset and is freely available as part of the R package , with a direct interface to our single-cell toolkit .
Overview
CoChat Summary
TL;DR
The paper introduces regularized negative binomial regression for normalizing UMI-based single-cell RNA-seq data, using Pearson residuals as variance-stabilized expression values. It argues that this removes sequencing-depth effects while preserving biological heterogeneity better than log-normalization or unconstrained negative binomial models.
Key findings
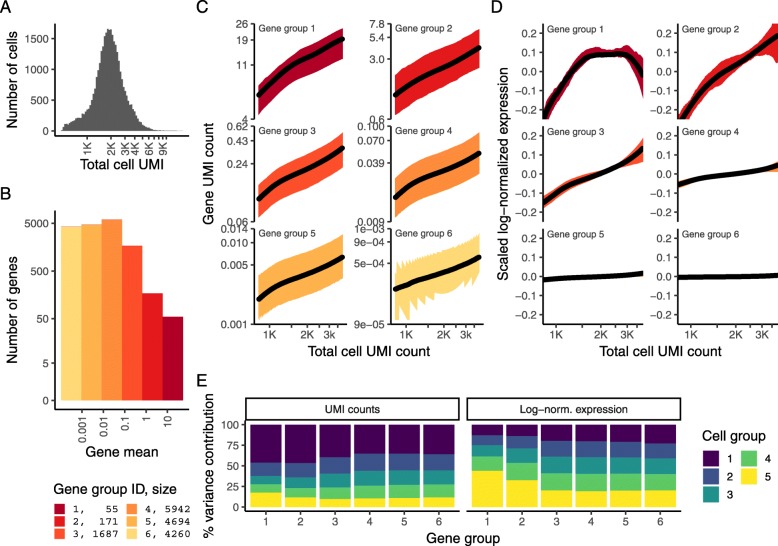
- A single scaling factor does not normalize all genes equally: in a 33,148-cell PBMC dataset with median 1891 UMI/cell and 16,809 genes detected in ≥5 cells, log-normalization effectively normalized only low/medium-abundance genes, while high-abundance genes remained depth-confounded and low-depth cells showed disproportionately high variance for high-abundance genes.
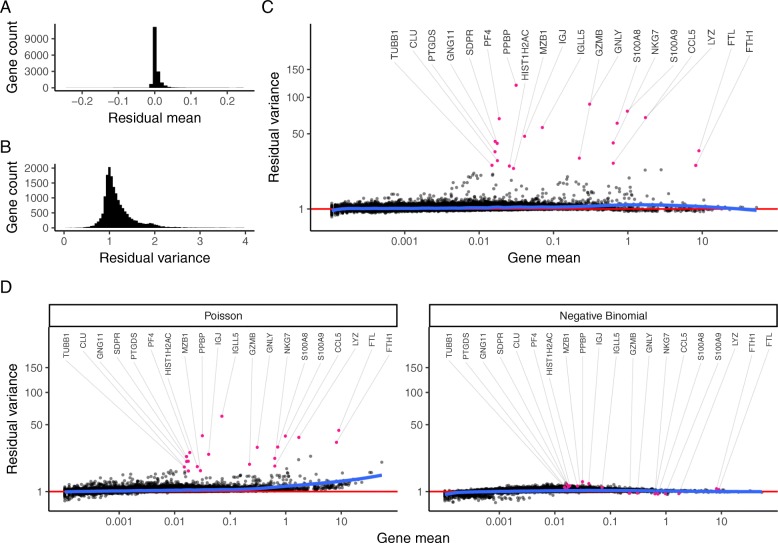
- Unconstrained negative binomial regression overfit scRNA-seq data, especially for low/medium-abundance genes, producing irreproducible parameter estimates across bootstraps; kernel-regularized parameters were consistent across subsamples.
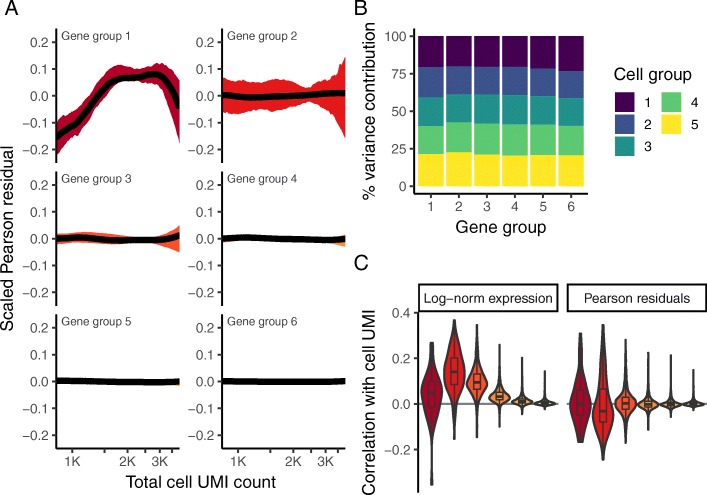
- Pearson residuals from regularized NB regression had minimal correlation with sequencing depth, residual mean centered at 0, residual variance peaked at 1, and high-variance outlier genes were known immune cell markers such as PPBP, GNLY, and IGJ.
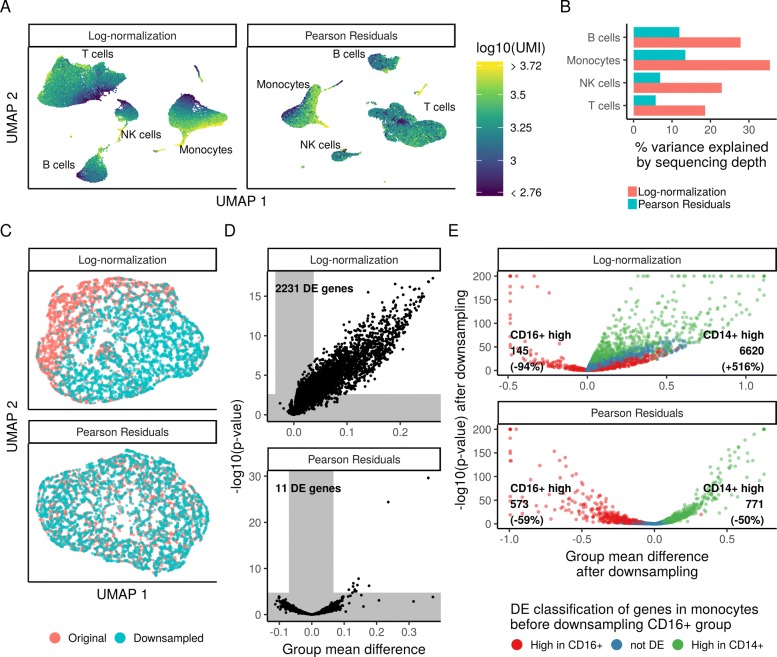
- In differential expression tests, splitting CD14+ monocytes and downsampling one group to 50% depth yielded >2000 DE genes with log-normalized data at FDR 0.01 but only 11 genes with Pearson residuals; downsampling CD16+ monocytes to 20% depth gave highly concordant Pearson-residual DE results, unlike log-normalized data.
Methods
- For each gene, UMI counts were modeled with a generalized linear model using total cell UMI count as a covariate, a negative binomial error distribution, and a log link, estimating intercept, slope, and dispersion θ.
- The workflow has three steps: independent per-gene NB regression; kernel regression (ksmooth, normal kernel, bandwidth from bw.SJ multiplied by a default bandwidth adjustment factor of 3) to regularize parameters across genes with similar mean expression; then a constrained NB regression/affine transformation to Pearson residuals, clipped to a maximum of √N.
- Analyses used five UMI datasets from plate- and droplet-based protocols, focusing on a 33,148-cell 10x PBMC dataset, plus a Chromium control dataset, a 26,439 murine bipolar cell batch-extension example, simulation, PCA/UMAP, and t-test differential expression with Benjamini-Hochberg FDR.
Limitations
- The paper states that the method assumes most genes do not exhibit significant biological variation, which may be overly simplistic for highly heterogeneous samples; it suggests a possible pre-clustering extension to reduce this concern.
- The batch-covariate extension requires all cell types to share a similar batch effect; the paper notes that cell-type-specific batch effects or shifts in cell-type proportions require non-linear batch correction strategies.
- The paper states that kernel bandwidth selection matters, with extreme values causing over- or under-smoothing; it also reports 11 false-positive DE genes attributed to highly expressed genes that are difficult to fit because few genes share similar mean values. Evident from the text, the method is presented for UMI-based scRNA-seq and is not validated here for non-UMI or other single-cell modalities.
Model-written summary. Check it against the paper before relying on it.
Integrity signals
Registry
Cites
Statistics
Figures


Verification
Claims the paper makes
16 Valid · 1 Not valid · 2 Not checked · 80 Own results and interpretations
Every source the paper cites for this claim was checked and supports it.
In the paper
“Our regularization procedure explicitly learns and accounts for the well-established relationship [27] between a gene’s mean abundance and variance in single-cell data”
§ Normalization and variance stabilization of single-cell RNA-seq data using regularized negative binomial regression > Results > Applying regularized negative binomial regression for single-cell normalization
What the sources say
- Supportedcites [27] Eling N, Richard AC, Richardson S, Marioni JC, Vallejos CA. Correcting the mean-variance dependency for differential variability testing using single-cell RNA sequencing data. Cell Syst. 2018; 7(3):284–94. https://linkinghub.elsevier.com/retrieve/pii/S2405471218302783. source
The citation supports the mean–variance relationship, not the citing authors’ description of their own regularization procedure. The source’s Methods section calls the confounding between mean and variability in scRNA-seq well known, and its Results section describes inferring a trend between gene-specific mean expression and over-dispersion. (LLM, conf=0.92)
boostedstates an association- Asserted: passes — The authors put it forward as true.
- Checkable: passes — It can be checked against evidence.
- Load-bearing: passes — The paper’s conclusions depend on it.
- Based: passes — The paper gives a reason why it holds.
- Supported
The cited sources support only part of this claim — read each source’s verdict below.
In the paper
“These same challenges apply to bulk RNA-seq workflows, but are exacerbated due to the extreme comparative sparsity of scRNA-seq data [5].”
§ Normalization and variance stabilization of single-cell RNA-seq data using regularized negative binomial regression > Introduction
What the sources say
- Partly supportedcites [5] Svensson V, Natarajan KN, Ly LH, Miragaia RJ, Labalette C, Macaulay IC, et al.Power analysis of single-cell RNA-sequencing experiments. Nat Methods. 2017; 14:381. https://doi.org/10.1038/nmeth.4220.http://10.0.4.14/nmeth.4220. https://www.nature.com/articles/nmeth.4220{#}supplementary-information. sourceExperimental — accuracy not yet measured
The Introduction says scRNA-seq starts with tiny amounts of material and requires amplification, making detection sensitivity an important challenge. The cited passages do not establish that scRNA-seq data are comparatively sparser than bulk RNA-seq data or that shared workflow challenges are exacerbated by sparsity; the Results instead report greater molecular detection sensitivity for the scRNA-seq protocols studied. (LLM, conf=0.78)
plainstates a cause- Asserted: passes — The authors put it forward as true.
- Checkable: passes — It can be checked against evidence.
- Load-bearing: passes — The paper’s conclusions depend on it.
- Based: passes — The paper gives a reason why it holds.
- Partly supported
Every source the paper cites for this claim was checked and supports it.
In the paper
“Indeed, the authors of SCnorm [6] reached similar conclusions in the normalization of non-UMI-based single-cell RNA-seq data.”
§ Normalization and variance stabilization of single-cell RNA-seq data using regularized negative binomial regression > Results > A single scaling factor does not effectively normalize both lowly and highly expressed genes
What the sources say
- Supportedcites [6] Bacher R, Chu LF, Leng N, Gasch AP, Thomson JA, Stewart RM, et al.SCnorm: robust normalization of single-cell RNA-seq data. Nat Methods. 2017; 14(6):584–6. http://www.nature.com/doifinder/10.1038/nmeth.4263. source
The paper’s Abstract reports that commonly used normalization methods can introduce artifacts in single-cell RNA-seq data and that SCnorm avoids the overcorrection seen with global scale factors. Its H1/H9 case studies describe sequencing cDNA libraries and analyzing read counts, consistent with the cited characterization of the work as concerning non-UMI-based data. The citing sentence does not specify what the conclusions are ‘similar’ to, so that comparison cannot be assessed further. (LLM, conf=0.83)
plain- Asserted: passes — The authors put it forward as true.
- Checkable: passes — It can be checked against evidence.
- Load-bearing: unclear — It is unclear whether the paper’s conclusions depend on it.
- Based: passes — The paper gives a reason why it holds.
- Supported
Every source the paper cites for this claim was checked and supports it.
In the paper
“Finally, while we focus here on modeling technical variation due to differences in cellular sequencing depth, we note that our approach can be easily extended to model alternative “nuisance” parameters, including cell cycle [31], mitochondrial percentage, or experimental batch, simply by adding additional covariates to the model.”
§ Normalization and variance stabilization of single-cell RNA-seq data using regularized negative binomial regression > Discussion
What the sources say
- Supportedcites [31] Buettner F, Natarajan KN, Casale FP, Proserpio V, Scialdone A, Theis FJ, et al.Computational analysis of cell-to-cell heterogeneity in single-cell RNA-sequencing data reveals hidden subpopulations of cells. Nat Biotechnol. 2015; 33(2):155–60. http://www.nature.com/doifinder/10.1038/nbt.3102. source
The citation [31] is attached specifically to “cell cycle,” not to mitochondrial percentage or experimental batch. The Discussion says scLVM accounts for cell-cycle effects as a confounding factor, and the section on creating residual expression data sets describes removing those effects. The supplied passages do not give page numbers. (LLM, conf=0.94)
plainstates a cause- Asserted: passes — The authors put it forward as true.
- Checkable: passes — It can be checked against evidence.
- Load-bearing: unclear — It is unclear whether the paper’s conclusions depend on it.
- Based: passes — The paper gives a reason why it holds.
- Supported
The cited sources support only part of this claim — read each source’s verdict below.
In the paper
“This is consistent with previous observations in both bulk and single-cell RNA-seq that count data is overdispersed [9, 12, 14, 28].”
§ Normalization and variance stabilization of single-cell RNA-seq data using regularized negative binomial regression > Results > Pearson residuals effectively normalize technical differences, while retaining biological variation
What the sources say
- Supportedcites [9] Risso D, Perraudeau F, Gribkova S, Dudoit S, Vert JP. A general and flexible method for signal extraction from single-cell RNA-seq data. Nat Commun. 2018; 9(1):1–17. source
The Introduction says the paper models single-cell counts with a zero-inflated negative binomial distribution to account for over-dispersion. The Results (‘Goodness-of-fit of ZINB-WaVE model’) say negative binomial models are quite successful for bulk RNA-seq, supporting the same point for bulk counts. (LLM, conf=0.86)
- Partly supportedcites [12] Love MI, Huber W, Anders S. Moderated estimation of fold change and dispersion for RNA-Seq data with DESeq2. Genome Biol. 2014; 15(12):550. http://www.ncbi.nlm.nih.gov/pubmed/25516281. sourceExperimental — accuracy not yet measured
In Materials and methods > Estimation of dispersions (page unavailable), the paper identifies an overdispersion component in RNA-seq count variance and discusses observed dispersion in the Pickrell dataset. It does not address single-cell RNA-seq, so it supports the bulk RNA-seq part but not the single-cell part attributed to this source. (LLM, conf=0.88)
- Not checked — no full text of the sourcecites [14] Grün D, Kester L, van Oudenaarden A. Validation of noise models for single-cell transcriptomics. Nat Methods. 2014; 11(6):637–40. http://www.nature.com/doifinder/10.1038/nmeth.2930. source
- Partly supportedcites [28] Robinson MD, McCarthy DJ, Smyth GK. edgeR: a Bioconductor package for differential expression analysis of digital gene expression data. Bioinformatics. 2010; 26(1):139–40. doi:10.1093/bioinformatics/btp616. sourceExperimental — accuracy not yet measured
The Model section describes RNA-seq counts using an overdispersed Poisson or negative-binomial model, supporting the claim for conventional replicated RNA-seq. Our copy does not address single-cell RNA-seq. The Features section also notes that technical replicates may fit a Poisson distribution without overdispersion. (LLM, conf=0.88)
plain- Asserted: passes — The authors put it forward as true.
- Checkable: passes — It can be checked against evidence.
- Load-bearing: passes — The paper’s conclusions depend on it.
- Based: passes — The paper gives a reason why it holds.
- Supported
47 more claims · 1 with their cited sources checked
Create a free account to see all 99 claims and every source verdict.
- It may state two separate claims as one. 39
- Probably not a substantial claim. 15
Claims other papers make about this one
Each is checked against this paper’s own text: does it say what the citing paper says it does?
The cited source says what the claim attributes to it.
In the citing paper
“We normalized and scaled the count matrices via SCTransform v0.3.571 with default parameters.”
From CHIT1 at diagnosis predicts faster disability progression and reflects early microglial activation in multiple sclerosis (2024) · cites this paper as [71]
The cited source says what the claim attributes to it.
In the citing paper
“Data from different sequencing runs, batches and ages were integrated and scaled using SCTransform (Hafemeister and Satija, 2019), while regressing out the following covariates; percentage of mitochondrial genes, the number of cells collected per parent organoid, the number of genes per cell and the number of reads per cell.”
From ELAVL4, splicing, and glutamatergic dysfunction precede neuron loss in MAPT mutation cerebral organoids (2021) · cites this paper as Hafemeister and Satija, 2019
The cited source says what the claim attributes to it.
In the citing paper
“Using SCTransform, transcript expression data were normalised to adjust for differences in sequencing depth between cells and scaled to correct for cell-to-cell variation in total UMI count [22]. Data were also normalised to remove confounding sources of variation such as mitochondrial mapping percentage, post-mortem delay, age of death, and batch number.”
From Apolipoprotein E abundance is elevated in the brains of individuals with Down syndrome–Alzheimer’s disease (2025) · cites this paper as [22]
The check wasn’t confident either way, so it gives no verdict — never disputed.
In the citing paper
“Enriched biological pathways (Metascape54) amongst upregulated gene markers of COVID-19 astrocytes.”
From Dysregulation of brain and choroid plexus cell types in severe COVID-19 (2021) · cites this paper as [54]
Experimental — accuracy not yet measuredIn the citing paper
“To generate a low-dimensional representation of the protein data only, we opted to use SCTransform64, which produced an improved cell-state resolution.”
From Clonal tracing with somatic epimutations reveals dynamics of blood ageing (2025) · cites this paper as [64]
Self-check
Percentages, sums and reported differences re-computed from the paper’s own numbers.
Each contradiction between two passages listed here was confirmed by an independent check.
Rated minor: it would not touch a result — a value no result rests on, a p-value that stays on the same side of the significance level, or a conflict that is clerical, resolved elsewhere in the paper, or outside its own findings.
In the paper
§ Normalization and variance stabilization of single-cell RNA-seq data using regularized negative binomial regression > Results > Modeling single-cell data with a negative binomial distribution leads to overfitting
“we reasoned that including sequencing depth as a GLM covariate could effectively model this technical source of variance, with the GLM residuals corresponding to normalized expression values.”
§ Normalization and variance stabilization of single-cell RNA-seq data using regularized negative binomial regression > Methods > Model extensions—additional nuisance parameters
“we have used the log-transformed total number of UMI assigned to each cell as the dependent variable to model gene-level UMI counts.”
Rated minor: it would not touch a result — a value no result rests on, a p-value that stays on the same side of the significance level, or a conflict that is clerical, resolved elsewhere in the paper, or outside its own findings.
In the paper
§ Normalization and variance stabilization of single-cell RNA-seq data using regularized negative binomial regression > Results > A single scaling factor does not effectively normalize both lowly and highly expressed genes
“For each gene group, we examined the average relationship between observed counts and cell sequencing depth. We fit a smooth line for each gene individually”
§ Normalization and variance stabilization of single-cell RNA-seq data using regularized negative binomial regression > Methods > Trends in the data before and after normalization
“for every gene, we fit the expression (UMI counts, scaled log-normalized expression, scaled Pearson residuals) as a function of log10-transformed mean UMI count using kernel regression”
Citations
Cites
Moderated estimation of fold change and dispersion for RNA-seq data with DESeq2
Love, M. I., Huber, W., & Anders, S. (2014) · Genome Biology · doi:10.1186/s13059-014-0550-8 · Cited by 95,106 · cited 1×
“The first set aims to identify ’size factors’ for individual cells, as is commonly performed for bulk RNA-seq [Love et al., 2014].”
Robinson, M. D., McCarthy, D. J., & Smyth, G. K. (2010) · Bioinformatics · doi:10.1093/bioinformatics/btp616 · Cited by 41,364
Differential expression analysis for sequence count data
Anders, S., & Huber, W. (2010) · Genome Biology · doi:10.1186/gb-2010-11-10-r106 · Cited by 15,581 · cited 1×
“For example, DESeq [23] uses the negative binomial distribution for read count data and links variance and mean by local regression.”
MethodComprehensive Integration of Single-Cell Data
Stuart, T., Butler, A., Hoffman, P., Hafemeister, C., Papalexi, E., Mauck, W. M., Hao, Y., Stoeckius, M., Smibert, P., & Satija, R. (2019) · Cell · doi:10.1016/j.cell.2019.05.031 · Cited by 15,453
Self-citationIntegrating single-cell transcriptomic data across different conditions, technologies, and species
Butler, A., Hoffman, P., Smibert, P., Papalexi, E., & Satija, R. (2018) · Nature Biotechnology · doi:10.1038/nbt.4096 · Cited by 13,174
Self-citationSmyth, G. K. (2004) · Statistical Applications in Genetics and Molecular Biology · doi:10.2202/1544-6115.1027 · Cited by 11,829 · cited 1×
“Similarly, an extension of sctransform could perform differential expression directly on the resulting parameter estimates instead of the residual values, potentially coupling this with an empirical Bayes framework [12, 30].”
MethodUMAP: Uniform Manifold Approximation and Projection
McInnes, L., Healy, J., Saul, N., & Großberger, L. (2018) · Journal of Open Source Software · doi:10.21105/joss.00861 · Cited by 9,826 · cited 1×
“For 2D visualization, the PC embeddings were passed into UMAP [36, 37] with default parameters.”
MethodSCANPY: large-scale single-cell gene expression data analysis
Wolf, F. A., Angerer, P., & Theis, F. J. (2018) · Genome Biology · doi:10.1186/s13059-017-1382-0 · Cited by 8,881 · cited 1×
“, 2018] and SCANPY [Wolf et al., 2018], compensates for this effect.”
BackgroundUMAP: Uniform Manifold Approximation and Projection for Dimension Reduction
McInnes, L., Healy, J., & Melville, J. (2018) · arXiv · doi:10.48550/arxiv.1802.03426 · Cited by 7,101
Spatial reconstruction of single-cell gene expression data
Satija, R., Farrell, J. A., Gennert, D., Schier, A. F., & Regev, A. (2015) · Nature Biotechnology · doi:10.1038/nbt.3192 · Cited by 7,055 · cited 2×
“To facilitate users applying these methods to their own datasets, our approach is freely available as an open-source R package sctransform (github.com/ChristophH/sctransform), with an accompanying interface to our single-cell R toolkit Seurat [16–18].”
MethodSelf-citation
Research works printed but not linked: 1
- McInnes L, Healy J, Saul N, Grossberger L. UMAP: uniform manifold approximation and projection. J Open Source Softw. 2018; 3(29):861. · DOI · Paper page
Cited by
Integrated analysis of multimodal single-cell data
Hao, Y., Hao, S., Andersen-Nissen, E., Mauck, W. M., Zheng, S., Butler, A., Lee, M. J., Wilk, A. J., Darby, C., Zagar, M., et al. (2020) · doi:10.1101/2020.10.12.335331 · Cited by 15,508
“We apply SCTransform (Hafemeister and Satija, 2019) to normalize gene expression data, and we apply a CLR transformation to normalize protein data within each cell.”
Self-citationComprehensive Integration of Single-Cell Data
Stuart, T., Butler, A., Hoffman, P., Hafemeister, C., Papalexi, E., Mauck, W. M., Hao, Y., Stoeckius, M., Smibert, P., & Satija, R. (2019) · Cell · doi:10.1016/j.cell.2019.05.031 · Cited by 15,453
Self-citationDictionary learning for integrative, multimodal and scalable single-cell analysis
Hao, Y., Stuart, T., Kowalski, M. H., Choudhary, S., Hoffman, P., Hartman, A., Srivastava, A., Molla, G., Madad, S., Fernandez-Granda, C., et al. (2024) · Nature Biotechnology · doi:10.1038/s41587-023-01767-y · Cited by 5,631
Self-citationSingle-cell chromatin state analysis with Signac
Stuart, T., Srivastava, A., Madad, S., Lareau, C. A., & Satija, R. (2021) · Nature Methods · doi:10.1038/s41592-021-01282-5 · Cited by 1,769
“We normalized gene expression UMI count data using SCTransform 45 and performed PCA on the SCTransform Pearson residual matrix using the RunPCA function in Seurat.”
MethodSelf-citationExploring tissue architecture using spatial transcriptomics
Rao, A., Barkley, D., França, G. S., & Yanai, I. (2021) · Nature · doi:10.1038/s41586-021-03634-9 · Cited by 1,700
Metadata
- Authors
- Hafemeister, C., & Satija, R.
- Affiliations
- New York Genome Center (US)
- Venue
- Genome Biology
- Published
- 2019-12
- Volume
- 20
- Issue
- 1
- Pages
- 296-296
- ISSN
- 1465-6906 (ISSN-L)
- 1474-760X
- PMC
- PMC6927181
- OpenAlex
- W2997280954
- Semantic Scholar
- 6ecf1dfa2688d949a309e2cc336ddd929a69b12b
- Cited by
- 4,479
- References
- 42
- Citations by year
- 2026: 622 · 2025: 795 · 2024: 897 · 2023: 773 · 2022: 675 · 2021: 460 · 2020: 231 · 2019: 24
- FWCI
- 116.50
- Type
- journal article
- Language
- en
- Open access
- gold
- doi.org
- Licence
- cc-by
- creativecommons.org/licenses/by/4.0 (tdm)
- creativecommons.org/licenses/by/4.0 (vor, 22 d)
- Locations
- Genome biology (publishedVersion, cc-by)
- bioRxiv (Cold Spring Harbor Laboratory) (acceptedVersion, cc-by-nc-nd)
- PubMed Central (publishedVersion, cc-by)
- PubMed (publishedVersion)
- DOAJ (DOAJ: Directory of Open Access Journals) (submittedVersion, cc-by-sa)
- Funders
- New York State Department of Health
- California Institute of Technology
- New York Genome Center
- Deutsche Forschungsgemeinschaft (328558384)
- National Institutes of Health (1dp2hg009623-01, OT2OD026673)
- National Institute of Mental Health (R01MH071679)
- National Human Genome Research Institute (DP2-HG-009623)
- National Institute of Neurological Disorders and Stroke (R35NS097404)
- Eunice Kennedy Shriver National Institute of Child Health and Human Development (R01HD096770)
- Topics
- Life Sciences › Biochemistry, Genetics and Molecular Biology › Molecular Biology › Single-cell and spatial transcriptomics
- Life Sciences › Biochemistry, Genetics and Molecular Biology › Molecular Biology › Gene expression and cancer classification
- Life Sciences › Biochemistry, Genetics and Molecular Biology › Molecular Biology › Genomics and Phylogenetic Studies
- Keywords
- single-cell RNA sequencing, data normalization, variance stabilization, Pearson residuals, sequencing depth, technical variability, overfitting, differential gene expression, Seurat
- MeSH terms
- Humans, Regression Analysis, Software, Sequence Analysis, RNA, Single-Cell Analysis
About these checks
Registry, retraction, Cites and statistics results are computed, not judged, with one exception: a printed reference that no index lists is read once by a model before it counts as a citation error. Claims are extracted by a model and kept only when their quote appears verbatim in the text; each cited source is then checked, with a model’s help, for whether it says what the claim relies on. Those verdicts can be wrong — read the claim’s quote and the cited source before relying on one.
The claim verdicts this report counts are experimental: their accuracy is not yet measured.
A language model drew the claims from the paper on 2026-10-14, under version 3 of the claim definition (model deepseek-v4.1-flash, prompt extract-v3).
A second model labelled each claim on 2026-10-14 (model jev-1.13-20260917, definition revision gold-guideline-v0.2).
Cited sources are checked with a language model’s help (gpt-6-sol).
Statistics and arithmetic are recomputed, not judged.
Confidence bands are shown only for fields calibrated on our annotated test set. None is calibrated yet, so no band is shown.
What counts as a claim ›How we measure confidence ›How we check this ›
Are you an author, or do you see a problem with this page? Request a review
How to cite
Cite CoChat for the checks on this page, and the paper for its own findings.
- This page
- CoChat. (2026). Citation check: Normalization and variance stabilization of single-cell RNA-seq data using regularized negative binomial regression. https://app.cochat.ai/papers/10.1186/s13059-019-1874-1
- The paper
- Hafemeister, C., & Satija, R. (2019). Normalization and variance stabilization of single-cell RNA-seq data using regularized negative binomial regression. Genome Biology. https://doi.org/10.1186/s13059-019-1874-1
Data sources
Bibliographic data: Semantic Scholar, OpenAlex, Crossref.
Contains information from the Semantic Scholar Academic Graph Datasets, made available under the ODC Attribution License (ODC-BY 1.0).
Semantic Scholar’s data is described in: Kinney, R., et al. (2023). The Semantic Scholar Open Data Platform. arXiv:2301.10140.
