

The DOI matches its Crossref record; 65 of the 65 references it cites were found in a registry or an index.
Accurate detection of identity-by-descent segments in human ancient DNA
Open accessPublished version of a preprint
Abstract
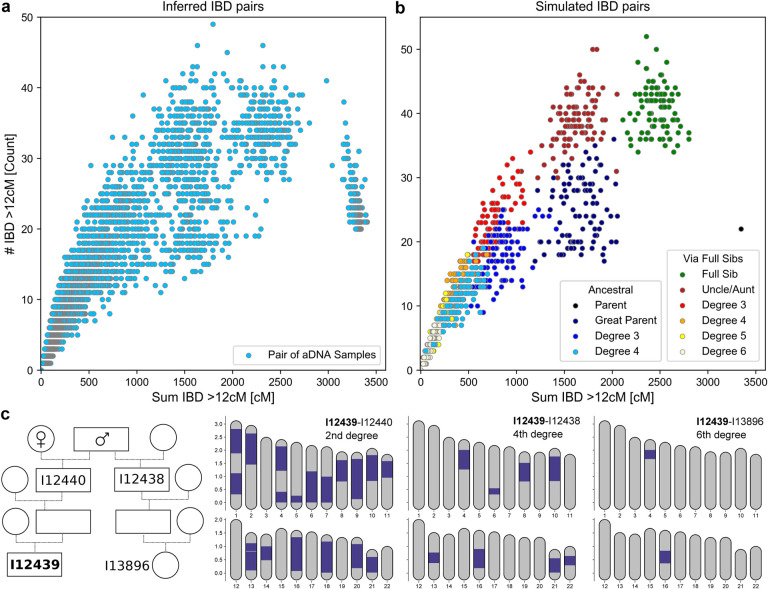
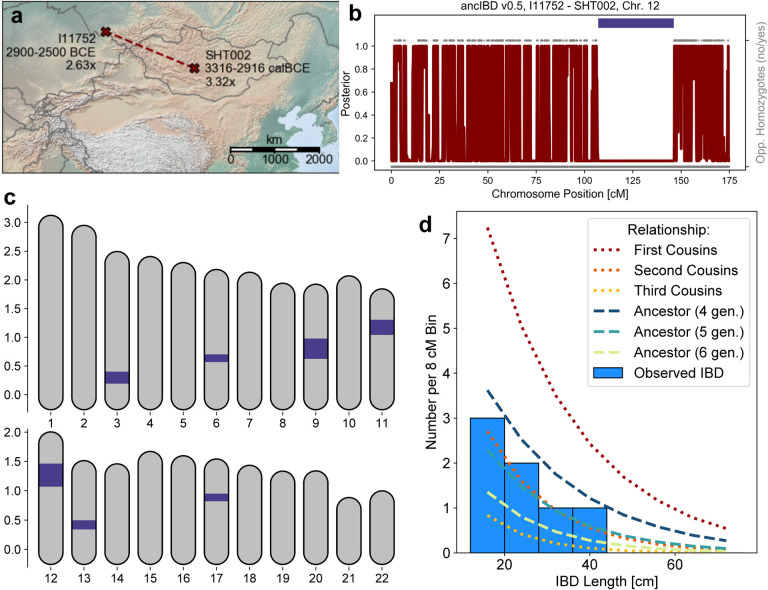
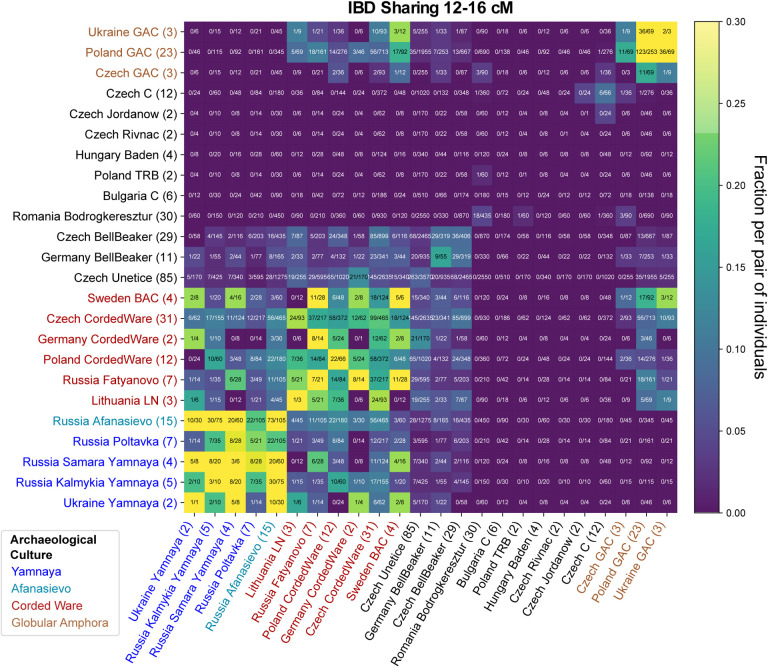
Long DNA segments shared between two individuals, known as identity-by-descent (IBD), reveal recent genealogical connections. Here we introduce ancIBD, a method for identifying IBD segments in ancient human DNA (aDNA) using a hidden Markov model and imputed genotype probabilities. We demonstrate that ancIBD accurately identifies IBD segments >8 cM for aDNA data with an average depth of >0.25× for whole-genome sequencing or >1× for 1240k single nucleotide polymorphism capture data. Applying ancIBD to 4,248 ancient Eurasian individuals, we identify relatives up to the sixth degree and genealogical connections between archaeological groups. Notably, we reveal long IBD sharing between Corded Ware and Yamnaya groups, indicating that the Yamnaya herders of the Pontic-Caspian Steppe and the Steppe-related ancestry in various European Corded Ware groups share substantial co-ancestry within only a few hundred years. These results show that detecting IBD segments can generate powerful insights into the growing aDNA record, both on a small scale relevant to life stories and on a large scale relevant to major cultural-historical events.
Overview
The claims and statistics of this paper haven’t been checked yet.
Run the check — free, no account needed. It reads the open-access text and checks the sources it cites.
Integrity signals
Registry
Cites
Statistics
Figures
Verification
Claims the paper makes
The claims and statistics of this paper haven’t been checked yet.
Run the check — free, no account needed. It reads the open-access text and checks the sources it cites.
Self-check
Percentages, sums and reported differences re-computed from the paper’s own numbers.
The self-check needs the paper’s full text.
Citations
Cites
A global reference for human genetic variation
The 1000 Genomes Project Consortium, authors, C., Auton, A., Abecasis, G. R., Steering committee, Altshuler, D. M., Durbin, R. M., Abecasis, G. R., Bentley, D. R., Chakravarti, A., et al. (2015) · Nature · doi:10.1038/nature15393 · Cited by 18,247
Durbin, R. M., Eddy, S. R., Krogh, A., & Mitchison, G. (1998) · Cambridge University Press eBooks · doi:10.1017/cbo9780511790492 · Cited by 3,255
Massive migration from the steppe was a source for Indo-European languages in Europe
Haak, W., Lazaridis, I., Patterson, N., Rohland, N., Mallick, S., Llamas, B., Brandt, G., Nordenfelt, S., Harney, E., Stewardson, K., et al. (2015) · Nature · doi:10.1038/nature14317 · Cited by 1,940
Self-citationPopulation genomics of Bronze Age Eurasia
Allentoft, M. E., Sikora, M., Sjögren, K.-G., Rasmussen, S., Rasmussen, M., Stenderup, J., Damgaard, P. B., Schroeder, H., Ahlström, T., Vinner, L., et al. (2015) · Nature · doi:10.1038/nature14507 · Cited by 1,550
Genome sequence of a 45,000-year-old modern human from western Siberia
Fu, Q., Li, H., Moorjani, P., Jay, F., Slepchenko, S. M., Bondarev, A. A., Johnson, P. L. F., Aximu-Petri, A., Prüfer, K., de Filippo, C., et al. (2014) · Nature · doi:10.1038/nature13810 · Cited by 1,023
Self-citationThe formation of human populations in South and Central Asia
Narasimhan, V. M., Patterson, N. J., Moorjani, P., Rohland, N., Bernardos, R. L., Mallick, S., Lazaridis, I., Nakatsuka, N. J., Olalde, Í., Lipson, M., et al. (2019) · Science · doi:10.1126/science.aat7487 · Cited by 819
Self-citationAn early modern human from Romania with a recent Neanderthal ancestor
Fu, Q., Hajdinjak, M., Moldovan, O. T., Constantin, S., Mallick, S., Skoglund, P., Patterson, N., Rohland, N., Lazaridis, I., Nickel, B., et al. (2015) · Nature · doi:10.1038/nature14558 · Cited by 802
Self-citationThe genomic history of southeastern Europe
Mathieson, I., Alpaslan-Roodenberg, S., Posth, C., Szécsényi‐Nagy, A., Rohland, N., Mallick, S., Olalde, Í., Broomandkhoshbacht, N., Candilio, F., Cheronet, O., et al. (2018) · Nature · doi:10.1038/nature25778 · Cited by 759
Self-citationImproving the Accuracy and Efficiency of Identity-by-Descent Detection in Population Data
Browning, B. L., & Browning, S. R. (2013) · Genetics · doi:10.1534/genetics.113.150029 · Cited by 649
Accurate, scalable and integrative haplotype estimation
Delaneau, O., Zagury, J., Robinson, M. R., Marchini, J., & Dermitzakis, E. T. (2019) · Nature Communications · doi:10.1038/s41467-019-13225-y · Cited by 604
Research works printed but not linked: 1
- Bishop, C. M. Pattern Recognition and Machine Learning (Information Science and Statistics) 627–628 (Springer, 2006).
Cited by
Sorted by citations
Items 101–155 of 155
Unveiling the complexity of post-Roman polity formation using ancient DNAPreprint
Tian, Y., Koncz, I., Faragó, N., Knipper, C., Friedrich, R., Vyas, D. N., Samu, L., Spekker, O., Szeniczey, T., Hajdu, T., et al. (2025) · bioRxiv (Cold Spring Harbor Laboratory) · doi:10.1101/2025.08.18.670760 · Cited by 1
Genetic history of Rus’Preprint
Андреева, Т. В., Станиславовна, К. С., Malyarchuk, A. B., Gusev, F. E., Ustkachkintseva, T. V., Adrianova, I. Y., Доценко, Г. С., Дмитриевна, С. А., Kuznetsova, I. L., Dudko, N. A., et al. (2025) · bioRxiv (Cold Spring Harbor Laboratory) · doi:10.64898/2025.12.30.695215 · Cited by 1
Солодовников, К. Н., Dashkovskiy, P. K., Erdene, M., Нечвалода, А. И., Tur, S. S., & Kravchenko, G. G. (2023) · Nations and religions of the Eurasia · doi:10.14258/nreur(2023)3-06
Shared chromosomal segments connect ancient human societies
Bergström, A. (2023) · Nature Genetics · doi:10.1038/s41588-023-01606-5
DNA from ancient graves reveals the culture of a mysterious nomadic people
Eisenstein, M. S. (2024) · Nature · doi:10.1038/d41586-024-01165-7
Schütz, O., Maróti, Z., Tihanyi, B., Kiss, A. P., Nyerki, E., Gînguță, A., Kiss, P., Varga, G. I. B., Kovács, B., Maár, K., et al. (2024) · bioRxiv (Cold Spring Harbor Laboratory) · doi:10.1101/2024.10.04.616652
Genetics and Population Analysis
Balyan, P., Nisamudheen, N. A., Jan, Z., Velayutham, D., Balyan, M. K., & Jithesh, P. V. (2025) · Elsevier eBooks · doi:10.1016/b978-0-323-95502-7.00293-1
Ancient DNA reveals ancient kinship and social structures
Qi, Y., Yin, Z., & Wang, K. (2025) · Chinese Science Bulletin (Chinese Version) · doi:10.1360/csb-2025-0332
Fault-tolerant pedigree reconstruction from pairwise kinship relations
Huang, E. C., Li, K. A., & Narasimhan, V. M. (2026) · Bioinformatics · doi:10.1093/bioinformatics/btag251
Ezcurra, M. B., Rohrlach, A. B., Papac, L., Guillén, J. I. R., Barquera, R., Lecumberri, F. G., Lorente, R. L., Risch, R., Krause, J., Millán, J. V. P., et al. (2025) · Communications Biology · doi:10.1038/s42003-025-08668-7 · Cited by 1
Rymbekova, A., Gelabert, P., Llanos-Lizcano, A., Balakrishnan, K., Hämmerle, M., Cheronet, O., Abdykanova, A., Kasymkulov, K., Hrivnyak, M., Eng, J. T., et al. (2025) · bioRxiv (Cold Spring Harbor Laboratory) · doi:10.1101/2025.11.03.686206
The shifting dynamics of ancestry and culture at a post-Roman crossroadsPreprint
Vyas, D. N., Koncz, I., Milavec, T., Leskovar, T., Faragó, N., Tian, Y., Bausovac, M., Mende, B. G., Francalacci, P., Bavec, U., et al. (2025) · bioRxiv (Cold Spring Harbor Laboratory) · doi:10.64898/2025.12.12.693924
Genetic affinities between the ancient Greek colony of Amvrakia and its metropolis
Psonis, N., Tabakaki, E., Vassou, D., Papadantonakis, S., Souleles, A., Nafplioti, A., Tsampazis, G. K., Papadopoulou, A., Xanthopoulos, K., Panailidis, P., et al. (2026) · Genome biology · doi:10.1186/s13059-026-03968-5 · Cited by 1
The Roman Military Community as a Melting Pot: Biomolecular Evidence from the Lower Rhine LimesPreprint
Coster, M. D., Furni, F., Vos, W. K., Oosterbaan, J., Davies, G. R., & Kootker, L. M. (2026) · Research Square · doi:10.21203/rs.3.rs-8699464/v1
Barroso, V. A., Armas‐Quintana, S. B., Serrano, J. G., Díaz‐Pérez, C., Moreno-Benítez, M., Medina, F. M., Medina, I. S., González-Marrero, M. D. C., Chávez-Álvarez, E., Betancor, M. A. P., et al. (2026) · Journal of Archaeological Science Reports · doi:10.1016/j.jasrep.2026.105716
Ancient Ryukyu Jomon contributed to past and current genetic structure of Japanese populationsPreprint
Matsunami, M., Kawai, Y., Speidel, L., Koganebuchi, K., Takigami, M., Kakuda, T., Adachi, N., Kameda, Y., Katagiri, C., Shinzato, T., et al. (2026) · bioRxiv (Cold Spring Harbor Laboratory) · doi:10.64898/2026.04.03.712818
DIANA: Deep Learning Identification and Assessment of Ancient DNAPreprint
González, C. D., Lopopolo, M., Nishimura, L., Faure, R., & Duchêne, S. (2026) · bioRxiv (Cold Spring Harbor Laboratory) · doi:10.64898/2026.04.09.717429
Corral, A. M. H. (2026) · Cambridge Archaeological Journal · doi:10.1017/s0959774326100377
Matters of Life and Death: Kin-work at Funerals
Frieman, C. J., & Schuster, C. E. (2026) · Cambridge Archaeological Journal · doi:10.1017/s0959774326100407
What three Austrian cemeteries reveal about medieval marriage and family
Rohrlach, A. B., & Tuke, J. (2026) · Significance · doi:10.1093/jrssig/qmag027
Ge, D., Zou, R., Jin, J., Shi, X., Wang, X., Zhang, D., Zhang, X., Zhang, Q., & Ning, C. (2026) · Archaeological and Anthropological Sciences · doi:10.1007/s12520-026-02466-w
de Bruin, J., Kroon, E., van den Dikkenberg, L., & Braekmans, D. (2026) · Archaeometry · doi:10.1111/arcm.70151
The genetic legacy of the 17th-century colonial capital of St. Mary’s City
Harney, É., Jewett, E. M., Micheletti, S., Curry, R., Bruwelheide, K. S., Freyman, W. A., Miller, H., Akbari, A., Barca, K. G., Bryc, K., et al. (2026) · Current Biology · doi:10.1016/j.cub.2026.04.046
Self-citationLong-distance genetic relatedness in megalithic central Europe
da Silva, N. A., Nebel, A., Kolbe, D., Myburgh, D., Klimscha, F., Görner, I., Fuchs, K., Meyer, C., Schierhold, K., Rind, M., et al. (2026) · Science · doi:10.1126/science.aeb2926 · Cited by 1
Evaluating relationship inference from low-quality DNA using a conditional simulation framework
Jepsen, A. H., Kampmann, M., Tillmar, A. O., Børsting, C., Andersen, J., & Kling, D. (2026) · Forensic Science International Genetics · doi:10.1016/j.fsigen.2026.103541
Kroon, E. J. (2026) · Proceedings of the Prehistoric Society · doi:10.1017/ppr.2026.10083 · Cited by 1
Buried in two places: Lineages from elite Maya tombs also found in distant cavesPreprint
Brielle, E. S., Dorgay, E., Kennett, D. J., Mes, J., Moes, E., Neff, N. C., Novotny, A. C., Rangel, E., Ray, E. E., Robinson, M. E., et al. (2026) · bioRxiv (Cold Spring Harbor Laboratory) · doi:10.64898/2026.06.07.724338
Self-citationKovács, B., Olasz, J., Maróti, Z., Schütz, O., Rouse, N. A., Nagy, M. F., Gînguță, A., Maár, K., Tihanyi, B., Kis, L., et al. (2026) · iScience · doi:10.1016/j.isci.2026.116365
A 6000-year genomic transect in the middle Yellow River
Wang, R., Li, S., 韩国河, Ma, H., Lin, Y., Jiang, L., Qin, Z., Ding, F., Li, X., Chen, T., et al. (2026) · National Science Review · doi:10.1093/nsr/nwag395
Ancient DNA reveals elite dynastic rule among Iron Age Eurasian Steppe nomads
Ghalichi, A., Seidualy, M., Rohrlach, A. B., Musralina, L., Gnecchi‐Ruscone, G. A., Hermes, T. R., Khussainova, E., Kahbatkyzy, N., Bekmanov, B., Iksan, O. A., et al. (2026) · Science Advances · doi:10.1126/sciadv.aef0108
Nguyen, T. N., Cosgrove, E. J., Chen, N. X., Lehr, N., Lokey, M. G., Beaudry, F. E. G., Fitzpatrick, S. W., Bowman, R., Miller, K. E., Fitzpatrick, J. W., et al. (2026) · Current Biology · doi:10.1016/j.cub.2026.06.044 · Cited by 2
Genetic continuity and dietary change during the emergence of millet farming in northern China
Zhang, F., Wang, M., Guo, M., Xiong, Y., Ma, P., Duan, C., Zhang, R., Du, Z., Yuan, H., Zhang, H., et al. (2026) · Current Biology · doi:10.1016/j.cub.2026.06.046
Genomic signatures of female exogamy and cultural interaction in a Tang Dynasty patrilineal clan
Wang, Y., Huang, H., Song, G., Cao, P., Ma, J., Xu, Y., Zheng, J., Ma, H., Wang, R., Yang, X., et al. (2026) · Current Biology · doi:10.1016/j.cub.2026.06.086
Стамов, С., Chobanov, T., Wang, T., Stoeva, K., Momchilov, D., Aladzhov, A., Chobanov, K., Klasnakov, M., Stamov, G., Николов, М., et al. (2026) · Frontiers in Genetics · doi:10.3389/fgene.2026.1864752
Self-citationZhur, K. V., Leonova, M. V., Сергеевич, Ш. Ф., Pankratova, E. V., Сиренов, А. В., Коробов, Д. С., Dobrovol’skaya, M. V., Makarov, N. A., & Prokhortchouk, E. B. (2026) · Acta Naturae · doi:10.32607/actanaturae.27916
Chen, J., Ji, X., Chi, L., Xiong, M., Wu, L., Fu, M., Yang, F., Zhang, S., Li, C., & Chen, H. (2026) · Forensic Science International Genetics · doi:10.1016/j.fsigen.2026.103589
Wang, B., Chen, H., Xi, F., Bao, H., Wen, H., Du, P., Sun, C., Xiong, J., Zhang, B., Chang, X., et al. (2026) · Molecular Genetics and Genomics · doi:10.1007/s00438-026-02493-1
Kočí, J., Flegontova, O., Changmai, P., Vyazov, L. A., Cooper, L. R., Ashrafi, H., Şencan, Z., & Flegontov, P. (2026) · bioRxiv (Cold Spring Harbor Laboratory) · doi:10.64898/2026.08.11.744230
Feldman, M., Arauna, L. R., Carlhoff, S., Naegle, K., Radzevičiūtė, R., Drucker, D. G., Stirling, C. H., Barr, D., Reid, M., Nunn, P. D., et al. (2026) · Cell · doi:10.1016/j.cell.2026.07.044
Alaçamlı, E., Sasso, S., Didonna, R., Biagini, S. A., (Urd), I. R., Jonuks, T., Tõrv, M., Valk, H., Kivisild, T., Tambets, K., et al. (2026) · bioRxiv (Cold Spring Harbor Laboratory) · doi:10.64898/2026.08.13.744432
Shi, H., Bennett, E. A., Chen, G., Wang, H., Wang, T., Cao, P., Mao, R., Bai, F., Dai, Q., Liu, F., et al. (2026) · Cell · doi:10.1016/j.cell.2026.07.050 · Cited by 1
Wei, Y., Sanaullah, A., Zhi, D., & Zhang, S. (2026) · Human Population Genetics and Genomics · doi:10.47248/hpgg2606030009
Transgenerational continuity: Persistence as a dimension of inheritance and evolution
Szalay, J. (2026) · Biosystems · doi:10.1016/j.biosystems.2026.105949
A refined phylochronology of the second plague pandemic in Western Eurasia
Keller, M., Guellil, M., Slavin, P., Saag, L., Irdt, K., Kabral, H., Solnik, A., Malve, M., Valk, H., Крийска, А., et al. (2026) · Proceedings of the National Academy of Sciences · doi:10.1073/pnas.2534899123
O’Sullivan, R. J., Nordfors, U., Saari, N.-J., Majander, K., Taavitsainen, J., Salo, K., Rohrlach, A. B., Salmela, E., Lamnidis, T. C., Traverso, L., et al. (2026) · Genome biology · doi:10.1186/s13059-026-04277-7
Ancient DNA unveils distinctive ancestries in the Bronze and Iron Ages of East Tianshan
Ning, C., Wang, K., Wang, T., Ma, J., Zhao, X., Xi, T., Wang, Y., Cao, P., Gao, S., Feng, X., et al. (2026) · Science · doi:10.1126/science.adv1295
Deconvolving DNA mixtures with Demixtify
Woerner, A. E. (2026) · Forensic Science International Genetics · doi:10.1016/j.fsigen.2026.103624
Martin‐Moya, D., Grenier, J., Lanigan, L. T., Pelletier, J., Irving-Pease, E. K., Racimo, F., Bhérer, C., Schroeder, H., Hussin, J., Milot, E., et al. (2026) · Proceedings of the National Academy of Sciences · doi:10.1073/pnas.2523026123
Exhaustive measures to identify historical remains
Bergseth, E., Egeland, T., Staadig, A., Tillmar, A. O., & Kling, D. (2026) · Forensic Science International Genetics · doi:10.1016/j.fsigen.2026.103634
mixKIN: An ancestry-aware kinship estimation method for low coverage genomesPreprint
Kılıç, M. S., Malaspinas, A., & Koptekin, D. (2026) · bioRxiv (Cold Spring Harbor Laboratory) · doi:10.64898/2026.10.13.758828
Carrión, P. J. A., Olalde, Í., McCormick, M., Harper, K., Collado, M. I. G., Villalba‐Mouco, V., Jiménez-Arenas, J. M., Coromina, N., Vivó, D., Vergès, J. M., et al. (2026) · Cell · doi:10.1016/j.cell.2026.09.052
Self-citationLeonova, M. V., Reshetova, I. K., Zhur, K. V., Vashunina, D. A., Sharko, F. S., Maximov, N. G., Dobrovol’skaya, M. V., Makarov, N. A., & Prokhortchouk, E. (2026) · Acta Naturae · doi:10.32607/actanaturae.27986
Metadata
- Authors
- Ringbauer, H., Huang, Y., Akbari, A., Mallick, S., Olalde, I., Patterson, N., & Reich, D.
- Affiliations
- Harvard University (US)
- Max Planck Institute for Evolutionary Anthropology (DE)
- Broad Institute (US)
- Corresponding author
- Ringbauer, Harald
- Reich, David
- ORCID
- Venue
- Nature Genetics
- Published
- 2023-12-20
- Volume
- 56
- Issue
- 1
- Pages
- 143-151
- ISSN
- 1061-4036 (ISSN-L)
- 1546-1718
- PMC
- PMC10028887
- OpenAlex
- W4390070832
- Cited by
- 155
- References
- 65
- Citations by year
- 2026: 62 · 2025: 49 · 2024: 32 · 2023: 12
- FWCI
- 25.73
- Type
- journal article
- Language
- en
- Open access
- hybrid
- doi.org
- Locations
- Nature Genetics (publishedVersion, cc-by)
- bioRxiv (Cold Spring Harbor Laboratory) (acceptedVersion, cc-by-nc-nd)
- PubMed Central (publishedVersion, cc-by)
- PubMed (publishedVersion)
- PubMed Central (submittedVersion, cc-by-nc-nd)
- Funders
- Max-Planck-Gesellschaft
- U.S. Department of Health & Human Services | National Institutes of Health (HG012287)
- John Templeton Foundation (61220)
- Topics
- Life Sciences › Biochemistry, Genetics and Molecular Biology › Genetics › Forensic and Genetic Research
- Life Sciences › Biochemistry, Genetics and Molecular Biology › Genetics › Genetic diversity and population structure
- Life Sciences › Biochemistry, Genetics and Molecular Biology › Genetics › Genetic Associations and Epidemiology
- Keywords
- identity by descent, ancient DNA, hidden Markov models, genotype imputation, coancestry, Corded Ware, Yamnaya, Steppe ancestry
About these checks
Registry, retraction, Cites and statistics results are computed, not judged, with one exception: a printed reference that no index lists is read once by a model before it counts as a citation error. Claims are extracted by a model and kept only when their quote appears verbatim in the text; each cited source is then checked, with a model’s help, for whether it says what the claim relies on. Those verdicts can be wrong — read the claim’s quote and the cited source before relying on one.
Statistics and arithmetic are recomputed, not judged.
Confidence bands are shown only for fields calibrated on our annotated test set. None is calibrated yet, so no band is shown.
What counts as a claim ›How we measure confidence ›How we check this ›
Are you an author, or do you see a problem with this page? Request a review
