

The DOI matches its Crossref record; 81 of the 81 references it cites were found in a registry or an index.
Integrative molecular and clinical modeling of clinical outcomes to PD1 blockade in patients with metastatic melanoma
Open accessAbstract
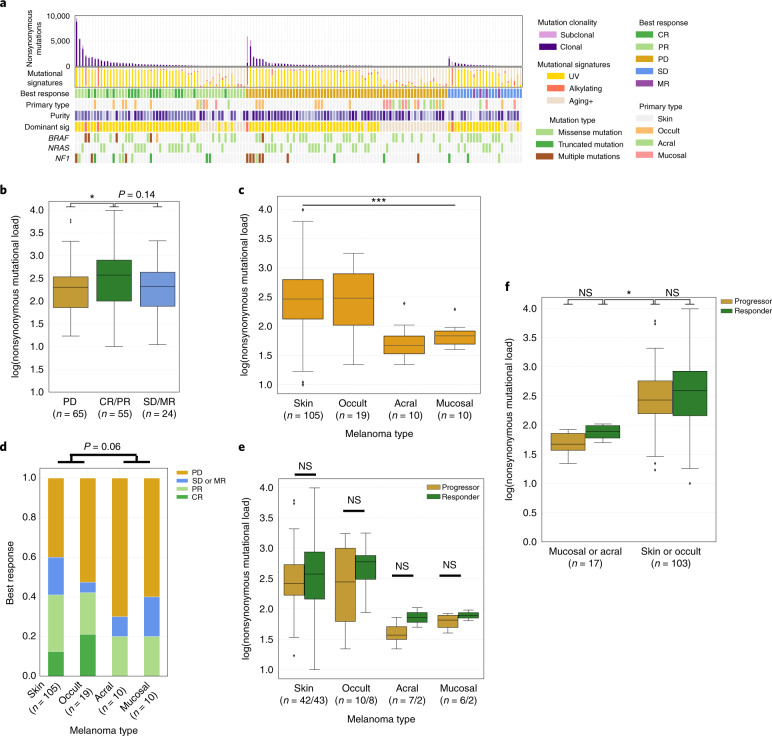
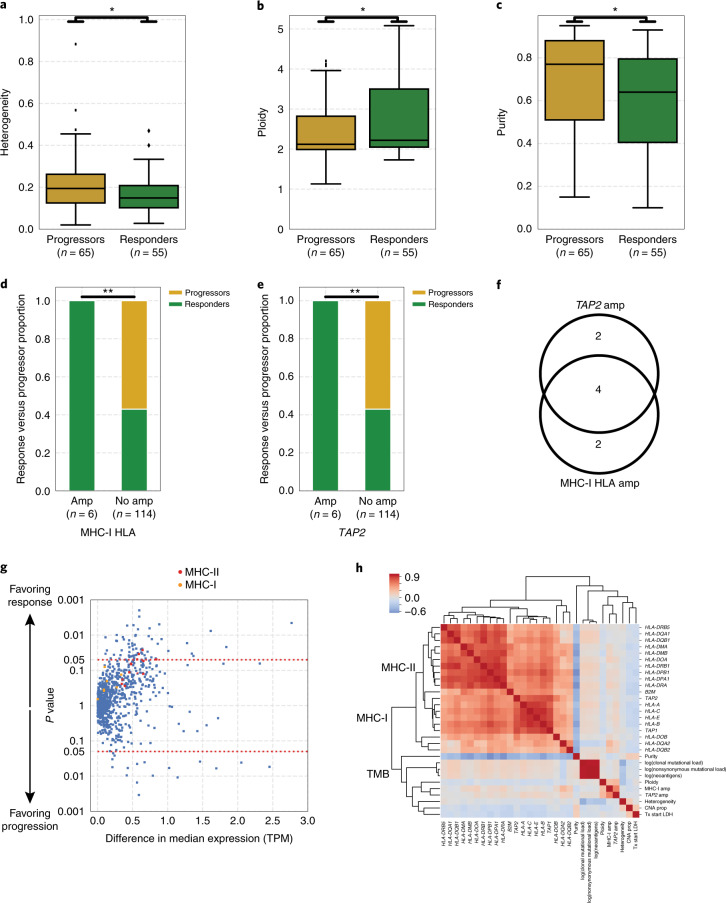
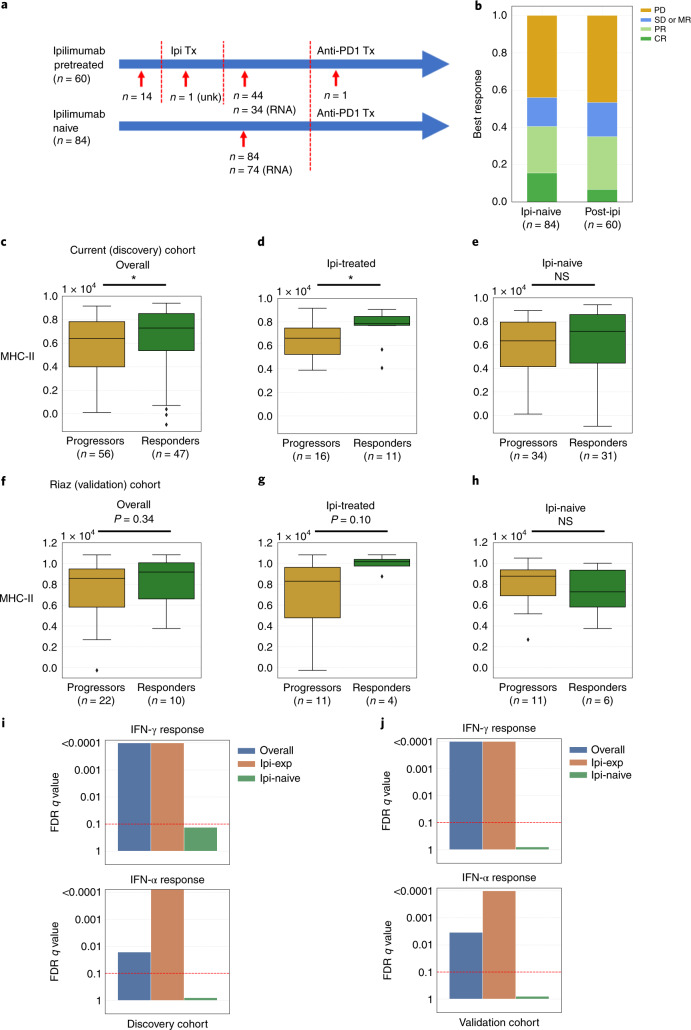
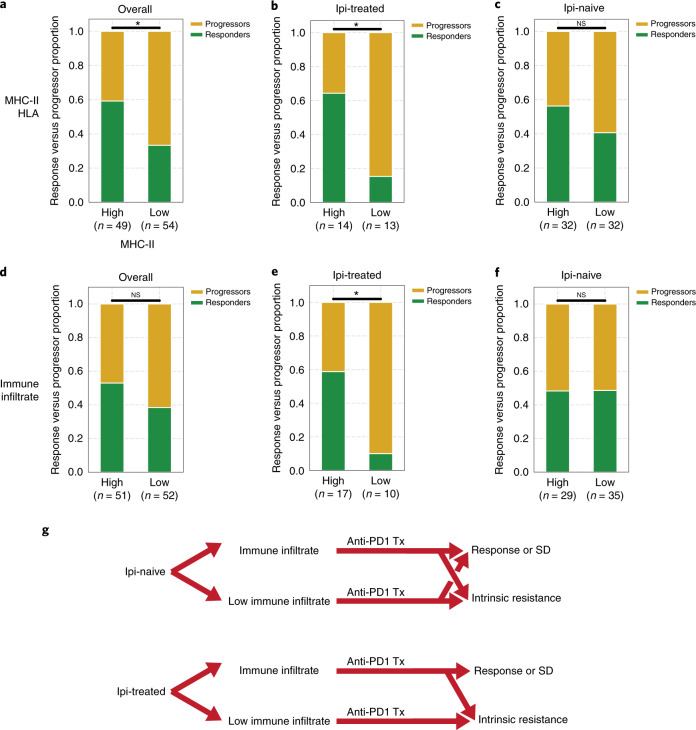
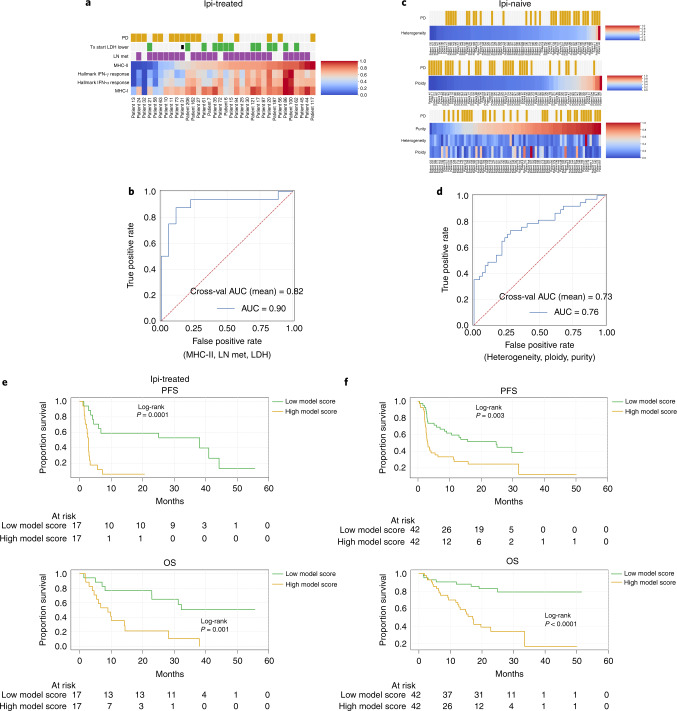
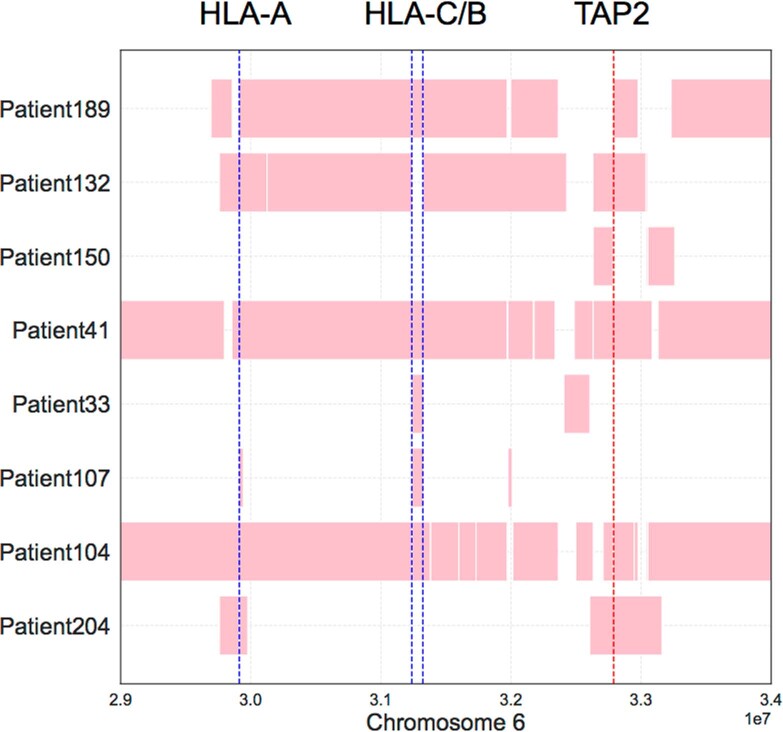
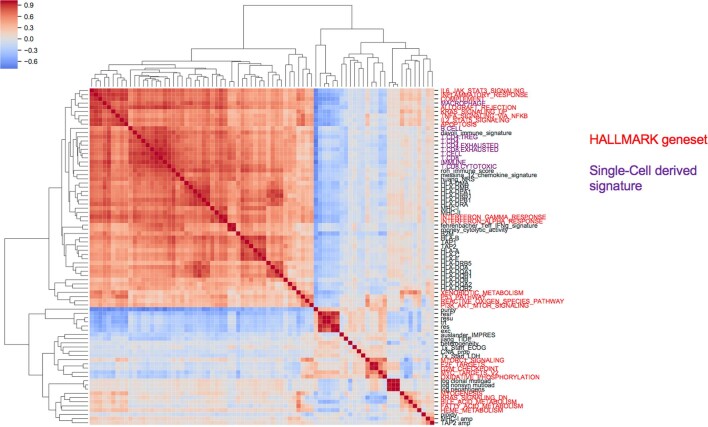
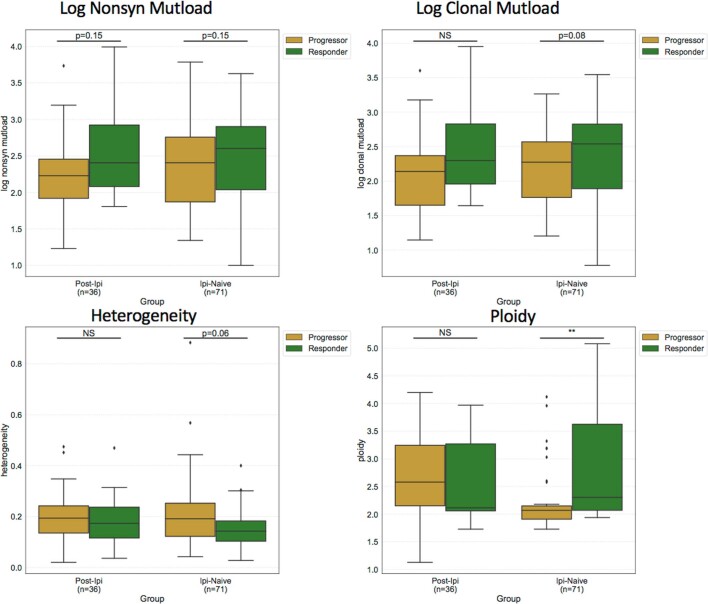
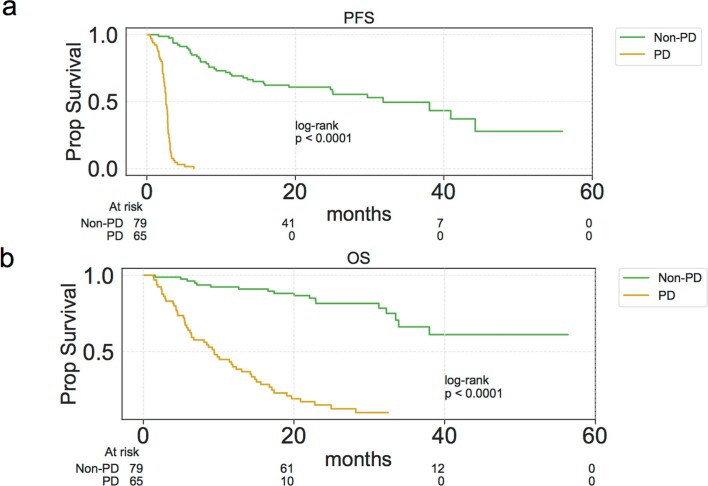
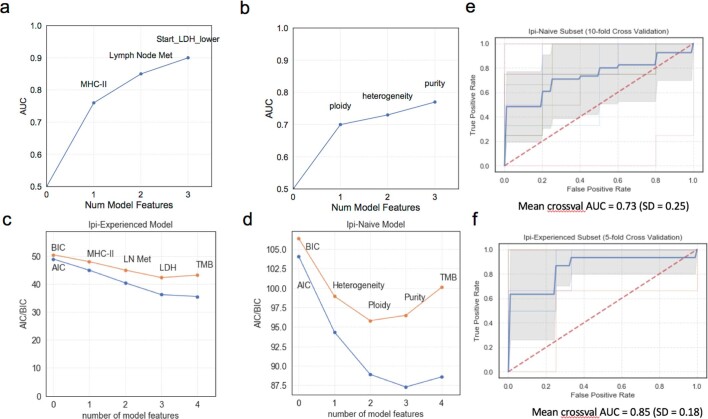
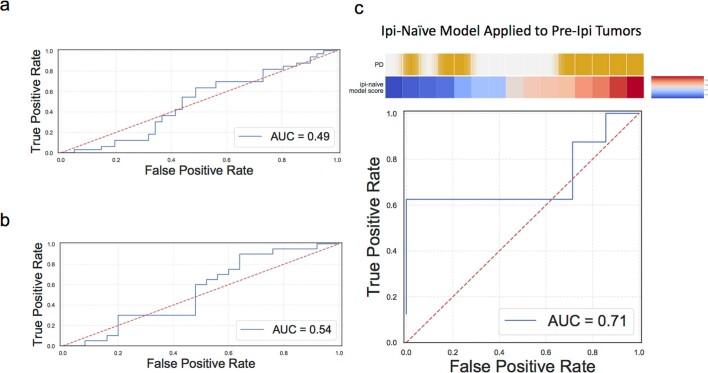
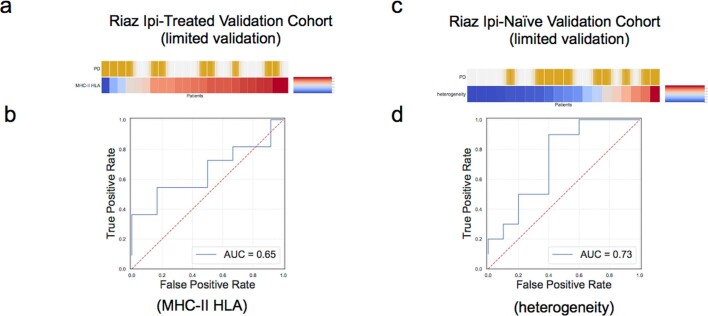
Immune-checkpoint blockade (ICB) has demonstrated efficacy in many tumor types, but predictors of responsiveness to anti-PD1 ICB are incompletely characterized. In this study, we analyzed a clinically annotated cohort of patients with melanoma (n = 144) treated with anti-PD1 ICB, with whole-exome and whole-transcriptome sequencing of pre-treatment tumors. We found that tumor mutational burden as a predictor of response was confounded by melanoma subtype, whereas multiple novel genomic and transcriptomic features predicted selective response, including features associated with MHC-I and MHC-II antigen presentation. Furthermore, previous anti-CTLA4 ICB exposure was associated with different predictors of response compared to tumors that were naive to ICB, suggesting selective immune effects of previous exposure to anti-CTLA4 ICB. Finally, we developed parsimonious models integrating clinical, genomic and transcriptomic features to predict intrinsic resistance to anti-PD1 ICB in individual tumors, with validation in smaller independent cohorts limited by the availability of comprehensive data. Broadly, we present a framework to discover predictive features and build models of ICB therapeutic response.
Overview
The claims and statistics of this paper haven’t been checked yet.
Run the check — free, no account needed. It reads the open-access text and checks the sources it cites.
Integrity signals
Registry
Cites
Statistics
Figures
Verification
Claims the paper makes
The claims and statistics of this paper haven’t been checked yet.
Run the check — free, no account needed. It reads the open-access text and checks the sources it cites.
Claims other papers make about this one
Each is checked against this paper’s own text: does it say what the citing paper says it does?
The source backs part of the claim, not all of it — or backs it for a different population, condition or comparison.
In the citing paper
“Our analysis identified distinct pathway signatures differentiating responders from nonresponders, with 78 pathways showing significant dysregulation (two-sided t test, P < 0.05; Fig. 6A, Supplementary Text, and fig. S4, A to E).”
From PathTIGR: A pathway topology-informed graph representation learning framework for immunotherapy response prediction (2026) · cites this paper as [34]
Experimental — accuracy not yet measuredThe source backs part of the claim, not all of it — or backs it for a different population, condition or comparison.
In the citing paper
“Analysis demonstrated statistically significant improvements in both overall survival (OS) and progression-free survival (PFS) among model-predicted responders compared to nonresponders (log-rank test, P < 0.0001; Fig. 2, E and F).”
From PathTIGR: A pathway topology-informed graph representation learning framework for immunotherapy response prediction (2026) · cites this paper as [34]
Experimental — accuracy not yet measuredThe source backs part of the claim, not all of it — or backs it for a different population, condition or comparison.
In the citing paper
“univariate Cox proportional hazard regression analysis further revealed that bone metastasis, brain metastasis, and the PathTIGR model were significantly associated with patient outcomes, with PathTIGR showing the lowest hazard ratio (HR = 0.189, P < 0.001; Fig. 2H)”
From PathTIGR: A pathway topology-informed graph representation learning framework for immunotherapy response prediction (2026) · cites this paper as [34]
Experimental — accuracy not yet measuredThe source backs part of the claim, not all of it — or backs it for a different population, condition or comparison.
In the citing paper
“Analysis demonstrated statistically significant improvements in both overall survival (OS) and progression-free survival (PFS) among model-predicted responders compared to nonresponders (log-rank test, P < 0.0001; Fig. 2, E and F).”
From PathTIGR: A pathway topology-informed graph representation learning framework for immunotherapy response prediction (2026) · cites this paper as [34]
Experimental — accuracy not yet measuredThe source backs part of the claim, not all of it — or backs it for a different population, condition or comparison.
In the citing paper
“Receiver operating characteristic (ROC) curve analysis demonstrated exceptional discriminatory performance for immune checkpoint inhibitor (ICI) response prediction, yielding an area under the ROC curve (AUC) of 0.975 [95% confidence interval (CI): 0.962 to 0.997; Fig. 2A].”
From PathTIGR: A pathway topology-informed graph representation learning framework for immunotherapy response prediction (2026) · cites this paper as [34]
Experimental — accuracy not yet measured
The cited source says what the claim attributes to it.
In the citing paper
“The clinical validation of PathTIGR predictions was established through the comparative analysis of objective response rates (ORRs) between PathTIGR-stratified responder and nonresponder subgroups, revealing significantly elevated response rates among predicted responders relative to nonresponders (Fisher’s exact test, P < 0.0001; Fig. 2D)”
From PathTIGR: A pathway topology-informed graph representation learning framework for immunotherapy response prediction (2026) · cites this paper as [34]
The check wasn’t confident either way, so it gives no verdict — never disputed.
In the citing paper
“precision-recall curve analysis was used, revealing an area under the precision-recall curve (AUPRC) of 0.969 (Fig. 2B).”
From PathTIGR: A pathway topology-informed graph representation learning framework for immunotherapy response prediction (2026) · cites this paper as [34]
Experimental — accuracy not yet measuredThe check wasn’t confident either way, so it gives no verdict — never disputed.
In the citing paper
“with PathTIGR achieving an AUC of 0.85 for 4-year survival prognostication (Fig. 2G)”
From PathTIGR: A pathway topology-informed graph representation learning framework for immunotherapy response prediction (2026) · cites this paper as [34]
Experimental — accuracy not yet measuredThe check wasn’t confident either way, so it gives no verdict — never disputed.
In the citing paper
“multivariate Cox regression analysis confirmed that PathTIGR remained an independent prognostic factor in training cohort (HR = 0.141, P < 0.001; Fig. 2H and Table 1)”
From PathTIGR: A pathway topology-informed graph representation learning framework for immunotherapy response prediction (2026) · cites this paper as [34]
Experimental — accuracy not yet measuredThe check wasn’t confident either way, so it gives no verdict — never disputed.
In the citing paper
“maintaining AUC values consistently exceeding 0.8 at 2-year and 3-year intervals”
From PathTIGR: A pathway topology-informed graph representation learning framework for immunotherapy response prediction (2026) · cites this paper as [34]
Experimental — accuracy not yet measuredThe check wasn’t confident either way, so it gives no verdict — never disputed.
In the citing paper
“The PathTIGR model consistently outperformed all these individual clinical variables in predicting patient prognosis (fig. S1).”
From PathTIGR: A pathway topology-informed graph representation learning framework for immunotherapy response prediction (2026) · cites this paper as [34]
Experimental — accuracy not yet measuredIn the citing paper
“We observed similar results in a larger validation cohort of advanced melanoma patients treated with ICB (Liu et al., 2019) (Figures 6C, S6E, and S6F).”
From Microbiota triggers STING-type I IFN-dependent monocyte reprogramming of the tumor microenvironment (2021) · cites this paper as Liu et al., 2019
Self-check
Percentages, sums and reported differences re-computed from the paper’s own numbers.
The self-check needs the paper’s full text.
Citations
Cites
Subramanian, A., Tamayo, P., Mootha, V. K., Mukherjee, S., Ebert, B. L., Gillette, M. A., Paulovich, A., Pomeroy, S. L., Golub, T. R., Lander, E. S., et al. (2005) · Proceedings of the National Academy of Sciences · doi:10.1073/pnas.0506580102 · Cited by 53,625
STAR: ultrafast universal RNA-seq aligner
Dobin, A., Davis, C. A., Schlesinger, F., Drenkow, J., Zaleski, C., Jha, S., Batut, P., Chaisson, M., & Gingeras, T. R. (2013) · Bioinformatics · doi:10.1093/bioinformatics/bts635 · Cited by 51,709
PD-1 and PD-L1 Immune Checkpoint Blockade to Treat Breast Cancer
Hartkopf, A. D., Taran, F., Wallwiener, M., Walter, C. B., Krämer, B., Grischke, E., & Brucker, S. Y. (2016) · Breast Care · doi:10.1159/000453569 · Cited by 30,989
RSEM: accurate transcript quantification from RNA-Seq data with or without a reference genome
Li, B., & Dewey, C. N. (2011) · BMC Bioinformatics · doi:10.1186/1471-2105-12-323 · Cited by 22,179
Improved Survival with Ipilimumab in Patients with Metastatic Melanoma
Hodi, F. S., O'Day, S. J., McDermott, D. F., Weber, R. W., Sosman, J. A., Haanen, J. B., Gonzalez, R., Robert, C., Schadendorf, D., Hassel, J. C., et al. (2010) · New England Journal of Medicine · doi:10.1056/nejmoa1003466 · Cited by 15,155
Self-citationLearning the parts of objects by non-negative matrix factorization
Lee, D. D., & Seung, H. S. (1999) · Nature · doi:10.1038/44565 · Cited by 14,193
The Molecular Signatures Database Hallmark Gene Set Collection
Liberzon, A., Birger, C., Thorvaldsdóttir, H., Ghandi, M., Mesirov, J. P., & Tamayo, P. (2015) · Cell Systems · doi:10.1016/j.cels.2015.12.004 · Cited by 13,807
Robust enumeration of cell subsets from tissue expression profiles
Newman, A. M., Liu, C. L., Green, M. R., Gentles, A. J., Feng, W., Xu, Y., Hoang, C. D., Diehn, M., & Alizadeh, A. A. (2015) · Nature Methods · doi:10.1038/nmeth.3337 · Cited by 13,224
Pembrolizumab versus Chemotherapy for PD-L1-Positive Non-Small-Cell Lung Cancer
Reck, M., Rodríguez-Abreu, D., Robinson, A. G., Hui, R., Csőszi, T., Fülöp, A., Gottfried, M., Peled, N., Tafreshi, A., Cuffe, S., et al. (2016) · New England Journal of Medicine · doi:10.1056/nejmoa1606774 · Cited by 10,089
Signatures of mutational processes in human cancer
Initiative, A. P. C. G., Alexandrov, L. B., ICGC Breast Cancer Consortium, ICGC MMML-Seq Consortium, PedBrain, I., Nik-Zainal, S., Wedge, D. C., Aparicio, S. A. J. R., Behjati, S., Biankin, A. V., et al. (2013) · Nature · doi:10.1038/nature12477 · Cited by 9,660
Cited by
Sorted by citations
Items 501–600 of 1,003
Unlock the code of MHC II-enabled Cancer immunotherapy
Liu, J., Song, X., Guo, W., Liu, W., Xu, S., Yang, Y., Chu, X., & Lei, Z. (2025) · Critical Reviews in Oncology/Hematology · doi:10.1016/j.critrevonc.2025.104813 · Cited by 8
Tiedje, V., Greenberg, J., Qin, T., Im, S.-Y., Krishnamoorthy, G. P., Boucai, L., Xu, B., French, J. D., Sherman, E. J., Ho, A. L., et al. (2025) · Journal of Clinical Investigation · doi:10.1172/jci191781 · Cited by 9
Liu, Y., Zhang, D., Liu, T., Wang, A., Wang, G., & Zhao, Y. (2025) · Briefings in Bioinformatics · doi:10.1093/bib/bbaf467 · Cited by 8
Wang, X., Li, T., Eljilany, I., Soupir, A. C., Radmacher, M. D., Agius, P., Sukrithan, V., Ratan, A., McCarter, M. D., Salhia, B., et al. (2025) · Nature Communications · doi:10.1038/s41467-025-65016-3 · Cited by 8
Fernandez, N. R., Chang, Y., Nunes, N. M., Dimayacyac, J. R., Levine, A., Ringel, A., Negm, L., Ercan, A. B., Hess, J. M., Ahmad, O., et al. (2025) · Nature Genetics · doi:10.1038/s41588-025-02420-x · Cited by 8
Stochasticity in cancer immunotherapy stems from rare but functionally critical Spark T cells
Salazar-Cavazos, E., Jia, D., Missolo-Koussou, Y., Kenet, A. L., Achar, S. R., Dada, H., Kondo, T., Krishnan, A. Y., Taylor, N. N., Klemen, N. D., et al. (2026) · Cell · doi:10.1016/j.cell.2025.12.026 · Cited by 8
Uncovering spatially resolved functional genomics with CRISPR screen sequencing
Zhang, H., Zhang, Z., Wang, P., Xu, T., Chen, X., Zhao, Y., Lin, S., Cai, W., Ren, P., Luo, C., et al. (2026) · Cell · doi:10.1016/j.cell.2026.04.049 · Cited by 9
Transcriptomic signatures of tumors undergoing T cell attack
Gokuldass, A., Schina, A., Lauss, M., Harbst, K., Chamberlain, C. A., Draghi, A., Westergaard, M. C. W., Nielsen, M., Papp, K., Sztupinszki, Z. M., et al. (2021) · Cancer Immunology Immunotherapy · doi:10.1007/s00262-021-03015-1 · Cited by 8
Dai, J., Bai, X. L., Gao, X., Tang, L., Chen, Y., Sun, L., Wei, X., Li, C., Qi, Z., Kong, Y., et al. (2023) · Journal for ImmunoTherapy of Cancer · doi:10.1136/jitc-2022-005937 · Cited by 9
Vanni, I., Pastorino, L., Tanda, E. T., Andreotti, V., Dalmasso, B., Solari, N., Mascherini, M., Cabiddu, F., Guadagno, A., Coco, S., et al. (2023) · International Journal of Molecular Sciences · doi:10.3390/ijms24054302 · Cited by 8
Wang, Q., Li, X., Qiu, J., He, Y., Wu, J., Li, J., Liu, W., & Han, J. (2023) · Computational and Structural Biotechnology Journal · doi:10.1016/j.csbj.2023.04.004 · Cited by 8
Shen, X., Zuo, X., Liang, L., Wang, L., & Luo, B. (2023) · Frontiers in Immunology · doi:10.3389/fimmu.2023.1162843 · Cited by 8
Ralser, D. J., Herr, E., de Vos, L., Kulcsár, Z., Zarbl, R., Klümper, N., Gielen, G. H., Maas, A. P., Hoffmann, F., Dietrich, J., et al. (2023) · Biomarker Research · doi:10.1186/s40364-023-00508-2 · Cited by 8
PATH-SURVEYOR: pathway level survival enquiry for immuno-oncology and drug repurposing
Obermayer, A., Chang, D., Nobles, G., Teng, M., Tan, A. C., Wang, X., Chen, Y. A., Eschrich, S. A., Rodrı́guez, P. C., Grass, G. D., et al. (2023) · BMC Bioinformatics · doi:10.1186/s12859-023-05393-y · Cited by 8
Wang, G., Ji, X., Wang, H., Tang, X., Xing, X., & Ji, J. (2023) · Chinese Journal of Cancer Research · doi:10.21147/j.issn.1000-9604.2023.03.09 · Cited by 8
Synthetic viability induces resistance to immune checkpoint inhibitors in cancer cells
Liu, M., Dong, Q., Chen, B., Liu, K., Zhao, Z., Wang, Y., Zhuang, S., Han, H., Shi, X., Jin, Z., et al. (2023) · British Journal of Cancer · doi:10.1038/s41416-023-02404-w · Cited by 8
Cammann, C., Kulla, J., Wiebusch, L., Walz, C., Zhao, F., Lowinus, T., Topfstedt, E., Mishra, N., Henklein, P., Bommhardt, U., et al. (2023) · Biomedicine & Pharmacotherapy · doi:10.1016/j.biopha.2023.115635 · Cited by 8
Self-citationRoussot, N., Lecuelle, J., Dalens, L., Truntzer, C., & Ghiringhelli, F. (2023) · Journal for ImmunoTherapy of Cancer · doi:10.1136/jitc-2023-007763 · Cited by 8
Integrative Analysis of Germline Rare Variants in Clear and Non–clear Cell Renal Cell Carcinoma
Han, S. H., Camp, S. Y., Chu, H., Collins, R. L., Gillani, R., Park, J., Bakouny, Z., Ricker, C. A., Reardon, B. M., Moore, N., et al. (2024) · European Urology Open Science · doi:10.1016/j.euros.2024.02.006 · Cited by 9
Lins, F. V., Bispo, E. C. I., Rodrigues, N. S., Souto-Silva, M. V., Carvalho, J. L., Gelfuso, G. M., & Saldanha‐Araújo, F. (2024) · Biomedicines · doi:10.3390/biomedicines12051012 · Cited by 8
Predicting immune checkpoint therapy response in three independent metastatic melanoma cohorts
Szadai, L., Bartha, Á., Plá, I., Lakatos, A. I. T., Pal, D., Lengyel, A., de Almeida, N. P., Jánosi, Á. J., Nogueira, F. C. S., Szeitz, B., et al. (2024) · Frontiers in Oncology · doi:10.3389/fonc.2024.1428182 · Cited by 8
Wang, Y., Guan, Y., Lai, X., Liu, Y., Chang, Z., Wang, X., Wang, Q., Liu, J., Zhao, J., Yang, S., et al. (2024) · Briefings in Bioinformatics · doi:10.1093/bib/bbae648 · Cited by 8
Ba, H., Zhu, F., Zhang, X., Mei, Z., & Zhu, Y. (2023) · Therapeutic Advances in Medical Oncology · doi:10.1177/17588359221148918 · Cited by 8
Yan, H., Zhang, L., & Li, R. (2023) · Scientific Reports · doi:10.1038/s41598-023-43500-4 · Cited by 8
DRG2 is required for surface localization of PD-L1 and the efficacy of anti-PD-1 therapy
Choi, S. H., Mani, M., Kim, J., Cho, W. J., Martin, T. F. J., Kim, J. H., Chu, H. S., Jeong, W. J., Won, Y.-W., Lee, B. J., et al. (2024) · Cell Death Discovery · doi:10.1038/s41420-024-02027-x · Cited by 8
Biology confirmed but biomarkers elusive in melanoma immunotherapy
Luke, J. J., & Ascierto, P. A. (2020) · Nature Reviews Clinical Oncology · doi:10.1038/s41571-020-0328-8 · Cited by 8
Fan, G., Xie, T., Tan, Q., Lou, N., Wang, S., Han, X., & Shi, Y. (2023) · iScience · doi:10.1016/j.isci.2023.107894 · Cited by 8
Shi, X., Shi, D.-M., Yin, Y., Wu, Y., Chen, W., Yu, Y., & Wang, X. (2024) · Cellular Signalling · doi:10.1016/j.cellsig.2024.111072 · Cited by 8
Wang, Y., Hu, M., Finn, O. J., & Wang, X. (2024) · Cancer Immunology Research · doi:10.1158/2326-6066.cir-23-0932 · Cited by 7
Gide, T. N., Mao, Y., Scolyer, R. A., Long, G. V., & Wilmott, J. S. (2024) · Clinical Cancer Research · doi:10.1158/1078-0432.ccr-24-1109 · Cited by 7
Wang, X., Jin, J., Yan, H., Liu, J., Huang, S., Bai, H., Guo, M., Cheng, X., Deng, T., Ba, Y., et al. (2025) · Science Translational Medicine · doi:10.1126/scitranslmed.ado4370 · Cited by 7
Wang, Q., Li, S., Wu, Y., Yu, X., Dai, Y., Wang, Y., Li, L., Yang, M., Lin, K., Shao, W., et al. (2025) · Research · doi:10.34133/research.0915 · Cited by 7
The Roles of PTEN in Melanoma Suppression
Parkman, G. L., Xu, X., Holmen, S. L., & Karreth, F. A. (2025) · Pigment Cell & Melanoma Research · doi:10.1111/pcmr.70054 · Cited by 7
Esposito, M., Fang, C., Wei, Y., Pozzan, A., Beato, C., Su, X., Hutton, J. E., Reed, T. J., Hang, X., Perini, E. D., et al. (2025) · iScience · doi:10.1016/j.isci.2025.113675 · Cited by 7
Lee, K.-H., Sears, T. J., Zanetti, M., & Carter, H. K. (2026) · Nature Communications · doi:10.1038/s41467-026-68651-6 · Cited by 7
Yang, Z., Wei, S., Duan, H., Wang, X., Zhang, D., Kiang, K. M. Y., Deng, Y., Yang, Y., Ku, Y., Hu, W., et al. (2026) · Nature Communications · doi:10.1038/s41467-026-68748-y · Cited by 7
Mints, M., Sample, R. A., Parikh, A. S., Zaretsky, J. M., Qi, Z., Law, T. E., Wang, F., Barrett, T. F., Mullins, R. D. Z., Reeb, A. N., et al. (2026) · Cell Reports Medicine · doi:10.1016/j.xcrm.2026.102715 · Cited by 7
Vredevoogd, D. W., Apriamashvili, G., & Peeper, D. S. (2021) · Immuno-Oncology Technology · doi:10.1016/j.iotech.2021.100043 · Cited by 7
Luo, J., Chen, C., Liu, Z., & Wang, X. (2023) · Frontiers in Cell and Developmental Biology · doi:10.3389/fcell.2022.1045130 · Cited by 7
Zhang, L., Cao, L., Li, S., Wang, L., Song, Y., Huang, Y., Xu, Z., He, J., Wang, M., & Li, K. (2023) · Journal of Immunotherapy · doi:10.1097/cji.0000000000000475 · Cited by 7
CD52 mRNA expression predicts prognosis and response to immune checkpoint blockade in melanoma
de Vos‐Hillebrand, L., Fietz, S., Hillebrand, P., Kulcsár, Z., Diop, M. Y., Hollick, S., Maas, A. P., Strieth, S., Landsberg, J., & Dietrich, D. (2023) · Pigment Cell & Melanoma Research · doi:10.1111/pcmr.13151 · Cited by 7
Dufau, C., Genais, M., Mucher, E., Jung, B., Garcia, V., Montfort, A., Tosolini, M., Clarke, C. J., Medin, J. A., Levade, T., et al. (2024) · Frontiers in Immunology · doi:10.3389/fimmu.2024.1421432 · Cited by 7
Spatial proteomics reveals sirtuin 1 to be a determinant of T-cell infiltration in human melanoma
Placke, J., Bottek, J., Váraljai, R., Shannan, B., Scharfenberg, S., Krisp, C., Spangenberg, P., Soun, C., Siemes, D., Borgards, L., et al. (2024) · British Journal of Dermatology · doi:10.1093/bjd/ljae433 · Cited by 7
Self-citationTCGEx: a powerful visual interface for exploring and analyzing cancer gene expression data
Kus, M. E., Sahin, C., Kılıç, E., Askin, A., Ozgur, M. M., Karahanogullari, G., Aksit, A., O’Connell, R. M., & Ekiz, H. A. (2025) · EMBO Reports · doi:10.1038/s44319-025-00407-7 · Cited by 7
Smithy, J. W., Peng, X., Ehrich, F. D., Moy, A. P., Yosofvand, M., Maher, C. A., Aleynick, N., Vanguri, R. S., Zhuang, M., Lee, J., et al. (2025) · Cell Reports · doi:10.1016/j.celrep.2025.115554 · Cited by 7
Li, J., Xu, N., Hu, L., Xu, J., Huang, Y., Wang, D., Chen, F., Wang, Y., Jiang, J., Hong, Y., et al. (2025) · Cancer Immunology Immunotherapy · doi:10.1007/s00262-025-04071-7 · Cited by 7
081 Ultraviolet light-induced collagen degradation inhibits melanoma invasion
Budden, T., Gaudy‐Marqueste, C., Porter, A., Kay, E. J., Gurung, S., Earnshaw, C. H., Roeck, K., Craig, S., Traves, V., Krutmann, J., et al. (2021) · Journal of Investigative Dermatology · doi:10.1101/2021.01.27.428482 · Cited by 7
Howell, A. V., Gebregziabher, M., THIERS, B. H., Graboyes, E. M., Paulos, C. M., Wrangle, J. M., Hunt, K. J., & Wallace, K. (2022) · Journal of Geriatric Oncology · doi:10.1016/j.jgo.2022.05.005 · Cited by 7
Netie: inferring the evolution of neoantigen–T cell interactions in tumors
Lu, T., Park, S., Han, Y., Wang, Y., Hubert, S. M., Futreal, P. A., Wistuba, I. I., Heymach, J. V., Reuben, A., Zhang, J. J., et al. (2022) · Nature Methods · doi:10.1038/s41592-022-01644-7 · Cited by 7
Li, Z., Wang, X., Yang, Y., Shi, F., Zhang, W., Wang, Q., & Wang, S. (2022) · Cells · doi:10.3390/cells11233841 · Cited by 7
Ruan, Z., Zhang, Y., Quan, Q., Jiang, J., Wang, Q., Zhang, Y., & Peng, R. (2022) · Frontiers in Genetics · doi:10.3389/fgene.2022.1004467 · Cited by 7
Ruan, H., Oike, T., Sato, H., Ando, K., & Ohno, T. (2023) · Cancers · doi:10.3390/cancers15041210 · Cited by 7
Status quo and future perspectives of molecular diagnostics in dermatology
Gebhardt, C., Eyerich, K., & Garzorz‐Stark, N. (2023) · JDDG Journal der Deutschen Dermatologischen Gesellschaft · doi:10.1111/ddg.15010 · Cited by 7
Conway, J. R., Taylor-Weiner, A. N., Braun, D. A., Bakouny, Z., Choueiri, T. K., & Allen, E. M. V. (2020) · medRxiv · doi:10.1101/2020.10.30.20222356 · Cited by 7
Self-citationInconsistent prediction capability of ImmuneCells.Sig across different RNA-seq datasets
Xu, X., Xu, C., Yang, W., & Yu, R. (2021) · Nature Communications · doi:10.1038/s41467-021-24303-5 · Cited by 7
Is tumor mutational burden predictive of response to immunotherapy?Preprint
Gurjao, C., Tsukrov, D. I., Imakaev, M., Luquette, L. J., & Mirny, L. A. (2023) · doi:10.7554/elife.87465.1 · Cited by 8
The C2 domain augments Ras GTPase-activating protein catalytic activity
Paul, M. E., Chen, D., Vish, K. J., Lartey, N. L., Hughes, E., Freeman, Z. T., Saunders, T. L., Stiegler, A. L., King, P. D., & Boggon, T. J. (2025) · Proceedings of the National Academy of Sciences · doi:10.1073/pnas.2418433122 · Cited by 7
Kovacs, S., Kovács, T., Lánczky, A., Paál, Á., Hegedűs, Z. I., Sayour, N. V., Szabó, L., Kovács, A., Bianchini, G., Ferdinandy, P., et al. (2025) · British Journal of Pharmacology · doi:10.1111/bph.70052 · Cited by 6
Modeling anti-tumor immune responses using patient-derived melanoma organoids
Kaminska, K. K., Phung, B., Karlström, J., Lauss, M., Harbst, K., Svensson, T., Pietras, K., Nielsen, K., Carneiro, A., Ekedahl, H., et al. (2025) · Cancer Immunology Immunotherapy · doi:10.1007/s00262-025-04269-9 · Cited by 6
Immune Score Indicator for the Survival of Melanoma Patients Based on Tumor Microenvironment
Ning, X., Li, R., Zhang, B., Wang, Y., Zhou, Z., Ji, Z., Lyu, X., & Chen, Z. (2021) · International Journal of General Medicine · doi:10.2147/ijgm.s336105 · Cited by 6
Su, X., Fu, C., Liu, F., Bian, R., & Jing, P. (2023) · Environmental Toxicology · doi:10.1002/tox.23887 · Cited by 6
Chen, Y., Jin, C., Cui, J., Diao, Y., Wang, R., Xu, R., Yao, Z., Wei, W., & Li, X. (2023) · International Journal of Molecular Sciences · doi:10.3390/ijms241713209 · Cited by 6
PCDH11X mutation as a potential biomarker for immune checkpoint therapies in lung adenocarcinoma
Liu, M., Yang, M., Zhang, B., Xia, S., Zhao, J., Yan, L., Ren, Y., Guo, H., & Zhao, J. (2024) · Journal of Molecular Medicine · doi:10.1007/s00109-024-02450-8 · Cited by 6
Neutrophil extracellular trap genes predict immunotherapy response in gastric cancer
Sun, N., Jiang, J., Chen, B., Chen, Y., Wu, H., Wang, H., & Chen, J. (2024) · Heliyon · doi:10.1016/j.heliyon.2024.e37357 · Cited by 6
Fu, C., Gu, H., Sun, L., Wang, Z., Zhang, Q., Luo, N., Chen, D., & Zhou, T. H. (2024) · Investigational New Drugs · doi:10.1007/s10637-024-01477-5 · Cited by 6
Wen, J., Wang, Y., Wang, S., Liang, Y., Ou, Q., Ou, Q., Bao, H., Zhao, K., & Wang, Y. (2025) · Journal of Translational Medicine · doi:10.1186/s12967-025-06467-6 · Cited by 6
Specific oncogene activation of the cell of origin in mucosal melanoma
Babu, S., Chen, J., Baron, C. S., Sun, K., Robitschek, E. J., McConnell, A. M., Wu, C., Dedeilia, A., Sade-Feldman, M., Modhurima, R., et al. (2025) · Nature Communications · doi:10.1038/s41467-025-61937-1 · Cited by 6
Self-citationADPRH is a prognosis-related biomarker and correlates with immune infiltrates in low grade glioma
Zhang, C., Wang, L., Liu, H., Deng, G., Xu, P., Tan, Y., Xu, Y., Liu, B., Chen, Q., & Tian, D. (2021) · Journal of Cancer · doi:10.7150/jca.51643 · Cited by 6
Predictive and prognostic significance of BRCAness in HER2-negative breast cancer
Sueta, A., Yamamoto‐Ibusuki, M., Tomiguchi, M., Fujiki, Y., Goto‐Yamaguchi, L., Iwase, H., & Yamamoto, Y. (2022) · Breast Cancer · doi:10.1007/s12282-021-01319-9 · Cited by 6
Research landscape and trends of melanoma immunotherapy: A bibliometric analysis
Liu, Y., Yu, L., Liang, Y., Cheng, X., Jiang, S., Yu, H., Zhang, Z., Lu, L., Qu, B., Chen, Y., et al. (2023) · Frontiers in Oncology · doi:10.3389/fonc.2022.1024179 · Cited by 6
Chen, C., Liu, H., Li, Y., & Liu, J. (2023) · Scientific Reports · doi:10.1038/s41598-023-40185-7 · Cited by 6
Long, J., Li, R., Wang, D., Liu, H., Tian, J., Ding, Z., Yan, L., Hong, J., Hong, J.-G., Tian, B.-W., et al. (2023) · International Immunopharmacology · doi:10.1016/j.intimp.2023.111281 · Cited by 6
Liu, B., He, S., Li, C., Li, Z., Feng, C., Wang, H., Tu, C., & Li, Z. (2024) · Frontiers in Immunology · doi:10.3389/fimmu.2023.1321616 · Cited by 6
ENPEP as a potential predictor of immune checkpoint inhibitor efficacy
Wang, A., Chu, H., Jin, Z., Gong, Z., Jia, Q., & Zhu, B. (2021) · Cancer Medicine · doi:10.1002/cam4.4475 · Cited by 6
Muccioli, S., Ciaccio, R., Brillo, V., & Leanza, L. (2022) · Cell Death Discovery · doi:10.1038/s41420-022-01087-1 · Cited by 6
IRRS, an Immune-Cell-Pair-Based Prognosis Model for Cutaneous Melanoma
Li, M., Long, X., Bu, W., Zhang, G., Deng, G., Liu, Y., Su, J., Huang, K., & Zhao, S. (2022) · Frontiers in Immunology · doi:10.3389/fimmu.2023.1112181 · Cited by 6
Melanoma in a patient with DNMT3A overgrowth syndromePreprint
Chen, D. Y., Sutton, L. A., Ramakrishnan, S. M., Duncavage, E. J., Heath, S. E., Compton, L. A., Miller, C. A., & Ley, T. J. (2023) · Molecular Case Studies · doi:10.1101/mcs.a006267 · Cited by 6
Single-cell insights into HNSCC tumor heterogeneity and programmed cell death pathways
Chai, Y., Zhang, J., Shao, W., & Zhang, Z. (2025) · Translational Oncology · doi:10.1016/j.tranon.2025.102341 · Cited by 5
Noh, K., Tolkach, Y., Helbig, D., Barroso, V. M., Foerster, Y., Schlaak, M. S., Biedermann, T., Büttner, R., & Persa, O. (2025) · Clinical Cancer Research · doi:10.1158/1078-0432.ccr-25-0889 · Cited by 5
SPP1+ Neutrophils Mediate Resistance to Immune Checkpoint Blockade in BAP1-Inactivated Tumors
Shi, J., Huang, S., Zhou, Y., Zheng, G., Zhang, Z., Fan, X., & Shen, J. (2025) · Cancer Research · doi:10.1158/0008-5472.can-24-4962 · Cited by 5
Liu, S., Yuan, Y., He, J., Zhou, Y., Wang, Y., Ye, X., Wang, J., & Zhang, J. (2025) · Frontiers in Immunology · doi:10.3389/fimmu.2025.1666121 · Cited by 6
Chen, C., Shao, Y., Fan, X., Huang, Z., Lu, T., Gao, R., Yu, Q., Li, S., Huang, Q., Yang, X. F., et al. (2025) · npj Precision Oncology · doi:10.1038/s41698-025-01217-9 · Cited by 5
Zaghla, B. K. Q., Safyürek, Z., Gröger, D., Mecklenbräuker, S., Lingstädt, N.-S., Popp, O., Spengler, J., Haji, M., Montesion, M., Albacker, L. A., et al. (2026) · Journal for ImmunoTherapy of Cancer · doi:10.1136/jitc-2025-013271 · Cited by 5
MacLean, M. R., Bernardoni, B. L., Fernando, W., Petrarolo, G., D’Agostino, I., Dean, C. A., Venkatesh, J., Hughes, C. S., Goralski, K. B., Subramanian, G., et al. (2026) · iScience · doi:10.1016/j.isci.2026.114863 · Cited by 5
Gu, L., Zhang, Q., Liang, Q., Peng, C., Wang, Y., Wang, C., Li, Z., Tan, Y., Zhou, Y. H., Bi, Q., et al. (2026) · Nature Communications · doi:10.1038/s41467-026-70978-z · Cited by 5
A Foundation Model of Cancer Genotype Enables Precise Predictions of Therapeutic Response
Kong, J., Lee, I., Boecher, D., Singhal, A., Kelly, M. R., Moon, J., Ahn, C. H., Ock, C., Pratt, D. R., Kumar, T., et al. (2026) · Cancer Discovery · doi:10.1158/2159-8290.cd-25-1735 · Cited by 5
Recurrent ZC3H18 mutations stabilize oncogenic endogenous retroviral RNA
Tanu, T., Cox, A. M., Karlow, J. A., Sharma, P., Sun, K., He, X., Babu, S., Roelofs, M. K., Jeon, E., Chen, J., et al. (2026) · Cell Reports · doi:10.1016/j.celrep.2026.117526 · Cited by 5
Self-citationLiu, Y., Lin, W. C., Qian, H., Yang, Y., Zhou, X., Wu, C., Pan, X., Liu, Y., & Wang, G. (2024) · BMC Medical Genomics · doi:10.1186/s12920-023-01785-4 · Cited by 5
Tumor stroma-derived ANGPTL2 potentiates immune checkpoint inhibitor efficacy
Horiguchi, H., Kadomatsu, T., Yamashita, T., Yumoto, S., Horino, T., Sato, M., Terada, K., Miyata, K., Ichigozaki, Y., Kimura, T., et al. (2024) · Cancer Gene Therapy · doi:10.1038/s41417-024-00757-9 · Cited by 5
Biomaterials-assisted cancer vaccine delivery: preclinical landscape, challenges, and opportunities
Chen, M., Zhou, Y. X., Fù, Y., Wang, Q., Wu, C., Pan, X., & Quan, G. (2024) · Expert Opinion on Drug Delivery · doi:10.1080/17425247.2024.2388832 · Cited by 5
Cheng, M., Storey, C. M., Altai, M., Park, J. E., Tran, J., Lueong, S. S., Thorek, D. L. J., Mao, L., Zedan, W., Yuen, C., et al. (2026) · Proceedings of the National Academy of Sciences · doi:10.1073/pnas.2500524123 · Cited by 5
Li, Y., Huang, H., Ren, Z., Yuan, Y., Wu, H., & Liu, C. (2023) · BMC Cancer · doi:10.1186/s12885-023-11235-0 · Cited by 5
Jané, P., Xu, X., Taelman, V. F., Jané, E., Gariani, K., Dumont, R. A., Garama, Y., Kim, F. H., Gomez, M., & Walter, M. A. (2023) · Nature Communications · doi:10.1038/s41467-023-43123-3 · Cited by 5
Hammanjoda, K., & Singh, A. G. (2024) · Global Social Welfare · doi:10.1007/s40609-023-00329-z · Cited by 5
CSE1L as a prognostic biomarker associated with pan cancer immune infiltration and drug sensitivity
Li, H., Wang, L., Ruan, Z., Li, X., Yang, Y., Fang, J., & Wang, R. (2024) · Expert Review of Clinical Immunology · doi:10.1080/1744666x.2024.2356747 · Cited by 5
Chen, Q., Gao, F., Wu, J., Zhang, K.-M., Du, T., Chen, Y., Cai, R., Zhao, D., Deng, R., & Tang, J. (2024) · Clinical and Translational Medicine · doi:10.1002/ctm2.1735 · Cited by 5
MHC class II genotypes are independent predictors of anti-PD1 immunotherapy response in melanoma
Claeys, A., & den Eynden, J. V. (2024) · Communications Medicine · doi:10.1038/s43856-024-00612-w · Cited by 5
Gussow, A. B., Koonin, E. V., & Auslander, N. (2021) · NAR Cancer · doi:10.1093/narcan/zcab017 · Cited by 5
Shen, N., Chen, S., Liu, D., Min, X., & Tan, Q. (2023) · The Journal of Gene Medicine · doi:10.1002/jgm.3486 · Cited by 5
Self-citationNassief, G., Butt, O. H., Zhou, A. Y., & Ansstas, G. (2024) · JAAD Case Reports · doi:10.1016/j.jdcr.2024.04.005 · Cited by 5
Metadata
- Authors
- Liu, D., Schilling, B., Liu, D., Sucker, A., Livingstone, E., Jerby-Arnon, L., Zimmer, L., Gutzmer, R., Satzger, I., Loquai, C., Grabbe, S., Vokes, N., Margolis, C. A., Conway, J., He, M. X., Elmarakeby, H., Dietlein, F., Miao, D., Tracy, A., Gogas, H., Goldinger, S. M., Utikal, J., Blank, C. U., Rauschenberg, R., von Bubnoff, D., Krackhardt, A., Weide, B., Haferkamp, S., Kiecker, F., Izar, B., Garraway, L., Regev, A., Flaherty, K., Paschen, A., Van Allen, E. M., & Schadendorf, D.
- Affiliations
- Broad Institute (US)
- German Cancer Research Center (DE)
- Medizinische Hochschule Hannover (DE)
- University Medical Center of the Johannes Gutenberg University Mainz (DE)
- National and Kapodistrian University of Athens (GR)
- University Hospital Zurich (CH)
- The Netherlands Cancer Institute (NL)
- Universitätsklinikum Tübingen (DE)
- University Hospital Regensburg (DE)
- Charité – Universitätsmedizin Berlin (DE)
- Eli Lilly (United States) (US)
- Massachusetts General Hospital (US)
- Corresponding author
- Schadendorf, Dirk
- ORCID
- Liu, David
- Schilling, Bastian
- Liu, Derek
- Sucker, Antje
- Livingstone, Elisabeth
- Zimmer, Lisa
- Gutzmer, Ralf
- Satzger, Imke
- Loquai, Carmen
- Grabbe, Stephan
- Vokes, Natalie
- Margolis, Claire A.
- Conway, Jake
- He, Meng Xiao
- Elmarakeby, Haitham
- Dietlein, Felix
- Miao, Diana
- Tracy, Adam
- Gogas, Helen
- Goldinger, Simone M.
- Utikal, Jochen
- Blank, Christian U.
- Rauschenberg, Ricarda
- Krackhardt, Angela
- Weide, Benjamin
- Haferkamp, Sebastian
- Garraway, Levi
- Regev, Aviv
- Flaherty, Keith
- Paschen, Annette
- Van Allen, Eliezer M.
- Schadendorf, Dirk
- Venue
- Nature Medicine
- Published
- 2019-12
- Volume
- 25
- Issue
- 12
- Pages
- 1916-1927
- ISSN
- 1078-8956 (ISSN-L)
- 1546-170X
- PMC
- PMC6898788
- OpenAlex
- W2991341799
- Cited by
- 1,039
- References
- 80
- Citations by year
- 2026: 118 · 2025: 156 · 2024: 203 · 2023: 210 · 2022: 157 · 2021: 129 · 2020: 64
- FWCI
- 37.04
- Type
- journal article
- Language
- en
- Update notices
- correction (2020-06-19)
- Open access
- hybrid
- doi.org
- Locations
- Nature Medicine (publishedVersion, cc-by)
- PubMed Central (publishedVersion, cc-by)
- PubMed (publishedVersion)
- DSpace@MIT (Massachusetts Institute of Technology) (submittedVersion, cc-by)
- University of Regensburg Publication Server (University of Regensburg) (submittedVersion)
- mediaTUM – the media and publications repository of the Technical University Munich (Technical University Munich) (submittedVersion, other-oa)
- mediaTUM – the media and publications repository of the Technical University Munich (Technical University Munich) (submittedVersion)
- Nature
- Funders
- National Science Foundation (1144152)
- Conquer Cancer Foundation (T32 GM008313)
- Damon Runyon Cancer Research Foundation
- Dr. Miriam and Sheldon G. Adelson Medical Research Foundation
- Deutsche Forschungsgemeinschaft (SCHA422/17-1, SCHA 422/17, PA 2376/1‐, HO 6389/2-1, KFO337, 2376/1-1, 6389/2-1, PA 2376/1‐1)
- Universität des Saarlandes
- Nationales Centrum für Tumorerkrankungen Heidelberg
- National Institutes of Health (DGE1144152)
- National Human Genome Research Institute (T32HG002295)
- National Cancer Institute (R01CA227388, K08CA222663, K08CA234458, U01CA233100)
- National Institute of General Medical Sciences (T32GM008313)
- Topics
- Health Sciences › Medicine › Oncology › Cancer Immunotherapy and Biomarkers
- Health Sciences › Medicine › Oncology › Cutaneous Melanoma Detection and Management
- Life Sciences › Immunology and Microbiology › Immunology › Immunotherapy and Immune Responses
- Keywords
- metastatic melanoma, predictive biomarkers, tumor mutational burden, MHC class I antigen presentation, MHC class II antigen presentation, immune checkpoint inhibitor resistance, transcriptomic features, clinical outcome prediction
- MeSH terms
- Exome Sequencing, Nivolumab, Female, Humans, Male, Melanoma, Mutation, Neoplasm Metastasis, Antigen Presentation, Drug Resistance, Neoplasm, Transcriptome, CTLA-4 Antigen, Programmed Cell Death 1 Receptor, Antibodies, Monoclonal, Humanized
About these checks
Registry, retraction, Cites and statistics results are computed, not judged, with one exception: a printed reference that no index lists is read once by a model before it counts as a citation error. Claims are extracted by a model and kept only when their quote appears verbatim in the text; each cited source is then checked, with a model’s help, for whether it says what the claim relies on. Those verdicts can be wrong — read the claim’s quote and the cited source before relying on one.
Statistics and arithmetic are recomputed, not judged.
Confidence bands are shown only for fields calibrated on our annotated test set. None is calibrated yet, so no band is shown.
What counts as a claim ›How we measure confidence ›How we check this ›
Are you an author, or do you see a problem with this page? Request a review
