

The DOI matches its Crossref record; 470 of the 470 references it cites were found in a registry or an index; 15 of the 20 sources its claims cite were checked for support.
Health effects associated with exposure to secondhand smoke: a Burden of Proof study
Open accessAbstract
Despite a gradual decline in smoking rates over time, exposure to secondhand smoke (SHS) continues to cause harm to nonsmokers, who are disproportionately children and women living in low- and middle-income countries. We comprehensively reviewed the literature published by July 2022 concerning the adverse impacts of SHS exposure on nine health outcomes. Following, we quantified each exposure–response association accounting for various sources of uncertainty and evaluated the strength of the evidence supporting our analyses using the Burden of Proof Risk Function methodology. We found all nine health outcomes to be associated with SHS exposure. We conservatively estimated that SHS increases the risk of ischemic heart disease, stroke, type 2 diabetes and lung cancer by at least around 8%, 5%, 1% and 1%, respectively, with the evidence supporting these harmful associations rated as weak (two stars). The evidence supporting the harmful associations between SHS and otitis media, asthma, lower respiratory infections, breast cancer and chronic obstructive pulmonary disease was weaker (one star). Despite the weak underlying evidence for these associations, our results reinforce the harmful effects of SHS on health and the need to prioritize advancing efforts to reduce active and passive smoking through a combination of public health policies and education initiatives.
Overview
AI snapshot
Written from the paper’s full text.
TL;DR
This Burden of Proof meta-analysis synthesized evidence through July 2022 on secondhand smoke (SHS) exposure and nine health outcomes, finding statistically significant associations with all nine when not accounting for between-study heterogeneity. Under conservative BPRF estimates, SHS exposure was associated with at least around 8%, 5%, 1% and 1% higher risk of ischemic heart disease, stroke, type 2 diabetes and lung cancer, respectively, with these four rated two stars and the remaining five outcomes rated one star.
Key findings
- Across 410 included publications and 623 observations from over 178 locations, all nine outcomes showed statistically significant associations with SHS exposure before accounting for between-study heterogeneity.
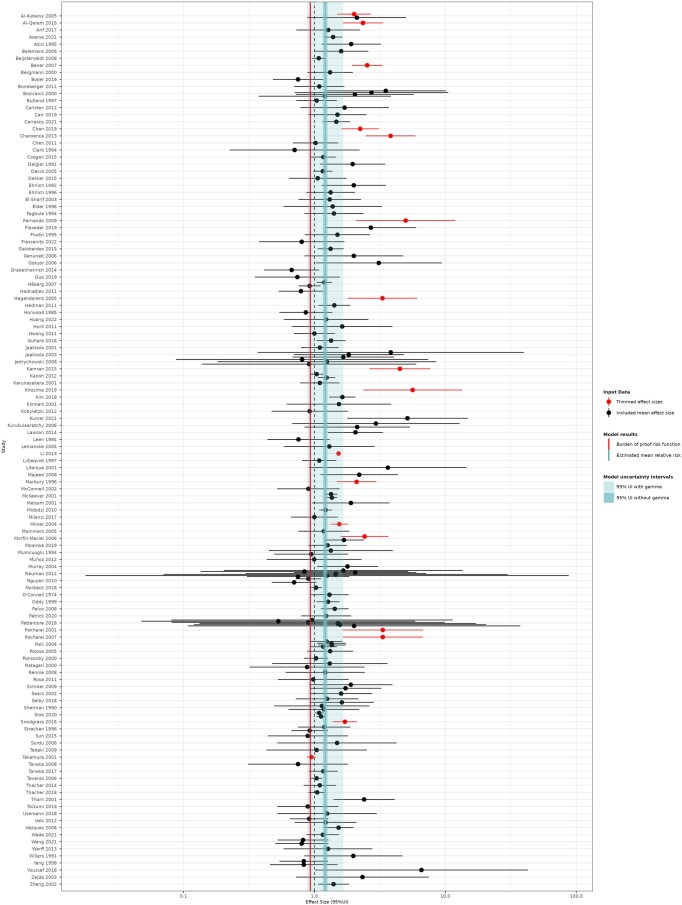
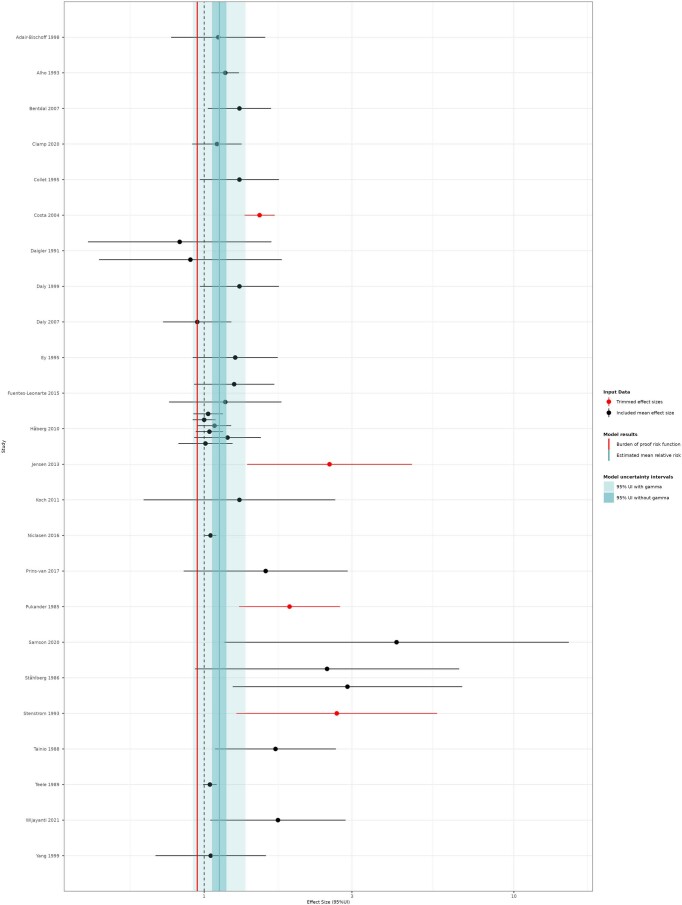
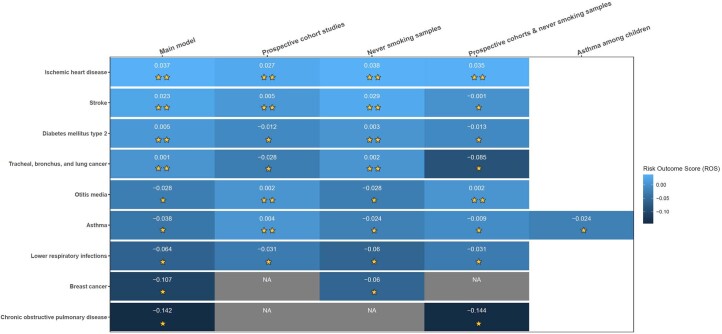
- Conservative BPRF estimates: ischemic heart disease RR 1.26 (1.05–1.52), BPRF 1.08, ROS 0.04, two stars, at least 8% higher risk; stroke RR 1.16 (1.03–1.32), BPRF 1.05, ROS 0.02, two stars, at least 5% higher risk; type 2 diabetes RR 1.16 (0.98–1.37), BPRF 1.01, ROS 0.005, two stars, at least 1% higher risk; lung cancer RR 1.37 (0.94–1.99), BPRF 1.00, ROS 0.001, two stars at the lower threshold, around 1% higher risk.
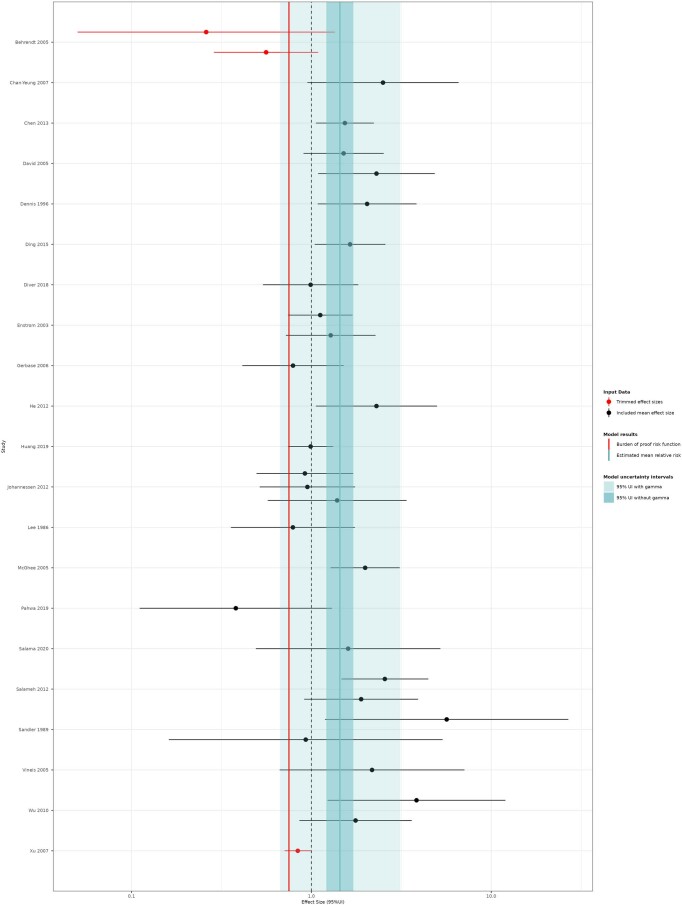
- The evidence for otitis media (BPRF 0.95, ROS −0.03), asthma (BPRF 0.93, ROS −0.04), lower respiratory infections (BPRF 0.88, ROS −0.06), breast cancer (BPRF 0.81, ROS −0.11) and COPD (BPRF 0.75, ROS −0.14) was weaker, each rated one star.
- No publication bias was detected in the primary models; publication bias was found for otitis media in one prospective-cohort sensitivity analysis.
Methods
- PRISMA systematic review in PubMed and Web of Science for studies published 1 January 1970 to 31 July 2022, plus citation searching; 7,109 unique records and 1,972 additional records were screened, yielding 410 publications. Included designs were mostly case–control (n = 235) and prospective cohort (n = 156), with smaller numbers of nested case–control, retrospective cohort, case–cohort and case-crossover studies.
- The Burden of Proof Risk Function (BPRF) framework used MR-BRT meta-regression to estimate pooled relative risks for dichotomous SHS exposure, adjust for selected bias covariates, quantify unexplained between-study heterogeneity (gamma), test publication bias with Egger’s regression, and derive BPRF, ROS and star ratings.
- Sensitivity analyses restricted models to prospective cohort studies, never-smoking samples, and both restrictions combined; asthma also had a children-only sensitivity analysis.
Limitations
- The paper states that SHS exposure was self-reported or proxy-reported, risking exposure misclassification; most surveys captured current rather than cumulative exposure, so formerly exposed individuals could be misclassified as unexposed; and dichotomous exposure may oversimplify intensity and frequency.
- The paper also states that input studies used varied exposure definitions and locations, public-setting exposure was not included, modeled RRs were not disaggregated by geography, sex or age group, and the nine outcomes do not capture the full disease burden of SHS.
- The text makes evident that several associations were sensitive to data restrictions: stroke was downgraded to one star when restricted to prospective cohorts of never smokers, lung cancer to one star in prospective cohorts, breast cancer showed no significant association in prospective cohorts without gamma, and COPD showed no significant association in prospective cohorts or never-smoking populations without gamma.
Model-written summary. Check it against the paper before relying on it.
Integrity signals
Registry
Cites
Statistics
Figures
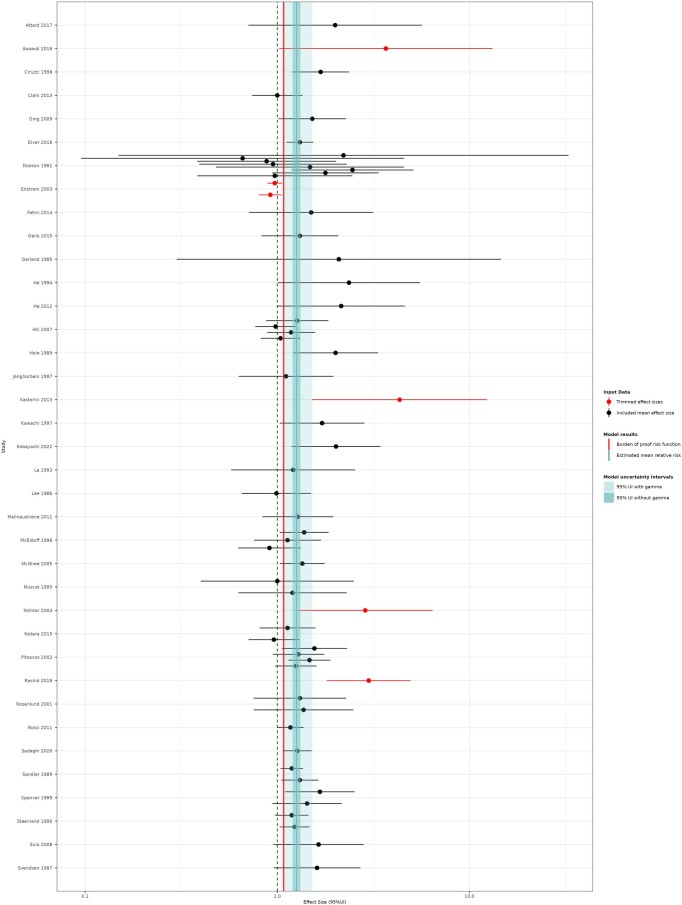
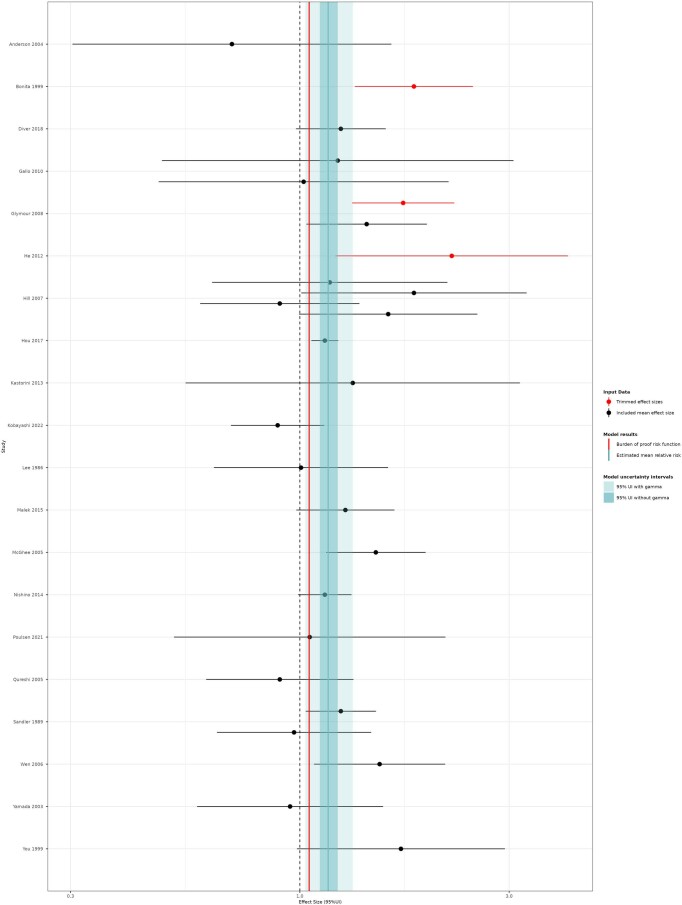
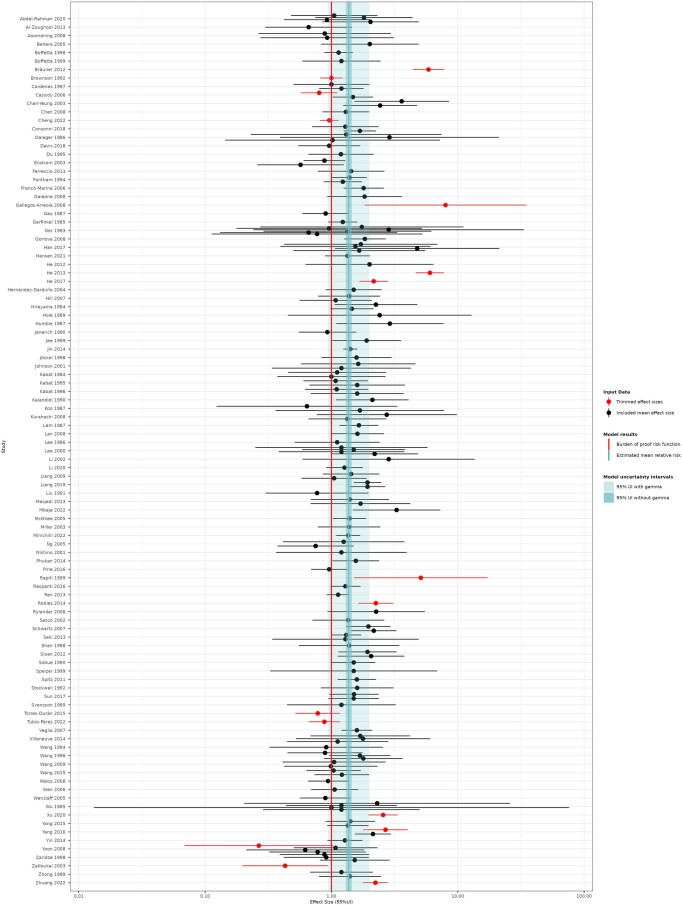
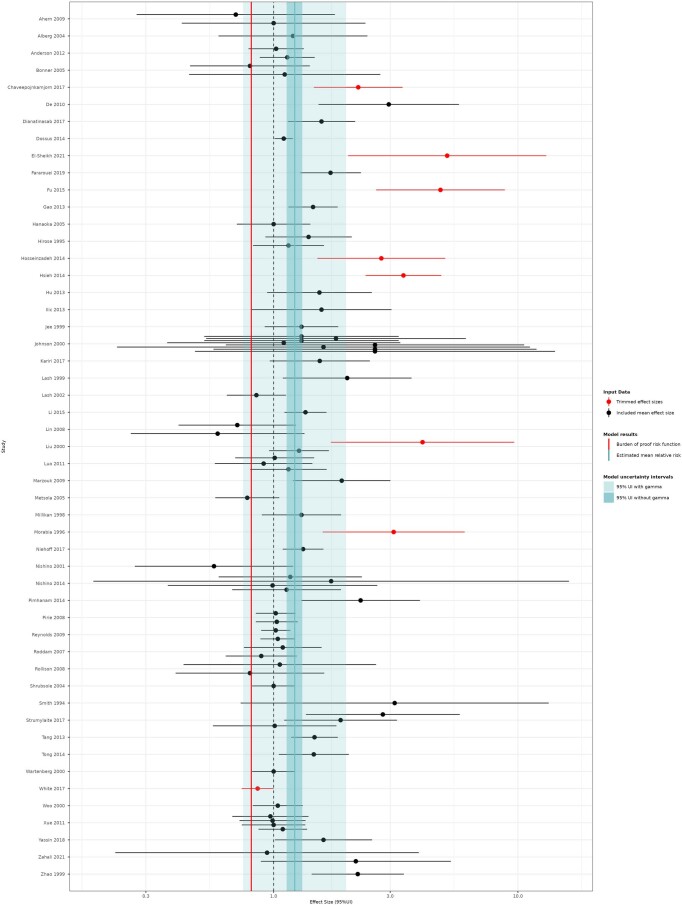
Verification
Claims the paper makes
53 Own result · 41 Own method · 9 Own interpretation · 5 No basis given · 3 Supported · 2 Supported so far · 2 Partly supported · 2 No full text of the sources · 1 Sources not found · accuracy not yet measured
The cited sources support only part of this claim — read each source’s verdict below.
In the paper
“Studies of the effects of smoke-free laws found that hospital admission and mortality rates for cardiovascular and respiratory conditions decreased after the implementation of smoking bans455–459.”
§ Health effects associated with exposure to secondhand smoke: a Burden of Proof study > Discussion
What the sources say
- Supportedcites [455] Stallings-Smith, S., Zeka, A., Goodman, P., Kabir, Z. & Clancy, L. Reductions in cardiovascular, cerebrovascular, and respiratory mortality following the National Irish Smoking Ban: interrupted time-series analysis. PLoS ONE 8, e62063 (2013). source
The Introduction reports that studies found post-ban reductions in cardiovascular mortality and in hospital admissions for cardiovascular and respiratory conditions. The Discussion reports this study’s reductions in ischemic heart disease and respiratory mortality, and cites post-ban reductions in cardiac and pulmonary admissions. The paper therefore supports the broad claim, though the admissions findings come from studies it discusses rather than its own analysis. (LLM, conf=0.92)
- Supportedcites [456] Akter, S. et al. Evaluation of population-level tobacco control interventions and health outcomes: a systematic review and meta-analysis. JAMA Netw. Open 6, e2322341 (2023). source
The Results (Meta-Analysis; page not provided) report reduced cardiovascular mortality following smoke-free legislation. The Discussion (page not provided) reports reductions in cardiovascular hospitalizations and in both mortality and hospitalizations for respiratory conditions. (LLM, conf=0.93)
- Partly supportedcites [457] Chu, M. et al. Effects of a smoke-free policy in Xi’an, China: impact on hospital admissions for acute ischemic heart disease and stroke. Front. Public Health 10, 898461 (2022). sourceExperimental — accuracy not yet measured
The Introduction reports reductions in cardiovascular mortality after some smoking bans, and the Results report reduced stroke admissions in Xi’an. But the paper’s findings are mixed for cardiovascular admissions, and its text does not report a reduction in respiratory admissions or mortality; respiratory outcomes appear only in cited reference titles. No page numbers are available in our copy. (LLM, conf=0.86)
- Partly supportedcites [458] Rando-Matos, Y. et al. Smokefree legislation effects on respiratory and sensory disorders: a systematic review and meta-analysis. PLoS ONE 12, e0181035 (2017). sourceExperimental — accuracy not yet measured
The Introduction (page not supplied) reports consistent reductions in cardiac events and hospitalizations after smoke-free legislation, while the Results report reduced respiratory admissions and respiratory mortality in some groups. The claim overstates the mortality evidence: the Introduction calls cardiovascular mortality findings conflicting, and the respiratory mortality reductions were limited to subgroups. (LLM, conf=0.90)
- Partly supportedcites [459] Gao, M. et al. The effect of smoke-free legislation on the mortality rate of acute myocardial infarction: a meta-analysis. BMC Public Health 19, 1269 (2019). sourceExperimental — accuracy not yet measured
The Conclusion (page unavailable) reports a decline in acute myocardial infarction mortality after smoke-free legislation, supporting the cardiovascular-mortality part of the claim. The paper does not report findings for hospital admissions or respiratory conditions; those outcomes appear in titles in its References (page unavailable). (LLM, conf=0.86)
plaindirect- Asserted: passes — The authors put it forward as true.
- Checkable: passes — It can be checked against evidence.
- Load-bearing: unclear — It is unclear whether the paper’s conclusions depend on it.
- Based: passes — The paper gives a reason why it holds.
- Supported
The cited sources support only part of this claim — read each source’s verdict below.
In the paper
“Moreover, private homes remain a major source of SHS exposure, particularly for women and children3,460”
§ Health effects associated with exposure to secondhand smoke: a Burden of Proof study > Discussion
What the sources say
- Partly supportedcites [3] Mbulo, L. et al. Secondhand smoke exposure at home among one billion children in 21 countries: findings from the Global Adult Tobacco Survey (GATS). Tob. Control 25, e95–e100 (2016). sourceExperimental — accuracy not yet measured
The Objective states that homes remain the major place where children may be exposed to secondhand smoke, and the Results document substantial exposure at home among children in 21 countries. The paper does not establish the corresponding claim for women. Section labels are available in our copy, but page numbers are not. (LLM, conf=0.88)
- Supportedcites [460] Huque, R. & Siddiqi, K. Smoke-free homes: the final frontier. Tob. Prev. Cessat. 7, 1–3 (2021). source
The “Level of SHS exposure at home” section states the claim directly and gives exposure estimates for women and children in their homes. (LLM, conf=0.95)
plaincorrelational- Asserted: passes — The authors put it forward as true.
- Checkable: passes — It can be checked against evidence.
- Load-bearing: unclear — It is unclear whether the paper’s conclusions depend on it.
- Based: passes — The paper gives a reason why it holds.
- Partly supported
The sources with a verdict support this claim; the rest weren’t checked yet, have no full text we could read, or their verdicts aren’t rated yet.
In the paper
“Previous studies have found different effect sizes for SHS exposure at home and at work442,443,462, a factor that was not investigated in our analysis.”
§ Health effects associated with exposure to secondhand smoke: a Burden of Proof study > Discussion
What the sources say
- Supportedcites [442] He, J. et al. Passive smoking and the risk of coronary heart disease—a meta-analysis of epidemiologic studies. N. Engl. J. Med. 340, 920–926 (1999). source
Table 4 reports separate effect-size estimates for exposure at home (1.17) and at work (1.11), supporting the part of the citing sentence attributed to this source. The paper says those estimates were not significantly different. The statement that the citing authors did not investigate this factor describes their own analysis, not this source. (LLM, conf=0.90)
- Not checked — no full text of the sourcecites [443] Lee, P. N., Forey, B. A., Hamling, J. S. & Thornton, A. J. Environmental tobacco smoke exposure and heart disease: a systematic review. World J. Meta-Anal. 5, 14–40 (2017). source
- Supportedcites [462] Du, Y. et al. Lung cancer occurrence attributable to passive smoking among never smokers in China: a systematic review and meta-analysis. Transl. Lung Cancer Res. 9, 204–217 (2020). source
The Results section (“The PAF for lung cancer due to passive smoking in women, based on exposure source”) reports different pooled effect estimates for exposure at home and at work among female never smokers: odds ratios of 1.42 and 1.58, respectively. The statement that the citing authors did not investigate this factor concerns their own analysis, not a finding attributed to this source. (LLM, conf=0.92)
plain- Asserted: passes — The authors put it forward as true.
- Checkable: passes — It can be checked against evidence.
- Load-bearing: unclear — It is unclear whether the paper’s conclusions depend on it.
- Based: passes — The paper gives a reason why it holds.
- Supported
Every source the paper cites for this claim was checked and supports it.
In the paper
“The validity of the BPRF approach to meta-analyze data extracted across studies has been extensively and rigorously evaluated by Zheng and colleagues430.”
§ Health effects associated with exposure to secondhand smoke: a Burden of Proof study > Methods > Model validation
What the sources say
- Supportedcites [430] Zheng, P. et al. The Burden of Proof studies: assessing the evidence of risk. Nat. Med. 28, 2038–2044 (2022). source
The Methods section (‘Model validation’; page not specified) describes 1,800 simulations testing the accuracy of the meta-analytic approach, including BPRF estimation. The Results section reports that the approach outperformed existing methods, particularly for non-log-linear relationships. (LLM, conf=0.93)
boosted- Asserted: passes — The authors put it forward as true.
- Checkable: passes — It can be checked against evidence.
- Load-bearing: unclear — It is unclear whether the paper’s conclusions depend on it.
- Based: passes — The paper gives a reason why it holds.
- Supported
A result the paper reports from its own data — it cites no other source for it, so there is none to check. The quote shows it is in the paper.
In the paper
“The BPRF and ROS were 0.93 and −0.04”
§ Health effects associated with exposure to secondhand smoke: a Burden of Proof study > Results > Respiratory conditions
plain- Asserted: passes — The authors put it forward as true.
- Checkable: passes — It can be checked against evidence.
- Load-bearing: unclear — It is unclear whether the paper’s conclusions depend on it.
- Based: passes — The paper gives a reason why it holds.
A result the paper reports from its own data — it cites no other source for it, so there is none to check. The quote shows it is in the paper.
In the paper
“The evidence supporting the harmful associations between SHS and otitis media, asthma, lower respiratory infections, breast cancer and chronic obstructive pulmonary disease was weaker (one star).”
- Also stated in: § Other health outcomes · plain
“which equates to a ROS of −0.03 and a one-star rating (weak evidence of association)”
- Also stated in: § Discussion · plain
“these risk–outcome pairs were classified as one-star associations”
§ Health effects associated with exposure to secondhand smoke: a Burden of Proof study > Abstract
plaincorrelational- Asserted: passes — The authors put it forward as true.
- Checkable: passes — It can be checked against evidence.
- Load-bearing: passes — The paper’s conclusions depend on it.
- Based: passes — The paper gives a reason why it holds.
- Also stated in: § Other health outcomes · plain
A result the paper reports from its own data — it cites no other source for it, so there is none to check. The quote shows it is in the paper.
In the paper
“with the evidence supporting these harmful associations rated as weak (two stars)”
- Also stated in: § Other health outcomes · plain
“translating to a two-star risk”
- Also stated in: § Discussion · plain
“corresponding to two-star associations with SHS”
§ Health effects associated with exposure to secondhand smoke: a Burden of Proof study > Abstract
plaincorrelational- Asserted: passes — The authors put it forward as true.
- Checkable: passes — It can be checked against evidence.
- Load-bearing: passes — The paper’s conclusions depend on it.
- Based: passes — The paper gives a reason why it holds.
- Also stated in: § Other health outcomes · plain
A result the paper reports from its own data — it cites no other source for it, so there is none to check. The quote shows it is in the paper.
In the paper
“We conservatively estimated that SHS increases the risk of ischemic heart disease, stroke, type 2 diabetes and lung cancer by at least around 8%, 5%, 1% and 1%, respectively”
- Also stated in: § Cardiovascular diseases · hedged
“indicating that exposure to tobacco smoke was associated with at least a 5% higher risk of stroke”
- Also stated in: § Discussion · plain
“being exposed to SHS increased the risk of IHD, stroke and type 2 diabetes by a minimum of 8%, 5% and 1%, respectively”
§ Health effects associated with exposure to secondhand smoke: a Burden of Proof study > Abstract
plaindirect- Asserted: passes — The authors put it forward as true.
- Checkable: passes — It can be checked against evidence.
- Load-bearing: passes — The paper’s conclusions depend on it.
- Based: passes — The paper gives a reason why it holds.
- Also stated in: § Cardiovascular diseases · hedged
A result the paper reports from its own data — it cites no other source for it, so there is none to check. The quote shows it is in the paper.
In the paper
“the estimated RR incorporating between-study heterogeneity into the uncertainty was 1.21 (0.88–1.66)”
§ Health effects associated with exposure to secondhand smoke: a Burden of Proof study > Results > Respiratory conditions
hedgedcorrelational- Asserted: passes — The authors put it forward as true.
- Checkable: passes — It can be checked against evidence.
- Load-bearing: passes — The paper’s conclusions depend on it.
- Based: passes — The paper gives a reason why it holds.
A result the paper reports from its own data — it cites no other source for it, so there is none to check. The quote shows it is in the paper.
In the paper
“The evidence supporting the harmful associations between SHS and otitis media, asthma, lower respiratory infections, breast cancer and chronic obstructive pulmonary disease was weaker (one star).”
- Also stated in: § Cancer · plain
“one-star rating”
- Also stated in: § Discussion · plain
“these risk–outcome pairs were classified as one-star associations”
§ Health effects associated with exposure to secondhand smoke: a Burden of Proof study > Abstract
plaincorrelational- Asserted: passes — The authors put it forward as true.
- Checkable: passes — It can be checked against evidence.
- Load-bearing: passes — The paper’s conclusions depend on it.
- Based: passes — The paper gives a reason why it holds.
- Also stated in: § Cancer · plain
A result the paper reports from its own data — it cites no other source for it, so there is none to check. The quote shows it is in the paper.
In the paper
“The evidence supporting the harmful associations between SHS and otitis media, asthma, lower respiratory infections, breast cancer and chronic obstructive pulmonary disease was weaker (one star).”
- Also stated in: § Respiratory conditions · plain
“translated into a one-star rating, consistent with weak evidence”
- Also stated in: § Discussion · plain
“these risk–outcome pairs were classified as one-star associations”
§ Health effects associated with exposure to secondhand smoke: a Burden of Proof study > Abstract
plaincorrelational- Asserted: passes — The authors put it forward as true.
- Checkable: passes — It can be checked against evidence.
- Load-bearing: passes — The paper’s conclusions depend on it.
- Based: passes — The paper gives a reason why it holds.
- Also stated in: § Respiratory conditions · plain
The paper states this without a source or data behind it here, so there is nothing to check it against. The quote shows it is in the paper.
In the paper
“this translates to a risk–outcome score (ROS) of 0.04”
§ Health effects associated with exposure to secondhand smoke: a Burden of Proof study > Results > Cardiovascular diseases
plain- Asserted: passes — The authors put it forward as true.
- Checkable: passes — It can be checked against evidence.
- Load-bearing: unclear — It is unclear whether the paper’s conclusions depend on it.
- Based: passes — The paper gives a reason why it holds.
A result the paper reports from its own data — it cites no other source for it, so there is none to check. The quote shows it is in the paper.
In the paper
“corresponding ROS (−0.06)”
§ Health effects associated with exposure to secondhand smoke: a Burden of Proof study > Results > Respiratory conditions
plain- Asserted: passes — The authors put it forward as true.
- Checkable: passes — It can be checked against evidence.
- Load-bearing: passes — The paper’s conclusions depend on it.
- Based: passes — The paper gives a reason why it holds.
A result the paper reports from its own data — it cites no other source for it, so there is none to check. The quote shows it is in the paper.
In the paper
“the RR was 1.44 (0.67–3.12)”
§ Health effects associated with exposure to secondhand smoke: a Burden of Proof study > Results > Respiratory conditions
plaincorrelational- Asserted: passes — The authors put it forward as true.
- Checkable: passes — It can be checked against evidence.
- Load-bearing: passes — The paper’s conclusions depend on it.
- Based: passes — The paper gives a reason why it holds.
A result the paper reports from its own data — it cites no other source for it, so there is none to check. The quote shows it is in the paper.
In the paper
“a corresponding ROS of 0.005”
§ Health effects associated with exposure to secondhand smoke: a Burden of Proof study > Results > Other health outcomes
plain- Asserted: passes — The authors put it forward as true.
- Checkable: passes — It can be checked against evidence.
- Load-bearing: unclear — It is unclear whether the paper’s conclusions depend on it.
- Based: passes — The paper gives a reason why it holds.
A result the paper reports from its own data — it cites no other source for it, so there is none to check. The quote shows it is in the paper.
In the paper
“The one-star association was observed, however, in a sensitivity analysis in which we applied both data restrictions simultaneously”
§ Health effects associated with exposure to secondhand smoke: a Burden of Proof study > Results > Respiratory conditions
plaincorrelational- Asserted: passes — The authors put it forward as true.
- Checkable: passes — It can be checked against evidence.
- Load-bearing: unclear — It is unclear whether the paper’s conclusions depend on it.
- Based: passes — The paper gives a reason why it holds.
A result the paper reports from its own data — it cites no other source for it, so there is none to check. The quote shows it is in the paper.
In the paper
“The corresponding BPRF was 0.95”
§ Health effects associated with exposure to secondhand smoke: a Burden of Proof study > Results > Other health outcomes
plain- Asserted: passes — The authors put it forward as true.
- Checkable: passes — It can be checked against evidence.
- Load-bearing: unclear — It is unclear whether the paper’s conclusions depend on it.
- Based: passes — The paper gives a reason why it holds.
A result the paper reports from its own data — it cites no other source for it, so there is none to check. The quote shows it is in the paper.
In the paper
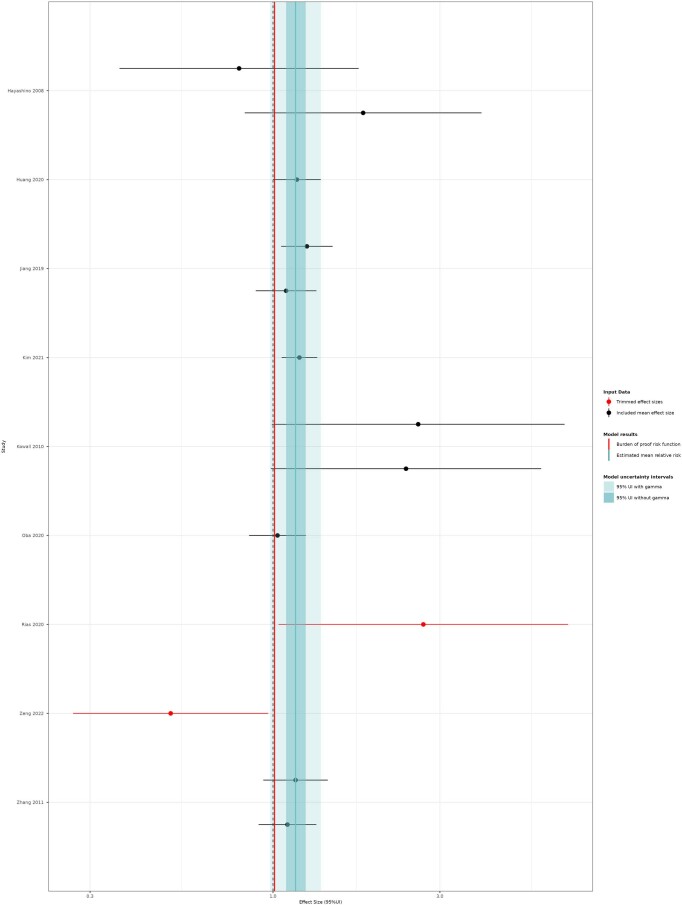
“with an RR of 1.16 (0.98–1.37) when accounting for between-study heterogeneity”
§ Health effects associated with exposure to secondhand smoke: a Burden of Proof study > Results > Other health outcomes
plaincorrelational- Asserted: passes — The authors put it forward as true.
- Checkable: passes — It can be checked against evidence.
- Load-bearing: passes — The paper’s conclusions depend on it.
- Based: passes — The paper gives a reason why it holds.
A result the paper reports from its own data — it cites no other source for it, so there is none to check. The quote shows it is in the paper.
In the paper
“When restricted to prospective cohort data for never smokers only, the association between SHS and stroke was downgraded to one star (ROS −0.001)”
§ Health effects associated with exposure to secondhand smoke: a Burden of Proof study > Results > Cardiovascular diseases
plaincorrelational- Asserted: passes — The authors put it forward as true.
- Checkable: passes — It can be checked against evidence.
- Load-bearing: passes — The paper’s conclusions depend on it.
- Based: passes — The paper gives a reason why it holds.
A result the paper reports from its own data — it cites no other source for it, so there is none to check. The quote shows it is in the paper.
In the paper
“We conservatively estimated that SHS increases the risk of ischemic heart disease, stroke, type 2 diabetes and lung cancer by at least around 8%, 5%, 1% and 1%, respectively”
- Also stated in: § Cancer · hedged
“suggests that SHS exposure was associated with at least around 1% higher risk of lung cancer”
- Also stated in: § Discussion · plain
“SHS was found to increase the risk by a minimum of around 1%”
§ Health effects associated with exposure to secondhand smoke: a Burden of Proof study > Abstract
plaindirect- Asserted: passes — The authors put it forward as true.
- Checkable: passes — It can be checked against evidence.
- Load-bearing: passes — The paper’s conclusions depend on it.
- Based: passes — The paper gives a reason why it holds.
- Also stated in: § Cancer · hedged
A result the paper reports from its own data — it cites no other source for it, so there is none to check. The quote shows it is in the paper.
In the paper
“We conservatively estimated that SHS increases the risk of ischemic heart disease, stroke, type 2 diabetes and lung cancer by at least around 8%, 5%, 1% and 1%, respectively”
- Also stated in: § Cardiovascular diseases · hedged
“suggesting that SHS exposure increases an individual’s risk of IHD by a conservative minimum of 8%”
- Also stated in: § Discussion · plain
“being exposed to SHS increased the risk of IHD, stroke and type 2 diabetes by a minimum of 8%, 5% and 1%, respectively”
§ Health effects associated with exposure to secondhand smoke: a Burden of Proof study > Abstract
plaindirect- Asserted: passes — The authors put it forward as true.
- Checkable: passes — It can be checked against evidence.
- Load-bearing: passes — The paper’s conclusions depend on it.
- Based: passes — The paper gives a reason why it holds.
- Also stated in: § Cardiovascular diseases · hedged
A result the paper reports from its own data — it cites no other source for it, so there is none to check. The quote shows it is in the paper.
In the paper
“yielded an RR of 1.12 (0.92–1.36) when accounting for between-study heterogeneity”
§ Health effects associated with exposure to secondhand smoke: a Burden of Proof study > Results > Other health outcomes
plaincorrelational- Asserted: passes — The authors put it forward as true.
- Checkable: passes — It can be checked against evidence.
- Load-bearing: unclear — It is unclear whether the paper’s conclusions depend on it.
- Based: passes — The paper gives a reason why it holds.
A result the paper reports from its own data — it cites no other source for it, so there is none to check. The quote shows it is in the paper.
In the paper
“The evidence supporting the harmful associations between SHS and otitis media, asthma, lower respiratory infections, breast cancer and chronic obstructive pulmonary disease was weaker (one star).”
- Also stated in: § Respiratory conditions · hedged
“equating to a one-star rating, indicating weak evidence”
- Also stated in: § Discussion · plain
“these risk–outcome pairs were classified as one-star associations”
§ Health effects associated with exposure to secondhand smoke: a Burden of Proof study > Abstract
plaincorrelational- Asserted: passes — The authors put it forward as true.
- Checkable: passes — It can be checked against evidence.
- Load-bearing: passes — The paper’s conclusions depend on it.
- Based: passes — The paper gives a reason why it holds.
- Also stated in: § Respiratory conditions · hedged
A result the paper reports from its own data — it cites no other source for it, so there is none to check. The quote shows it is in the paper.
In the paper
“with the evidence supporting these harmful associations rated as weak (two stars)”
- Also stated in: § Cardiovascular diseases · plain
“This corresponds to a ROS of 0.02 and a two-star rating, consistent with weak evidence.”
- Also stated in: § Discussion · plain
“corresponding to two-star associations with SHS”
§ Health effects associated with exposure to secondhand smoke: a Burden of Proof study > Abstract
plaincorrelational- Asserted: passes — The authors put it forward as true.
- Checkable: passes — It can be checked against evidence.
- Load-bearing: passes — The paper’s conclusions depend on it.
- Based: passes — The paper gives a reason why it holds.
- Also stated in: § Cardiovascular diseases · plain
A result the paper reports from its own data — it cites no other source for it, so there is none to check. The quote shows it is in the paper.
In the paper
“a corresponding ROS of 0.001”
§ Health effects associated with exposure to secondhand smoke: a Burden of Proof study > Results > Cancer
plain- Asserted: passes — The authors put it forward as true.
- Checkable: passes — It can be checked against evidence.
- Load-bearing: passes — The paper’s conclusions depend on it.
- Based: passes — The paper gives a reason why it holds.
A result the paper reports from its own data — it cites no other source for it, so there is none to check. The quote shows it is in the paper.
In the paper
“with the evidence supporting these harmful associations rated as weak (two stars)”
- Also stated in: § Cancer · plain
“which translates to a two-star rating at the lower threshold of the two-star range”
- Also stated in: § Discussion · plain
“The two-star rating was also found for the relationship with lung cancer”
§ Health effects associated with exposure to secondhand smoke: a Burden of Proof study > Abstract
plaincorrelational- Asserted: passes — The authors put it forward as true.
- Checkable: passes — It can be checked against evidence.
- Load-bearing: passes — The paper’s conclusions depend on it.
- Based: passes — The paper gives a reason why it holds.
- Also stated in: § Cancer · plain
A result the paper reports from its own data — it cites no other source for it, so there is none to check. The quote shows it is in the paper.
In the paper
“based on a BPRF of 1.00”
§ Health effects associated with exposure to secondhand smoke: a Burden of Proof study > Results > Cancer
plain- Asserted: passes — The authors put it forward as true.
- Checkable: passes — It can be checked against evidence.
- Load-bearing: passes — The paper’s conclusions depend on it.
- Based: passes — The paper gives a reason why it holds.
A result the paper reports from its own data — it cites no other source for it, so there is none to check. The quote shows it is in the paper.
In the paper
“The BPRF value was 1.01”
§ Health effects associated with exposure to secondhand smoke: a Burden of Proof study > Results > Other health outcomes
plain- Asserted: passes — The authors put it forward as true.
- Checkable: passes — It can be checked against evidence.
- Load-bearing: unclear — It is unclear whether the paper’s conclusions depend on it.
- Based: passes — The paper gives a reason why it holds.
A result the paper reports from its own data — it cites no other source for it, so there is none to check. The quote shows it is in the paper.
In the paper
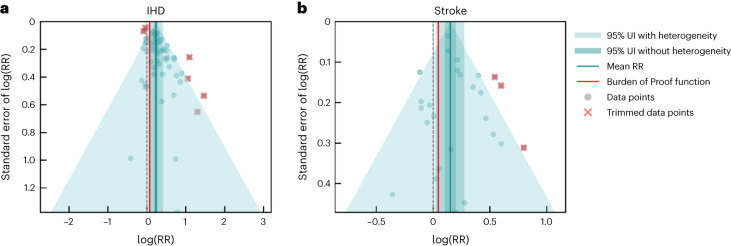
“Our conservative analysis of the effect of SHS on IHD yielded an estimated RR of 1.26 (1.05–1.52) (Table 2, Fig. 1a and Extended Data Fig. 1), inclusive of between-study heterogeneity (gamma).”
§ Health effects associated with exposure to secondhand smoke: a Burden of Proof study > Results > Cardiovascular diseases
hedgedcorrelational- Asserted: passes — The authors put it forward as true.
- Checkable: passes — It can be checked against evidence.
- Load-bearing: passes — The paper’s conclusions depend on it.
- Based: passes — The paper gives a reason why it holds.
A result the paper reports from its own data — it cites no other source for it, so there is none to check. The quote shows it is in the paper.
In the paper
“The evidence supporting the harmful associations between SHS and otitis media, asthma, lower respiratory infections, breast cancer and chronic obstructive pulmonary disease was weaker (one star).”
- Also stated in: § Respiratory conditions · plain
“which equates to a one-star risk classification”
- Also stated in: § Discussion · plain
“these risk–outcome pairs were classified as one-star associations”
§ Health effects associated with exposure to secondhand smoke: a Burden of Proof study > Abstract
plaincorrelational- Asserted: passes — The authors put it forward as true.
- Checkable: passes — It can be checked against evidence.
- Load-bearing: passes — The paper’s conclusions depend on it.
- Based: passes — The paper gives a reason why it holds.
- Also stated in: § Respiratory conditions · plain
A result the paper reports from its own data — it cites no other source for it, so there is none to check. The quote shows it is in the paper.
In the paper
“The BPRF and ROS were 0.93 and −0.04”
§ Health effects associated with exposure to secondhand smoke: a Burden of Proof study > Results > Respiratory conditions
plain- Asserted: passes — The authors put it forward as true.
- Checkable: passes — It can be checked against evidence.
- Load-bearing: unclear — It is unclear whether the paper’s conclusions depend on it.
- Based: passes — The paper gives a reason why it holds.
A result the paper reports from its own data — it cites no other source for it, so there is none to check. The quote shows it is in the paper.
In the paper
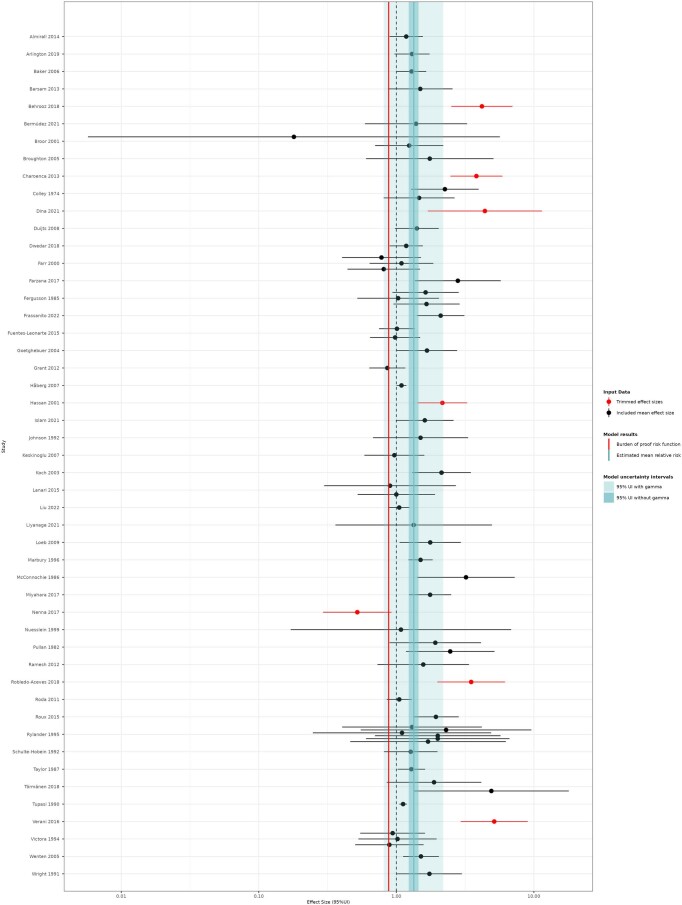
“The estimated RR and uncertainty inclusive of between-study heterogeneity was 1.16 (1.03–1.32)”
§ Health effects associated with exposure to secondhand smoke: a Burden of Proof study > Results > Cardiovascular diseases
hedgedcorrelational- Asserted: passes — The authors put it forward as true.
- Checkable: passes — It can be checked against evidence.
- Load-bearing: passes — The paper’s conclusions depend on it.
- Based: passes — The paper gives a reason why it holds.
A result the paper reports from its own data — it cites no other source for it, so there is none to check. The quote shows it is in the paper.
In the paper
“yielded an RR of 1.22 (0.75–1.98), inclusive of between-study heterogeneity”
§ Health effects associated with exposure to secondhand smoke: a Burden of Proof study > Results > Cancer
plaincorrelational- Asserted: passes — The authors put it forward as true.
- Checkable: passes — It can be checked against evidence.
- Load-bearing: passes — The paper’s conclusions depend on it.
- Based: passes — The paper gives a reason why it holds.
A result the paper reports from its own data — it cites no other source for it, so there is none to check. The quote shows it is in the paper.
In the paper
“We conservatively estimated that SHS increases the risk of ischemic heart disease, stroke, type 2 diabetes and lung cancer by at least around 8%, 5%, 1% and 1%, respectively”
- Also stated in: § Other health outcomes · hedged
“suggests that passive smoking is associated with at least a 1% higher risk of type 2 diabetes”
- Also stated in: § Discussion · plain
“being exposed to SHS increased the risk of IHD, stroke and type 2 diabetes by a minimum of 8%, 5% and 1%, respectively”
§ Health effects associated with exposure to secondhand smoke: a Burden of Proof study > Abstract
plaindirect- Asserted: passes — The authors put it forward as true.
- Checkable: passes — It can be checked against evidence.
- Load-bearing: passes — The paper’s conclusions depend on it.
- Based: passes — The paper gives a reason why it holds.
- Also stated in: § Other health outcomes · hedged
A result the paper reports from its own data — it cites no other source for it, so there is none to check. The quote shows it is in the paper.
In the paper
“In a sensitivity analysis in which we restricted the data to prospective cohort studies, the strength of the association was even lower (BPRF 0.95, ROS −0.03), downgrading the relationship to a one-star rating”
§ Health effects associated with exposure to secondhand smoke: a Burden of Proof study > Results > Cancer
plaincorrelational- Asserted: passes — The authors put it forward as true.
- Checkable: passes — It can be checked against evidence.
- Load-bearing: unclear — It is unclear whether the paper’s conclusions depend on it.
- Based: passes — The paper gives a reason why it holds.
A result the paper reports from its own data — it cites no other source for it, so there is none to check. The quote shows it is in the paper.
In the paper
“When including observations from seven prospective cohorts only, we found no statistically significant evidence of an association between SHS exposure and COPD when not including between-study heterogeneity (RR 1.21 (0.93–1.57, without gamma)).”
§ Health effects associated with exposure to secondhand smoke: a Burden of Proof study > Results > Respiratory conditions
plain- Asserted: passes — The authors put it forward as true.
- Checkable: passes — It can be checked against evidence.
- Load-bearing: unclear — It is unclear whether the paper’s conclusions depend on it.
- Based: passes — The paper gives a reason why it holds.
A result the paper reports from its own data — it cites no other source for it, so there is none to check. The quote shows it is in the paper.
In the paper
“We found all nine health outcomes to be associated with SHS exposure.”
- Also stated in: § Discussion · hedged
“we found evidence that passive smoking is associated with statistically significant increases in the risk of all nine health outcomes.”
- Also stated in: § Main · plain
“We found statistically significant associations between SHS and all nine outcomes examined”
§ Health effects associated with exposure to secondhand smoke: a Burden of Proof study > Abstract
plaincorrelational- Asserted: passes — The authors put it forward as true.
- Checkable: passes — It can be checked against evidence.
- Load-bearing: passes — The paper’s conclusions depend on it.
- Based: passes — The paper gives a reason why it holds.
- Also stated in: § Discussion · hedged
A result the paper reports from its own data — it cites no other source for it, so there is none to check. The quote shows it is in the paper.
In the paper
“COPD | 1.44 (1.21–1.71) | 1.44 (0.67–3.12) | 0.75 | −0.14”
§ Health effects associated with exposure to secondhand smoke: a Burden of Proof study > Results > Overview
plain- Asserted: passes — The authors put it forward as true.
- Checkable: passes — It can be checked against evidence.
- Load-bearing: unclear — It is unclear whether the paper’s conclusions depend on it.
- Based: passes — The paper gives a reason why it holds.
The paper states this without a source or data behind it here, so there is nothing to check it against. The quote shows it is in the paper.
In the paper
“we estimated a BPRF of 1.05”
§ Health effects associated with exposure to secondhand smoke: a Burden of Proof study > Results > Cardiovascular diseases
hedgedcorrelational- Asserted: passes — The authors put it forward as true.
- Checkable: passes — It can be checked against evidence.
- Load-bearing: passes — The paper’s conclusions depend on it.
- Based: passes — The paper gives a reason why it holds.
A result the paper reports from its own data — it cites no other source for it, so there is none to check. The quote shows it is in the paper.
In the paper
“ROS −0.11”
§ Health effects associated with exposure to secondhand smoke: a Burden of Proof study > Results > Cancer
plain- Asserted: passes — The authors put it forward as true.
- Checkable: passes — It can be checked against evidence.
- Load-bearing: passes — The paper’s conclusions depend on it.
- Based: passes — The paper gives a reason why it holds.
A result the paper reports from its own data — it cites no other source for it, so there is none to check. The quote shows it is in the paper.
In the paper
“yielded an RR and uncertainty interval inclusive of between-study heterogeneity of 1.34 (0.81–2.19)”
§ Health effects associated with exposure to secondhand smoke: a Burden of Proof study > Results > Respiratory conditions
plaincorrelational- Asserted: passes — The authors put it forward as true.
- Checkable: passes — It can be checked against evidence.
- Load-bearing: passes — The paper’s conclusions depend on it.
- Based: passes — The paper gives a reason why it holds.
A result the paper reports from its own data — it cites no other source for it, so there is none to check. The quote shows it is in the paper.
In the paper
“BPRF 0.81”
§ Health effects associated with exposure to secondhand smoke: a Burden of Proof study > Results > Cancer
plain- Asserted: passes — The authors put it forward as true.
- Checkable: passes — It can be checked against evidence.
- Load-bearing: passes — The paper’s conclusions depend on it.
- Based: passes — The paper gives a reason why it holds.
A result the paper reports from its own data — it cites no other source for it, so there is none to check. The quote shows it is in the paper.
In the paper
“We estimated the BPRF—which corresponds to the fifth quantile of RR closest to null and represents the lowest estimate of harmful SHS risk consistent with available evidence—to be 1.08”
§ Health effects associated with exposure to secondhand smoke: a Burden of Proof study > Results > Cardiovascular diseases
hedged- Asserted: passes — The authors put it forward as true.
- Checkable: passes — It can be checked against evidence.
- Load-bearing: passes — The paper’s conclusions depend on it.
- Based: passes — The paper gives a reason why it holds.
A result the paper reports from its own data — it cites no other source for it, so there is none to check. The quote shows it is in the paper.
In the paper
“with the evidence supporting these harmful associations rated as weak (two stars)”
- Also stated in: § Cardiovascular diseases · plain
“which distinguishes the SHS–IHD relationship as a two-star risk–outcome pair, which can be interpreted as weak evidence”
- Also stated in: § Discussion · plain
“corresponding to two-star associations with SHS”
§ Health effects associated with exposure to secondhand smoke: a Burden of Proof study > Abstract
plaincorrelational- Asserted: passes — The authors put it forward as true.
- Checkable: passes — It can be checked against evidence.
- Load-bearing: passes — The paper’s conclusions depend on it.
- Based: passes — The paper gives a reason why it holds.
- Also stated in: § Cardiovascular diseases · plain
A result the paper reports from its own data — it cites no other source for it, so there is none to check. The quote shows it is in the paper.
In the paper
“This was similar to the result we found when subsetting the data to never-smoking populations (RR 1.15 (0.95–1.40, without gamma)).”
§ Health effects associated with exposure to secondhand smoke: a Burden of Proof study > Results > Respiratory conditions
plain- Asserted: passes — The authors put it forward as true.
- Checkable: passes — It can be checked against evidence.
- Load-bearing: unclear — It is unclear whether the paper’s conclusions depend on it.
- Based: passes — The paper gives a reason why it holds.
A result the paper reports from its own data — it cites no other source for it, so there is none to check. The quote shows it is in the paper.
In the paper
“the estimated RR was 1.37 (0.94–1.99)”
§ Health effects associated with exposure to secondhand smoke: a Burden of Proof study > Results > Cancer
hedgedcorrelational- Asserted: passes — The authors put it forward as true.
- Checkable: passes — It can be checked against evidence.
- Load-bearing: passes — The paper’s conclusions depend on it.
- Based: passes — The paper gives a reason why it holds.
The paper states this without a source or data behind it here, so there is nothing to check it against. The quote shows it is in the paper.
In the paper
“This corresponds to a ROS of 0.02”
§ Health effects associated with exposure to secondhand smoke: a Burden of Proof study > Results > Cardiovascular diseases
plaincorrelational- Asserted: passes — The authors put it forward as true.
- Checkable: passes — It can be checked against evidence.
- Load-bearing: unclear — It is unclear whether the paper’s conclusions depend on it.
- Based: passes — The paper gives a reason why it holds.
A result the paper reports from its own data — it cites no other source for it, so there is none to check. The quote shows it is in the paper.
In the paper
“The BPRF (0.88) and corresponding ROS (−0.06)”
§ Health effects associated with exposure to secondhand smoke: a Burden of Proof study > Results > Respiratory conditions
plain- Asserted: passes — The authors put it forward as true.
- Checkable: passes — It can be checked against evidence.
- Load-bearing: passes — The paper’s conclusions depend on it.
- Based: passes — The paper gives a reason why it holds.
A result the paper reports from its own data — it cites no other source for it, so there is none to check. The quote shows it is in the paper.
In the paper
“However, when restricting to prospective cohort studies, we found no statistically significant evidence of an association between exposure to SHS and the risk of breast cancer in our fixed-effect model without between-study heterogeneity; that is, the estimated RR and associated uncertainty without gamma includes the null.”
§ Health effects associated with exposure to secondhand smoke: a Burden of Proof study > Results > Cancer
plain- Asserted: passes — The authors put it forward as true.
- Checkable: passes — It can be checked against evidence.
- Load-bearing: passes — The paper’s conclusions depend on it.
- Based: passes — The paper gives a reason why it holds.
A result the paper reports from its own data — it cites no other source for it, so there is none to check. The quote shows it is in the paper.
In the paper
“When restricting to prospective cohort studies, a two-star rating for the relationship between SHS and asthma was observed”
§ Health effects associated with exposure to secondhand smoke: a Burden of Proof study > Results > Respiratory conditions
plaincorrelational- Asserted: passes — The authors put it forward as true.
- Checkable: passes — It can be checked against evidence.
- Load-bearing: unclear — It is unclear whether the paper’s conclusions depend on it.
- Based: passes — The paper gives a reason why it holds.
A result the paper reports from its own data — it cites no other source for it, so there is none to check. The quote shows it is in the paper.
In the paper
“Restricting the data to prospective cohort studies resulted in a downgrade in star rating to a one-star risk”
§ Health effects associated with exposure to secondhand smoke: a Burden of Proof study > Results > Other health outcomes
plaindirect- Asserted: passes — The authors put it forward as true.
- Checkable: passes — It can be checked against evidence.
- Load-bearing: unclear — It is unclear whether the paper’s conclusions depend on it.
- Based: passes — The paper gives a reason why it holds.
A result the paper reports from its own data — it cites no other source for it, so there is none to check. The quote shows it is in the paper.
In the paper
“Although we found evidence suggesting an association between SHS exposure and these other investigated health outcomes, the associations did not achieve statistical significance when using the BPRF approach to capture uncertainty that accounts for between-study heterogeneity.”
§ Health effects associated with exposure to secondhand smoke: a Burden of Proof study > Discussion
hedged- Asserted: passes — The authors put it forward as true.
- Checkable: passes — It can be checked against evidence.
- Load-bearing: passes — The paper’s conclusions depend on it.
- Based: passes — The paper gives a reason why it holds.
A result the paper reports from its own data — it cites no other source for it, so there is none to check. The quote shows it is in the paper.
In the paper
“We found publication bias for otitis media in one of our sensitivity analyses.”
§ Health effects associated with exposure to secondhand smoke: a Burden of Proof study > Methods > Evaluating publication and reporting bias
plain- Asserted: passes — The authors put it forward as true.
- Checkable: passes — It can be checked against evidence.
- Load-bearing: unclear — It is unclear whether the paper’s conclusions depend on it.
- Based: passes — The paper gives a reason why it holds.
A result the paper reports from its own data — it cites no other source for it, so there is none to check. The quote shows it is in the paper.
In the paper
“We did not find evidence of publication or reporting bias across any of the risk–outcome pairs in our primary models.”
§ Health effects associated with exposure to secondhand smoke: a Burden of Proof study > Methods > Evaluating publication and reporting bias
plain- Asserted: passes — The authors put it forward as true.
- Checkable: passes — It can be checked against evidence.
- Load-bearing: unclear — It is unclear whether the paper’s conclusions depend on it.
- Based: passes — The paper gives a reason why it holds.
The paper states this without a source or data behind it here, so there is nothing to check it against. The quote shows it is in the paper.
In the paper
“The modest strength of the association coupled with heterogeneity present in the underlying data across all nine risk–outcome pairs analyzed resulted in a body of evidence rated as weak under the proposed BPRF rating system (one and two stars), despite the relatively large number of studies included for some of the outcomes.”
§ Health effects associated with exposure to secondhand smoke: a Burden of Proof study > Discussion
plaincorrelational- Asserted: passes — The authors put it forward as true.
- Checkable: passes — It can be checked against evidence.
- Load-bearing: passes — The paper’s conclusions depend on it.
- Based: passes — The paper gives a reason why it holds.
A result the paper reports from its own data — it cites no other source for it, so there is none to check. The quote shows it is in the paper.
In the paper
“For otitis media, asthma, lower respiratory infections, breast cancer and COPD, the evidence supporting an association with passive smoking is even weaker, with a one-star rating.”
§ Health effects associated with exposure to secondhand smoke: a Burden of Proof study > Discussion
plaincorrelational- Asserted: passes — The authors put it forward as true.
- Checkable: passes — It can be checked against evidence.
- Load-bearing: passes — The paper’s conclusions depend on it.
- Based: passes — The paper gives a reason why it holds.
What the paper did — it cites no source for this, so there is none to check. The quote shows it is in the paper.
In the paper
“Covariates representing studies that did not control for smoking and those with potential selection bias were found to be significant in our primary model and were adjusted for accordingly (Table 2).”
§ Health effects associated with exposure to secondhand smoke: a Burden of Proof study > Results > Respiratory conditions
plain- Asserted: passes — The authors put it forward as true.
- Checkable: passes — It can be checked against evidence.
- Load-bearing: unclear — It is unclear whether the paper’s conclusions depend on it.
- Based: passes — The paper gives a reason why it holds.
What the paper did — it cites no source for this, so there is none to check. The quote shows it is in the paper.
In the paper
“All studies included in our otitis media model were conducted in never-smoker populations (or classified as such given the age of the studied population (Methods and Supplementary Information Section 2.2))”
§ Health effects associated with exposure to secondhand smoke: a Burden of Proof study > Results > Other health outcomes
plain- Asserted: passes — The authors put it forward as true.
- Checkable: passes — It can be checked against evidence.
- Load-bearing: unclear — It is unclear whether the paper’s conclusions depend on it.
- Based: passes — The paper gives a reason why it holds.
A conclusion the paper draws from its own results — it cites no other source for it, so there is none to check. The quote shows it is in the paper.
In the paper
“the nine disease outcomes we investigated are unlikely to capture the full disease burden associated with SHS exposure.”
§ Health effects associated with exposure to secondhand smoke: a Burden of Proof study > Main
hedged- Asserted: passes — The authors put it forward as true.
- Checkable: passes — It can be checked against evidence.
- Load-bearing: unclear — It is unclear whether the paper’s conclusions depend on it.
- Based: passes — The paper gives a reason why it holds.
What the paper did — it cites no source for this, so there is none to check. The quote shows it is in the paper.
In the paper
“Bias covariates that captured nonprospective cohort studies and studies in which the outcome of interest was self-reported (rather than diagnosed by a doctor) were detected as significant and adjusted for within our final model (Table 2).”
§ Health effects associated with exposure to secondhand smoke: a Burden of Proof study > Results > Other health outcomes
plain- Asserted: passes — The authors put it forward as true.
- Checkable: passes — It can be checked against evidence.
- Load-bearing: unclear — It is unclear whether the paper’s conclusions depend on it.
- Based: passes — The paper gives a reason why it holds.
What the paper did — it cites no source for this, so there is none to check. The quote shows it is in the paper.
In the paper
“No publication bias was found in the type 2 diabetes models.”
§ Health effects associated with exposure to secondhand smoke: a Burden of Proof study > Results > Other health outcomes
plain- Asserted: passes — The authors put it forward as true.
- Checkable: passes — It can be checked against evidence.
- Load-bearing: unclear — It is unclear whether the paper’s conclusions depend on it.
- Based: passes — The paper gives a reason why it holds.
What the paper did — it cites no source for this, so there is none to check. The quote shows it is in the paper.
In the paper
“In our model, observations that did not control for smoking and those from study designs other than prospective cohorts were adjusted since these covariates were found to be significant by our algorithm (Table 2).”
§ Health effects associated with exposure to secondhand smoke: a Burden of Proof study > Results > Cancer
plain- Asserted: passes — The authors put it forward as true.
- Checkable: passes — It can be checked against evidence.
- Load-bearing: passes — The paper’s conclusions depend on it.
- Based: passes — The paper gives a reason why it holds.
A conclusion the paper draws from its own results — it cites no other source for it, so there is none to check. The quote shows it is in the paper.
In the paper
“Together, these inconsistencies can limit the comparability and consolidation of evidence concerning the health effects of SHS.”
§ Health effects associated with exposure to secondhand smoke: a Burden of Proof study > Main
plainconditional- Asserted: passes — The authors put it forward as true.
- Checkable: passes — It can be checked against evidence.
- Load-bearing: passes — The paper’s conclusions depend on it.
- Based: passes — The paper gives a reason why it holds.
What the paper did — it cites no source for this, so there is none to check. The quote shows it is in the paper.
In the paper
“The two-star relationship remained consistent in our sensitivity analysis in which we subset the input data to observations of never smokers only”
§ Health effects associated with exposure to secondhand smoke: a Burden of Proof study > Results > Other health outcomes
plaincorrelational- Asserted: passes — The authors put it forward as true.
- Checkable: passes — It can be checked against evidence.
- Load-bearing: unclear — It is unclear whether the paper’s conclusions depend on it.
- Based: passes — The paper gives a reason why it holds.
What the paper did — it cites no source for this, so there is none to check. The quote shows it is in the paper.
In the paper
“Based on Egger’s regression test, no significant evidence of publication bias was found for the main lung cancer and breast cancer models or the exploratory models”
§ Health effects associated with exposure to secondhand smoke: a Burden of Proof study > Results > Cancer
plain- Asserted: passes — The authors put it forward as true.
- Checkable: passes — It can be checked against evidence.
- Load-bearing: unclear — It is unclear whether the paper’s conclusions depend on it.
- Based: passes — The paper gives a reason why it holds.
What the paper did — it cites no source for this, so there is none to check. The quote shows it is in the paper.
In the paper
“Across these outcomes, no significant publication bias was detected in the primary models (Table 2) or in the sensitivity analyses”
§ Health effects associated with exposure to secondhand smoke: a Burden of Proof study > Results > Respiratory conditions
plain- Asserted: passes — The authors put it forward as true.
- Checkable: passes — It can be checked against evidence.
- Load-bearing: unclear — It is unclear whether the paper’s conclusions depend on it.
- Based: passes — The paper gives a reason why it holds.
What the paper did — it cites no source for this, so there is none to check. The quote shows it is in the paper.
In the paper
“The strength of association as measured in the BPRF framework was not sensitive to any additional restrictions we applied to the input data, meaning that the one-star rating was still observed when we subset the data to prospective cohorts, never-smoking samples and a combination of the two”
§ Health effects associated with exposure to secondhand smoke: a Burden of Proof study > Results > Respiratory conditions
plain- Asserted: passes — The authors put it forward as true.
- Checkable: passes — It can be checked against evidence.
- Load-bearing: passes — The paper’s conclusions depend on it.
- Based: passes — The paper gives a reason why it holds.
A conclusion the paper draws from its own results — it cites no other source for it, so there is none to check. The quote shows it is in the paper.
In the paper
“suggesting that SHS exposure is irrefutably harmful to human health”
§ Health effects associated with exposure to secondhand smoke: a Burden of Proof study > Main
hedgeddirect- Asserted: passes — The authors put it forward as true.
- Checkable: passes — It can be checked against evidence.
- Load-bearing: passes — The paper’s conclusions depend on it.
- Based: passes — The paper gives a reason why it holds.
What the paper did — it cites no source for this, so there is none to check. The quote shows it is in the paper.
In the paper
“Data points associated with a self-reported diagnosis and those restricted to children (age ≤16 years) were adjusted for in our main model, as the corresponding bias covariates were found to be statistically significant (Table 2).”
§ Health effects associated with exposure to secondhand smoke: a Burden of Proof study > Results > Respiratory conditions
plain- Asserted: passes — The authors put it forward as true.
- Checkable: passes — It can be checked against evidence.
- Load-bearing: unclear — It is unclear whether the paper’s conclusions depend on it.
- Based: passes — The paper gives a reason why it holds.
What the paper did — it cites no source for this, so there is none to check. The quote shows it is in the paper.
In the paper
“In further sensitivity analyses, the one-star relationship was still observed when we restricted to observations from never smokers only”
§ Health effects associated with exposure to secondhand smoke: a Burden of Proof study > Results > Cancer
plaincorrelational- Asserted: passes — The authors put it forward as true.
- Checkable: passes — It can be checked against evidence.
- Load-bearing: unclear — It is unclear whether the paper’s conclusions depend on it.
- Based: passes — The paper gives a reason why it holds.
A conclusion the paper draws from its own results — it cites no other source for it, so there is none to check. The quote shows it is in the paper.
In the paper
“to standardize results across studies, we modeled SHS exposure as a dichotomous variable, which may have oversimplified SHS risk profiles by discounting effects related to intensity and frequency of exposure.”
§ Health effects associated with exposure to secondhand smoke: a Burden of Proof study > Main
hedgedconditional- Asserted: passes — The authors put it forward as true.
- Checkable: passes — It can be checked against evidence.
- Load-bearing: unclear — It is unclear whether the paper’s conclusions depend on it.
- Based: passes — The paper gives a reason why it holds.
What the paper did — it cites no source for this, so there is none to check. The quote shows it is in the paper.
In the paper
“Included studies represent all available relevant data identified through our systematic reviews from January 1970 through July 2022.”
§ Health effects associated with exposure to secondhand smoke: a Burden of Proof study > Results > Overview
plain- Asserted: passes — The authors put it forward as true.
- Checkable: passes — It can be checked against evidence.
- Load-bearing: passes — The paper’s conclusions depend on it.
- Based: passes — The paper gives a reason why it holds.
A conclusion the paper draws from its own results — it cites no other source for it, so there is none to check. The quote shows it is in the paper.
In the paper
“Inconsistencies in case definitions and exposure measures and definitions used in the input data may limit the accuracy and generalizability of our findings.”
§ Health effects associated with exposure to secondhand smoke: a Burden of Proof study > Main
hedgedconditional- Asserted: passes — The authors put it forward as true.
- Checkable: passes — It can be checked against evidence.
- Load-bearing: unclear — It is unclear whether the paper’s conclusions depend on it.
- Based: passes — The paper gives a reason why it holds.
What the paper did — it cites no source for this, so there is none to check. The quote shows it is in the paper.
In the paper
“The two-star rating for IHD was consistent with sensitivity analyses in which we restricted the models to studies with a prospective cohort design (Supplementary Table 13), subset to observations of never smokers only (Supplementary Table 14), and applied both these restrictions at the same time (Supplementary Table 15).”
§ Health effects associated with exposure to secondhand smoke: a Burden of Proof study > Results > Cardiovascular diseases
plain- Asserted: passes — The authors put it forward as true.
- Checkable: passes — It can be checked against evidence.
- Load-bearing: unclear — It is unclear whether the paper’s conclusions depend on it.
- Based: passes — The paper gives a reason why it holds.
A conclusion the paper draws from its own results — it cites no other source for it, so there is none to check. The quote shows it is in the paper.
In the paper
“Nonetheless, even under our conservative interpretation of the available data using the BPRF approach, a particular area of considerable increased risk is cardiovascular health.”
§ Health effects associated with exposure to secondhand smoke: a Burden of Proof study > Discussion
plaincorrelational- Asserted: passes — The authors put it forward as true.
- Checkable: passes — It can be checked against evidence.
- Load-bearing: passes — The paper’s conclusions depend on it.
- Based: passes — The paper gives a reason why it holds.
What the paper did — it cites no source for this, so there is none to check. The quote shows it is in the paper.
In the paper
“Because we use the GBD exposure definition, we also do not include data for exposure in public settings, which are largely limited.”
§ Health effects associated with exposure to secondhand smoke: a Burden of Proof study > Discussion
plaindirect- Asserted: passes — The authors put it forward as true.
- Checkable: passes — It can be checked against evidence.
- Load-bearing: passes — The paper’s conclusions depend on it.
- Based: passes — The paper gives a reason why it holds.
A conclusion the paper draws from its own results — it cites no other source for it, so there is none to check. The quote shows it is in the paper.
In the paper
“In spite of the observed variability in the SHS data, which accounts in part for the ROS and star-rating results we obtained, our study reaffirms that exposure to SHS is a harmful risk factor of great public health importance.”
§ Health effects associated with exposure to secondhand smoke: a Burden of Proof study > Discussion
plaindirect- Asserted: passes — The authors put it forward as true.
- Checkable: passes — It can be checked against evidence.
- Load-bearing: passes — The paper’s conclusions depend on it.
- Based: passes — The paper gives a reason why it holds.
What the paper did — it cites no source for this, so there is none to check. The quote shows it is in the paper.
In the paper
“Second, the information collected by surveys frequently asks about current exposure; this means that we lack information on cumulative exposure to SHS and formerly exposed individuals could have been misclassified as unexposed.”
§ Health effects associated with exposure to secondhand smoke: a Burden of Proof study > Discussion
hedgedconditional- Asserted: passes — The authors put it forward as true.
- Checkable: passes — It can be checked against evidence.
- Load-bearing: unclear — It is unclear whether the paper’s conclusions depend on it.
- Based: passes — The paper gives a reason why it holds.
What the paper did — it cites no source for this, so there is none to check. The quote shows it is in the paper.
In the paper
“Third, to account for the lack of a standardized way of capturing exposure to SHS in existing studies, we classify exposure to SHS as dichotomous (exposed or unexposed); however, this may oversimplify the risk profile associated with SHS by not accounting for differences in intensity or frequency of exposure.”
§ Health effects associated with exposure to secondhand smoke: a Burden of Proof study > Discussion
hedgedconditional- Asserted: passes — The authors put it forward as true.
- Checkable: passes — It can be checked against evidence.
- Load-bearing: unclear — It is unclear whether the paper’s conclusions depend on it.
- Based: passes — The paper gives a reason why it holds.
What the paper did — it cites no source for this, so there is none to check. The quote shows it is in the paper.
In the paper
“However, the assessment of the association between SHS and breast cancer relied on studies that were conducted in female-only populations.”
§ Health effects associated with exposure to secondhand smoke: a Burden of Proof study > Methods > Overview
plaincorrelational- Asserted: passes — The authors put it forward as true.
- Checkable: passes — It can be checked against evidence.
- Load-bearing: unclear — It is unclear whether the paper’s conclusions depend on it.
- Based: passes — The paper gives a reason why it holds.
What the paper did — it cites no source for this, so there is none to check. The quote shows it is in the paper.
In the paper
“First, we used studies in which exposure to SHS was self-reported, either directly or measured by proxy (that is, living with a smoking parent or spouse), and this can result in misclassification of exposed and nonexposed participants.”
§ Health effects associated with exposure to secondhand smoke: a Burden of Proof study > Discussion
plainconditional- Asserted: passes — The authors put it forward as true.
- Checkable: passes — It can be checked against evidence.
- Load-bearing: passes — The paper’s conclusions depend on it.
- Based: passes — The paper gives a reason why it holds.
What the paper did — it cites no source for this, so there is none to check. The quote shows it is in the paper.
In the paper
“Similar to previous studies using BPRF methods464–467, the RRs, BPRFs and ROSs estimated in this study are not specific to or disaggregated by certain populations, meaning that we did not estimate RRs separately by geography, sex or age group.”
§ Health effects associated with exposure to secondhand smoke: a Burden of Proof study > Methods > Overview
plain- Asserted: passes — The authors put it forward as true.
- Checkable: passes — It can be checked against evidence.
- Load-bearing: unclear — It is unclear whether the paper’s conclusions depend on it.
- Based: passes — The paper gives a reason why it holds.
- Probably not a substantial claim. 24
- It may state two separate claims as one. 15
- The quote only partly states this claim. 2
The sources with a verdict support this claim; the rest weren’t checked yet, have no full text we could read, or their verdicts aren’t rated yet.
In the paper
“Additionally, previous research, including meta-analyses, found suggestive evidence of an association between SHS exposure and breast cancer13–15.”
§ Health effects associated with exposure to secondhand smoke: a Burden of Proof study > Main
What the sources say
- Supportedcites [13] Kim, A.-S., Ko, H.-J., Kwon, J.-H. & Lee, J.-M. Exposure to secondhand smoke and risk of cancer in never smokers: a meta-analysis of epidemiologic studies. Int. J. Environ. Res. Public Health 15, 1981 (2018). source
The Results (§3.3, Subgroup Analysis) report a statistically significant association between secondhand smoke exposure and breast cancer across 15 studies. The claim’s cautious wording is consistent with the limitations acknowledged in the Discussion (§4). (LLM, conf=0.94)
- Supportedcites [14] Macacu, A., Autier, P., Boniol, M. & Boyle, P. Active and passive smoking and risk of breast cancer: a meta-analysis. Breast Cancer Res. Treat. 154, 213–224 (2015). source
The Discussion says exposure to environmental tobacco smoke seems associated with a moderately increased breast cancer risk, while noting difficulties in assessing second-hand smoke exposure and the small number of studies. The Passive smoking section also reports a statistically significant increase in the meta-analysis of prospective cohorts, supporting the claim's cautious wording. (LLM, conf=0.93)
- Not checked — no full text of the sourcecites [15] Carreras, G. et al. Burden of disease attributable to second-hand smoke exposure: a systematic review. Prev. Med. 129, 105833 (2019). source
hedgedcorrelational- Asserted: passes — The authors put it forward as true.
- Checkable: passes — It can be checked against evidence.
- Load-bearing: fails — The paper’s conclusions may not depend on it.
- Based: passes — The paper gives a reason why it holds.
Probably not a substantial claim. The paper’s conclusions may not depend on it.
- Supported
Every source the paper cites for this claim was checked and supports it.
In the paper
“The present study complies with the PRISMA guidelines19 (Supplementary Tables 17 and 18 and Supplementary Figs. 1–9) and Guidelines for Accurate and Transparent Health Estimates Reporting (GATHER) recommendations (Supplementary Table 19)468.”
§ Health effects associated with exposure to secondhand smoke: a Burden of Proof study > Methods > Overview
What the sources say
- Supportedcites [19] Page, M. J. et al. The PRISMA 2020 statement: an updated guideline for reporting systematic reviews. BMJ 372, n71 (2021). source
The Abstract identifies this paper as the PRISMA 2020 reporting guideline and says it presents its checklists and reporting recommendations. Citation 19 is attached to “PRISMA guidelines”; the citing authors’ assertion that their study complies with them is not a claim this source is asked to verify. The GATHER recommendations have separate citations. (LLM, conf=0.92)
- Supportedcites [468] Stevens, G. A. et al. Guidelines for accurate and transparent health estimates reporting: the GATHER statement. Lancet 388, e19–e23 (2016). source
The Summary identifies this paper as the Guidelines for Accurate and Transparent Health Estimates Reporting (GATHER) and describes its reporting checklist. The citation supports the identification of the GATHER recommendations; the citing authors’ assertion that their study complies with them is not a finding attributed to this source. PRISMA has a separate citation in the citing sentence. (LLM, conf=0.91)
plain- Asserted: passes — The authors put it forward as true.
- Checkable: passes — It can be checked against evidence.
- Load-bearing: fails — The paper’s conclusions may not depend on it.
- Based: passes — The paper gives a reason why it holds.
Probably not a substantial claim. The paper’s conclusions may not depend on it. It may state two separate claims as one.
- Supported
Every source the paper cites for this claim was checked and supports it.
In the paper
“Furthermore, the BPRF framework employed in this study addresses many of the limitations of existing meta-analytical approaches18.”
§ Health effects associated with exposure to secondhand smoke: a Burden of Proof study > Discussion
What the sources say
- Supportedcites [18] Aravkin, A. Y. et al. Reply to: concerns about the Burden of Proof studies. Nat. Med. 29, 826–827 (2023). source
In “Reply to: Concerns about the Burden of Proof studies” (page not provided), the authors say the BoP approach was designed to address key problems in current analytical frameworks. They describe how it accounts for between-study heterogeneity and avoids imposing a log-linear relationship, supporting the broad paraphrase. (LLM, conf=0.91)
plaindirect- Asserted: passes — The authors put it forward as true.
- Checkable: passes — It can be checked against evidence.
- Load-bearing: passes — The paper’s conclusions depend on it.
- Based: passes — The paper gives a reason why it holds.
Probably not a substantial claim.
- Supported
A result the paper reports from its own data — it cites no other source for it, so there is none to check. The quote shows it is in the paper.
In the paper
“Overall, we found SHS to have small to moderate quantitative impacts on health—mean effect sizes range from 1.12 for otitis media to 1.44 for COPD—which is in line with previous assessments13,431–441 and anticipated on the basis of mechanistic processes leading to diseases5.”
§ Health effects associated with exposure to secondhand smoke: a Burden of Proof study > Discussion
plaincorrelational- Asserted: passes — The authors put it forward as true.
- Checkable: passes — It can be checked against evidence.
- Load-bearing: passes — The paper’s conclusions depend on it.
- Based: passes — The paper gives a reason why it holds.
It may state two separate claims as one.
A result the paper reports from its own data — it cites no other source for it, so there is none to check. The quote shows it is in the paper.
In the paper
“when restricting our analysis to prospective cohort studies, the ROS was slightly higher, elevating the risk–outcome relationship to a two-star rating, with no bias covariates found statistically significant”
§ Health effects associated with exposure to secondhand smoke: a Burden of Proof study > Results > Other health outcomes
plaincorrelational- Asserted: passes — The authors put it forward as true.
- Checkable: passes — It can be checked against evidence.
- Load-bearing: unclear — It is unclear whether the paper’s conclusions depend on it.
- Based: passes — The paper gives a reason why it holds.
It may state two separate claims as one.
The paper states this without a source or data behind it here, so there is nothing to check it against. The quote shows it is in the paper.
In the paper
“which equates to a ROS of −0.03”
§ Health effects associated with exposure to secondhand smoke: a Burden of Proof study > Results > Other health outcomes
plain- Asserted: passes — The authors put it forward as true.
- Checkable: passes — It can be checked against evidence.
- Load-bearing: unclear — It is unclear whether the paper’s conclusions depend on it.
- Based: passes — The paper gives a reason why it holds.
The quote only partly states this claim.
A result the paper reports from its own data — it cites no other source for it, so there is none to check. The quote shows it is in the paper.
In the paper
“the ROS for COPD was also negative (−0.14)”
§ Health effects associated with exposure to secondhand smoke: a Burden of Proof study > Results > Respiratory conditions
plaincorrelational- Asserted: passes — The authors put it forward as true.
- Checkable: passes — It can be checked against evidence.
- Load-bearing: passes — The paper’s conclusions depend on it.
- Based: passes — The paper gives a reason why it holds.
The quote only partly states this claim.
A result the paper reports from its own data — it cites no other source for it, so there is none to check. The quote shows it is in the paper.
In the paper
“Our study contributes to previous iterations of the GBD by not only increasing the number of studies informing each of the existing SHS–outcome associations but by assessing the relationship between passive smoking and asthma, a risk–outcome pair not yet incorporated into the GBD but deemed eligible for further consideration.”
§ Health effects associated with exposure to secondhand smoke: a Burden of Proof study > Discussion
plaincorrelational- Asserted: passes — The authors put it forward as true.
- Checkable: passes — It can be checked against evidence.
- Load-bearing: passes — The paper’s conclusions depend on it.
- Based: passes — The paper gives a reason why it holds.
It may state two separate claims as one.
A result the paper reports from its own data — it cites no other source for it, so there is none to check. The quote shows it is in the paper.
In the paper
“In particular, we found insufficient evidence to support an association with SHS when restricting to prospective cohort studies (breast cancer) and never smokers (COPD), even when not incorporating between-study heterogeneity in our estimates of uncertainty.”
§ Health effects associated with exposure to secondhand smoke: a Burden of Proof study > Discussion
plain- Asserted: passes — The authors put it forward as true.
- Checkable: passes — It can be checked against evidence.
- Load-bearing: passes — The paper’s conclusions depend on it.
- Based: passes — The paper gives a reason why it holds.
It may state two separate claims as one.
What the paper did — it cites no source for this, so there is none to check. The quote shows it is in the paper.
In the paper
“We did not detect publication bias, as identified by Egger’s regression test, in the primary analysis or in any of the sensitivity analyses for the cardiovascular outcomes”
§ Health effects associated with exposure to secondhand smoke: a Burden of Proof study > Results > Cardiovascular diseases
plain- Asserted: passes — The authors put it forward as true.
- Checkable: passes — It can be checked against evidence.
- Load-bearing: unclear — It is unclear whether the paper’s conclusions depend on it.
- Based: passes — The paper gives a reason why it holds.
It may state two separate claims as one.
What the paper did — it cites no source for this, so there is none to check. The quote shows it is in the paper.
In the paper
“The potential existence of publication bias, which, if present, would affect the validity of the results, was tested using Egger’s regression.”
§ Health effects associated with exposure to secondhand smoke: a Burden of Proof study > Results > Overview
plain- Asserted: passes — The authors put it forward as true.
- Checkable: passes — It can be checked against evidence.
- Load-bearing: fails — The paper’s conclusions may not depend on it.
- Based: passes — The paper gives a reason why it holds.
Probably not a substantial claim. The paper’s conclusions may not depend on it.
What the paper did — it cites no source for this, so there is none to check. The quote shows it is in the paper.
In the paper
“the automated covariate selection did not find any significant bias covariates for inclusion in the main or alternative final models”
§ Health effects associated with exposure to secondhand smoke: a Burden of Proof study > Results > Other health outcomes
plain- Asserted: passes — The authors put it forward as true.
- Checkable: passes — It can be checked against evidence.
- Load-bearing: fails — The paper’s conclusions may not depend on it.
- Based: passes — The paper gives a reason why it holds.
Probably not a substantial claim. The paper’s conclusions may not depend on it.
What the paper did — it cites no source for this, so there is none to check. The quote shows it is in the paper.
In the paper
“The covariate selection algorithm flagged studies performed among populations that were not generalizable and those that used exposure definitions other than current SHS (for example, ever exposure to SHS) to be adjusted in our final model (Table 2).”
§ Health effects associated with exposure to secondhand smoke: a Burden of Proof study > Results > Respiratory conditions
plain- Asserted: passes — The authors put it forward as true.
- Checkable: passes — It can be checked against evidence.
- Load-bearing: fails — The paper’s conclusions may not depend on it.
- Based: passes — The paper gives a reason why it holds.
Probably not a substantial claim. The paper’s conclusions may not depend on it.
What the paper did — it cites no source for this, so there is none to check. The quote shows it is in the paper.
In the paper
“The bias covariate algorithm selected observations that did not originally control for smoking to be adjusted in the final model (Table 2).”
§ Health effects associated with exposure to secondhand smoke: a Burden of Proof study > Results > Cancer
plain- Asserted: passes — The authors put it forward as true.
- Checkable: passes — It can be checked against evidence.
- Load-bearing: fails — The paper’s conclusions may not depend on it.
- Based: passes — The paper gives a reason why it holds.
Probably not a substantial claim. The paper’s conclusions may not depend on it.
A conclusion the paper draws from its own results — it cites no other source for it, so there is none to check. The quote shows it is in the paper.
In the paper
“Although some of the SHS–disease associations we estimated were relatively weak, this is due in part to inconsistencies in methods and results across input studies.”
§ Health effects associated with exposure to secondhand smoke: a Burden of Proof study > Main
hedgeddirect- Asserted: passes — The authors put it forward as true.
- Checkable: passes — It can be checked against evidence.
- Load-bearing: unclear — It is unclear whether the paper’s conclusions depend on it.
- Based: passes — The paper gives a reason why it holds.
It may state two separate claims as one.
What the paper did — it cites no source for this, so there is none to check. The quote shows it is in the paper.
In the paper
“The selected bias covariates were chosen for inclusion in the model using an algorithm that systematically detects bias covariates that correspond to significant sources of bias in the included observations.”
§ Health effects associated with exposure to secondhand smoke: a Burden of Proof study > Results > Overview
plain- Asserted: passes — The authors put it forward as true.
- Checkable: passes — It can be checked against evidence.
- Load-bearing: fails — The paper’s conclusions may not depend on it.
- Based: passes — The paper gives a reason why it holds.
Probably not a substantial claim. The paper’s conclusions may not depend on it.
What the paper did — it cites no source for this, so there is none to check. The quote shows it is in the paper.
In the paper
“We found no publication bias in our primary model, but a statistically significant evidence of publication bias was found in our prospective cohort sensitivity analysis.”
§ Health effects associated with exposure to secondhand smoke: a Burden of Proof study > Results > Other health outcomes
plain- Asserted: passes — The authors put it forward as true.
- Checkable: passes — It can be checked against evidence.
- Load-bearing: unclear — It is unclear whether the paper’s conclusions depend on it.
- Based: passes — The paper gives a reason why it holds.
It may state two separate claims as one.
What the paper did — it cites no source for this, so there is none to check. The quote shows it is in the paper.
In the paper
“We systematically tested for the effect of bias covariates using a selection algorithm, which uses a step-wise Lasso strategy to identify statistically significant covariates at a threshold of 0.05, and adjusted for the selected bias covariates in the final model used to generate the RR estimates.”
§ Health effects associated with exposure to secondhand smoke: a Burden of Proof study > Methods > Testing and adjusting for biases across study designs and characteristics
plain- Asserted: passes — The authors put it forward as true.
- Checkable: passes — It can be checked against evidence.
- Load-bearing: passes — The paper’s conclusions depend on it.
- Based: passes — The paper gives a reason why it holds.
Probably not a substantial claim. It may state two separate claims as one.
What the paper did — it cites no source for this, so there is none to check. The quote shows it is in the paper.
In the paper
“In the included studies, those not exposed at work or home may be exposed to SHS at other settings, and this bias, similar to our first limitation above, will tend to underestimate the true RR.”
§ Health effects associated with exposure to secondhand smoke: a Burden of Proof study > Discussion
hedgeddirect- Asserted: passes — The authors put it forward as true.
- Checkable: passes — It can be checked against evidence.
- Load-bearing: unclear — It is unclear whether the paper’s conclusions depend on it.
- Based: passes — The paper gives a reason why it holds.
It may state two separate claims as one.
In the paper
“However, comprehensive smoke-free legislation (that is, covering all indoor public places) is in place in only 67 countries, protecting less than 25% of the world’s population7.”
§ Health effects associated with exposure to secondhand smoke: a Burden of Proof study > Discussion
What the sources say
- Not matchedcites [7] WHO Report on the Global Tobacco Epidemic 2021: Addressing New and Emerging Products. (World Health Organization, 2021).
Couldn’t be matched to a paper in Crossref, so it can’t be checked.
plain- Asserted: passes — The authors put it forward as true.
- Checkable: passes — It can be checked against evidence.
- Load-bearing: unclear — It is unclear whether the paper’s conclusions depend on it.
- Based: passes — The paper gives a reason why it holds.
It may state two separate claims as one.
- Not matched
What the paper did — it cites no source for this, so there is none to check. The quote shows it is in the paper.
In the paper
“Bias covariates were created to capture the impact of using alternate exposure definitions.”
§ Health effects associated with exposure to secondhand smoke: a Burden of Proof study > Methods > Estimating pooled RRs for each risk–outcome pair
plaindirect- Asserted: passes — The authors put it forward as true.
- Checkable: passes — It can be checked against evidence.
- Load-bearing: fails — The paper’s conclusions may not depend on it.
- Based: passes — The paper gives a reason why it holds.
Probably not a substantial claim. The paper’s conclusions may not depend on it.
What the paper did — it cites no source for this, so there is none to check. The quote shows it is in the paper.
In the paper
“This study did not engage in primary data collection, randomization or blinding. Therefore, data exclusions were not relevant to the present study, and, as such, no data were excluded from the analyses.”
§ Health effects associated with exposure to secondhand smoke: a Burden of Proof study > Methods > Statistical analysis and reproducibility
plain- Asserted: passes — The authors put it forward as true.
- Checkable: passes — It can be checked against evidence.
- Load-bearing: fails — The paper’s conclusions may not depend on it.
- Based: passes — The paper gives a reason why it holds.
Probably not a substantial claim. The paper’s conclusions may not depend on it. It may state two separate claims as one.
What the paper did — it cites no source for this, so there is none to check. The quote shows it is in the paper.
In the paper
“Finally, despite the inclusion of asthma, a new health outcome to be considered for inclusion in the GBD, the outcomes assessed here do not necessarily reflect the harms associated with SHS in full.”
§ Health effects associated with exposure to secondhand smoke: a Burden of Proof study > Discussion
hedged- Asserted: passes — The authors put it forward as true.
- Checkable: passes — It can be checked against evidence.
- Load-bearing: fails — The paper’s conclusions may not depend on it.
- Based: passes — The paper gives a reason why it holds.
Probably not a substantial claim. The paper’s conclusions may not depend on it.
What the paper did — it cites no source for this, so there is none to check. The quote shows it is in the paper.
In the paper
“All extracted data underwent manual quality assurance by the research team to verify accuracy.”
§ Health effects associated with exposure to secondhand smoke: a Burden of Proof study > Methods > Systematic review
plain- Asserted: passes — The authors put it forward as true.
- Checkable: passes — It can be checked against evidence.
- Load-bearing: fails — The paper’s conclusions may not depend on it.
- Based: passes — The paper gives a reason why it holds.
Probably not a substantial claim. The paper’s conclusions may not depend on it.
What the paper did — it cites no source for this, so there is none to check. The quote shows it is in the paper.
In the paper
“In this study, the RR metric of primary interest was the pooled RR with 95% uncertainty intervals that are inclusive (using gamma) of the effect of between-study heterogeneity.”
§ Health effects associated with exposure to secondhand smoke: a Burden of Proof study > Methods > Quantifying remaining between-study heterogeneity
plain- Asserted: passes — The authors put it forward as true.
- Checkable: passes — It can be checked against evidence.
- Load-bearing: passes — The paper’s conclusions depend on it.
- Based: passes — The paper gives a reason why it holds.
Probably not a substantial claim.
What the paper did — it cites no source for this, so there is none to check. The quote shows it is in the paper.
In the paper
“We flagged the potential publication bias but did not correct for it in the model.”
§ Health effects associated with exposure to secondhand smoke: a Burden of Proof study > Methods > Evaluating publication and reporting bias
plain- Asserted: passes — The authors put it forward as true.
- Checkable: passes — It can be checked against evidence.
- Load-bearing: fails — The paper’s conclusions may not depend on it.
- Based: passes — The paper gives a reason why it holds.
Probably not a substantial claim. The paper’s conclusions may not depend on it.
In the paper
“Following the BPRF methodology, we applied a 10% likelihood-based data-trimming algorithm to detect and remove outliers that may otherwise over-influence the model. This approach is suggested for all analyses with more than ten data points; therefore, it was implemented across all of our primary risk–outcome assessments and most of our sensitivity analyses470.”
§ Health effects associated with exposure to secondhand smoke: a Burden of Proof study > Methods > Estimating pooled RRs for each risk–outcome pair
What the sources say
- Not checked — no full text of the sourcecites [470] Zheng, P., Barber, R., Sorensen, R. J. D., Murray, C. J. L. & Aravkin, A. Y. Trimmed constrained mixed effects models: formulations and algorithms. J. Comput. Graph. Stat. 30, 544–556 (2021). source
plain- Asserted: passes — The authors put it forward as true.
- Checkable: passes — It can be checked against evidence.
- Load-bearing: fails — The paper’s conclusions may not depend on it.
- Based: passes — The paper gives a reason why it holds.
Probably not a substantial claim. The paper’s conclusions may not depend on it.
A conclusion the paper draws from its own results — it cites no other source for it, so there is none to check. The quote shows it is in the paper.
In the paper
“Similarly, our findings also suggest that the risk of lung cancer and type 2 diabetes are also elevated for those exposed to SHS.”
§ Health effects associated with exposure to secondhand smoke: a Burden of Proof study > Discussion
hedgedcorrelational- Asserted: passes — The authors put it forward as true.
- Checkable: passes — It can be checked against evidence.
- Load-bearing: passes — The paper’s conclusions depend on it.
- Based: passes — The paper gives a reason why it holds.
It may state two separate claims as one.
What the paper did — it cites no source for this, so there is none to check. The quote shows it is in the paper.
In the paper
“To reduce the influence on our model of multiple observations coming from the same study, we adjusted the standard errors of effect sizes reported for multiple non-mutually exclusive exposure groups in each study by a factor matching the number of repeated measurements within each age–sex–smoking status group (Supplementary Information Section 2.2).”
§ Health effects associated with exposure to secondhand smoke: a Burden of Proof study > Methods > Estimating pooled RRs for each risk–outcome pair
plain- Asserted: passes — The authors put it forward as true.
- Checkable: passes — It can be checked against evidence.
- Load-bearing: passes — The paper’s conclusions depend on it.
- Based: passes — The paper gives a reason why it holds.
Probably not a substantial claim.
What the paper did — it cites no source for this, so there is none to check. The quote shows it is in the paper.
In the paper
“For the present study, we conducted three main sensitivity analyses to examine the robustness of our primary findings to our data input in which we kept most of the model parameters consistent but (1) restricted our analysis to studies with a prospective cohort design; (2) subset our input data to never-smoking samples only; and (3) applied both these restrictions in conjunction.”
§ Health effects associated with exposure to secondhand smoke: a Burden of Proof study > Methods > Model validation
plain- Asserted: passes — The authors put it forward as true.
- Checkable: passes — It can be checked against evidence.
- Load-bearing: fails — The paper’s conclusions may not depend on it.
- Based: passes — The paper gives a reason why it holds.
Probably not a substantial claim. The paper’s conclusions may not depend on it. It may state two separate claims as one.
What the paper did — it cites no source for this, so there is none to check. The quote shows it is in the paper.
In the paper
“For asthma, specifically, we ran an additional model in which we restrict the data to those studies performed among children only (≤16 years old).”
§ Health effects associated with exposure to secondhand smoke: a Burden of Proof study > Methods > Model validation
plain- Asserted: passes — The authors put it forward as true.
- Checkable: passes — It can be checked against evidence.
- Load-bearing: fails — The paper’s conclusions may not depend on it.
- Based: passes — The paper gives a reason why it holds.
Probably not a substantial claim. The paper’s conclusions may not depend on it.
What the paper did — it cites no source for this, so there is none to check. The quote shows it is in the paper.
In the paper
“We have made our data and code available to foster reproducibility.”
§ Health effects associated with exposure to secondhand smoke: a Burden of Proof study > Methods > Statistical analysis and reproducibility
plain- Asserted: passes — The authors put it forward as true.
- Checkable: passes — It can be checked against evidence.
- Load-bearing: fails — The paper’s conclusions may not depend on it.
- Based: passes — The paper gives a reason why it holds.
Probably not a substantial claim. The paper’s conclusions may not depend on it.
What the paper did — it cites no source for this, so there is none to check. The quote shows it is in the paper.
In the paper
“After adjusting for study-level bias covariates, we used a linear mixed-effects model to capture the remaining unexplained between-study heterogeneity, in which we included a study-level random slope (gamma) and a study-level random intercept for within-study correlation.”
§ Health effects associated with exposure to secondhand smoke: a Burden of Proof study > Methods > Quantifying remaining between-study heterogeneity
plain- Asserted: passes — The authors put it forward as true.
- Checkable: passes — It can be checked against evidence.
- Load-bearing: passes — The paper’s conclusions depend on it.
- Based: passes — The paper gives a reason why it holds.
Probably not a substantial claim.
In the paper
“We also assessed each study for risk of potential bias following the Grading of Recommendations, Assessment, Development and Evaluations (GRADE) approach and recorded the information in the extraction template469.”
§ Health effects associated with exposure to secondhand smoke: a Burden of Proof study > Methods > Systematic review
What the sources say
- Not checked — no full text of the sourcecites [469] Guyatt, G. H. et al. GRADE guidelines: 4. Rating the quality of evidence—study limitations (risk of bias). J. Clin. Epidemiol. 64, 407–415 (2011). source
plain- Asserted: passes — The authors put it forward as true.
- Checkable: passes — It can be checked against evidence.
- Load-bearing: fails — The paper’s conclusions may not depend on it.
- Based: passes — The paper gives a reason why it holds.
Probably not a substantial claim. The paper’s conclusions may not depend on it.
What the paper did — it cites no source for this, so there is none to check. The quote shows it is in the paper.
In the paper
“As a component of the GBD, the present analysis was approved by the University of Washington institutional review board committee (study no. 9060).”
§ Health effects associated with exposure to secondhand smoke: a Burden of Proof study > Methods > Overview
plain- Asserted: passes — The authors put it forward as true.
- Checkable: passes — It can be checked against evidence.
- Load-bearing: fails — The paper’s conclusions may not depend on it.
- Based: passes — The paper gives a reason why it holds.
Probably not a substantial claim. The paper’s conclusions may not depend on it.
What the paper did — it cites no source for this, so there is none to check. The quote shows it is in the paper.
In the paper
“No statistical method was used to predetermine sample size. For each health outcome, we included all studies that met our inclusion criteria.”
§ Health effects associated with exposure to secondhand smoke: a Burden of Proof study > Methods > Statistical analysis and reproducibility
plain- Asserted: passes — The authors put it forward as true.
- Checkable: passes — It can be checked against evidence.
- Load-bearing: fails — The paper’s conclusions may not depend on it.
- Based: passes — The paper gives a reason why it holds.
Probably not a substantial claim. The paper’s conclusions may not depend on it. It may state two separate claims as one.
The paper relies on this without support.
Substantial heterogeneity exists across and within SHS risk–outcome assessments in terms of quantity and quality of studies and reported strength of associations.
“Despite these findings, substantial heterogeneity is detected across and within SHS risk–outcome assessments in terms of quantity and quality of studies and reported strength of associations.”
The paper relies on this without support.
Variation across studies in definitions of risk exposure used is observed.
“Variation across studies in the definitions of risk exposure used is also observed, with some reporting the risk associated with SHS exposure in specific settings16 or from specific sources (that is, maternal, paternal)17.”
The paper relies on this without support.
The units and dose categories reported across studies vary widely due to limited availability of studies with environmental and biological samples and lack of a standard measure of SHS exposure.
“Furthermore, given the limited availability of studies that assess exposure to tobacco smoke on the basis of environmental and biological samples, and the lack of a standard measure of SHS exposure, the units and dose categories reported across studies vary widely.”
The paper relies on this without support.
These inconsistencies limit the comparability and consolidation of evidence concerning the health effects of SHS.
“Together, these inconsistencies can limit the comparability and consolidation of evidence concerning the health effects of SHS.”
Self-check
Percentages, sums and reported differences re-computed from the paper’s own numbers.
Each contradiction between two passages listed here was confirmed by an independent check.
Rated minor: it would not touch a result — a value no result rests on, a p-value that stays on the same side of the significance level, or a conflict that is clerical, resolved elsewhere in the paper, or outside its own findings.
In the paper
§ Health effects associated with exposure to secondhand smoke: a Burden of Proof study > Methods > Statistical analysis and reproducibility
“Therefore, data exclusions were not relevant to the present study, and, as such, no data were excluded from the analyses.”
§ Health effects associated with exposure to secondhand smoke: a Burden of Proof study > Methods > Estimating pooled RRs for each risk–outcome pair
“Following the BPRF methodology, we applied a 10% likelihood-based data-trimming algorithm to detect and remove outliers that may otherwise over-influence the model. This approach is suggested for all analyses with more than ten data points; therefore, it was implemented across all of our primary risk–outcome assessments and most of our sensitivity analyses470.”
Citations
Cites
The PRISMA 2020 statement: An updated guideline for reporting systematic reviews
Page, M. J., McKenzie, J. E., Bossuyt, P. M., Boutron, I., Hoffmann, T. C., Mulrow, C. D., Shamseer, L., Tetzlaff, J. M., Akl, E. A., Brennan, S. E., et al. (2021) · BMJ · doi:10.1136/bmj.n71 · Cited by 108,283
Vos, T., Lim, S. S., Abbafati, C., Abbas, K. M., Abbasi, M., Abbasifard, M., Abbasi-Kangevari, M., Abbastabar, H., Abd-Allah, F., Abdelalim, A., et al. (2020) · The Lancet · doi:10.1016/s0140-6736(20)30925-9 · Cited by 19,358 · cited 2×
“This is of particular concern as IHD and stroke are the two major causes of premature death and loss of healthy life worldwide 449 .”
BackgroundSelf-citationMurray, C. J. L., Aravkin, A. Y., Zheng, P., Abbafati, C., Abbas, K. M., Abbasi-Kangevari, M., Abd-Allah, F., Abdelalim, A., Abdollahi, M., Abdollahpour, I., et al. (2020) · The Lancet · doi:10.1016/s0140-6736(20)30752-2 · Cited by 9,854
Self-citationThe Health consequences of smoking—50 years of progress : a report of the Surgeon General
Lushniak, B. D., Samet, J. M., Pechacek, T. F., Norman, L., & Taylor, P. A. (2014) · Cited by 4,990
GRADE guidelines: 4. Rating the quality of evidence—study limitations (risk of bias)
Guyatt, G. H., Oxman, A. D., Vist, G., Kunz, R., Brozek, J., Alonso-Coello, P., Montori, V., Akl, E. A., Djulbegovic, B., & Falck-Ytter, Y. (2011) · Journal of Clinical Epidemiology · doi:10.1016/j.jclinepi.2010.07.017 · Cited by 2,798 · cited 1×
“We also assessed each study for risk of potential bias following the Grading of Recommendations, Assessment, Development and Evaluations (GRADE) approach and recorded the information in the extraction template 469 .”
MethodGakidou, E., Afshin, A., Abajobir, A. A., Abate, K. H., Abbafati, C., Abbas, K. M., Abd-Allah, F., Abdulle, A. M., Abera, S. F., Aboyans, V., et al. (2017) · The Lancet · doi:10.1016/s0140-6736(17)32366-8 · Cited by 2,406 · cited 11×
“Across these outcomes, no significant publication bias was detected in the primary models (Table 2) or in the sensitivity analyses (Supplementary Tables 13–16).”
BackgroundInfluentialSelf-citationKocarnik, J., Compton, K., Dean, F. E., Fu, W., Gaw, B., Harvey, J. D., Henrikson, H. J., Lu, D., Pennini, A., Xu, R., et al. (2021) · JAMA Oncology · doi:10.1001/jamaoncol.2021.6987 · Cited by 2,200 · cited 1×
“Because breast cancer is the most frequent type of cancer in women and accounts for substantial morbidity and mortality, research should continue to examine its association with exposure to SHS 451 .”
Guidelines for accurate and transparent health estimates reporting: the GATHER statement
Stevens, G. A., Alkema, L., Black, R. E., Boerma, J. T., Collins, G. S., Ezzati, M., Grove, J. T., Hogan, D. R., Hogan, M. C., Horton, R., et al. (2016) · The Lancet · doi:10.1016/s0140-6736(16)30388-9 · Cited by 1,798
Self-citationReitsma, M. B., Kendrick, P. J., Ababneh, E., Abbafati, C., Abbasi-Kangevari, M., Abdoli, A., Abedi, A., Abhilash, E. S., Abila, D. B., Aboyans, V., et al. (2021) · The Lancet · doi:10.1016/s0140-6736(21)01169-7 · Cited by 1,759 · cited 3×
“1–9).”
BackgroundInfluentialSelf-citationTeele, D. W., Klein, J. O., ROSNER, B. A., & Greater Boston Otitis Media Study Group (1989) · The Journal of Infectious Diseases · doi:10.1093/infdis/160.1.83 · Cited by 1,488
Research works printed but not linked: 4
- Salama, B. M., Abukanna, A. & Hegazy, A. Risk factors associated with chronic obstructive pulmonary disease in Arar, Saudi Arabia: a case–control study. Med. Sci. 24, 2487–2493 (2020).
- Janghorbani, M. & Sadeghigolmakani, N. Passive smoking and the risk of coronary heart disease among married non-smoking women. Med. J. Islam. Repub. Iran 11, 203–208 (1997).
- Woo, C. et al. A prospective study of passive cigarette smoke exposure and breast cancer. Am. J. Epidemiol. 151, 11 (2000).
- Dina, A. D. & Djuwita, R. The role of exclusive breastfeeding in reducing pneumonia prevalence in children under five. J. Gizi dan Pangan 16, 89–98 (2021).
Cited by
Sorted by citations
Hay, S. I., Ong, K. L., Santomauro, D. F., A, B., Aalipour, M. A., Aalruz, H., Ababneh, H. S., Abaraogu, U. O., Abate, B. B., Abbafati, C., et al. (2025) · The Lancet · doi:10.1016/s0140-6736(25)01637-x · Cited by 916
Self-citationForma, A., Kłodnicka, K., Pająk, W., Flieger, J., Teresińska, B., Januszewski, J., & Baj, J. (2025) · International Journal of Molecular Sciences · doi:10.3390/ijms26115173 · Cited by 132
“Even minimal SHS exposure induces immediate inflammatory responses, lasting for hours [90].”
Huang, X., Steinmetz, J. D., Marsh, E. K., Aravkin, A. Y., Ashbaugh, C., Murray, C. J. L., Yang, F., Ji, J. S., Zheng, P., Sorensen, R. J. D., et al. (2025) · Nature Aging · doi:10.1038/s43587-025-00844-y · Cited by 76
“The ‘Burden of Proof’ framework has been employed to assess health effects associated with other risk factors 90–97 .”
Self-citationBhangdia, K. P., May, M. L., Kocarnik, J., Pritchett, N. R., Crist, A., Penberthy, L., Acheson, A., Deitesfeld, L., Bhoomadevi, A., Aalruz, H., et al. (2026) · The Lancet Oncology · doi:10.1016/s1470-2045(25)00730-2 · Cited by 71
Advances in Non-Small Cell Lung Cancer: Current Insights and Future Directions
Garg, P., Singhal, S., Kulkarni, P., Horne, D. A., Malhotra, J. D., Salgia, R., & Singhal, S. S. (2024) · Journal of Clinical Medicine · doi:10.3390/jcm13144189 · Cited by 77
“Additionally, exposure to secondhand smoke significantly raises the risk of lung cancer in non-smokers [4].”
Background
Metadata
- Authors
- Flor, L. S., Anderson, J. A., Ahmad, N., Aravkin, A., Carr, S., Dai, X., Gil, G. F., Hay, S. I., Malloy, M. J., McLaughlin, S. A., Mullany, E. C., Murray, C. J. L., O’Connell, E. M., Okereke, C., Sorensen, R. J. D., Whisnant, J., Zheng, P., & Gakidou, E.
- Affiliations
- University of Washington (US)
- ORCID
- Venue
- Nature Medicine
- Published
- 2024-01
- Volume
- 30
- Issue
- 1
- Pages
- 149-167
- ISSN
- 1078-8956 (ISSN-L)
- 1546-170X
- PMC
- PMC10803272
- OpenAlex
- W4390706631
- Semantic Scholar
- b2594595aa44eea39d24b194c85ea97e6be58be7
- Cited by
- 167
- References
- 469
- Citations by year
- 2026: 75 · 2025: 71 · 2024: 21
- FWCI
- 47.64
- Type
- journal article
- Language
- en
- Update notices
- correction (2024-01-30)
- Open access
- hybrid
- doi.org
- Locations
- Nature Medicine (publishedVersion, cc-by)
- PubMed (publishedVersion)
- PubMed Central (submittedVersion, cc-by)
- Funders
- Bloomberg Family Foundation
- Topics
- Health Sciences › Medicine › Public Health, Environmental and Occupational Health › Smoking Behavior and Cessation
- Physical Sciences › Environmental Science › Health, Toxicology and Mutagenesis › Air Quality and Health Impacts
- Health Sciences › Medicine › Pulmonary and Respiratory Medicine › Chronic Obstructive Pulmonary Disease (COPD) Research
- Keywords
- passive smoking, non-smokers, health outcomes, ischemic heart disease, stroke, type 2 diabetes, lung cancer, otitis media, asthma, lower respiratory tract infection, breast cancer, chronic obstructive pulmonary disease, quality of evidence
- MeSH terms
- Asthma, Breast Neoplasms, Child, Diabetes Mellitus, Type 2, Female, Humans, Respiratory Tract Infections, Tobacco Smoke Pollution
About these checks
Registry, retraction, Cites and statistics results are computed, not judged, with one exception: a printed reference that no index lists is read once by a model before it counts as a citation error. Claims are extracted by a model and kept only when their quote appears verbatim in the text; each cited source is then checked, with a model’s help, for whether it says what the claim relies on. Those verdicts can be wrong — read the claim’s quote and the cited source before relying on one.
A language model drew the claims from the paper on 2026-10-29, under version 3 of the claim definition (model deepseek-v4.1-flash, prompt extract-v3).
A second model labelled each claim on 2026-10-29 (model jev-1.13-20260917, definition revision gold-guideline-v0.2).
Cited sources are checked with a language model’s help (gpt-6-sol).
Statistics and arithmetic are recomputed, not judged.
Confidence bands are shown only for fields calibrated on our annotated test set. None is calibrated yet, so no band is shown.
What counts as a claim ›How we measure confidence ›How we check this ›
Are you an author, or do you see a problem with this page? Request a review
