

The DOI matches its Crossref record; 71 of the 72 references it cites were found in a registry or an index.
Transparent medical image AI via an image–text foundation model grounded in medical literature
Open accessPublished version of a preprint
Abstract
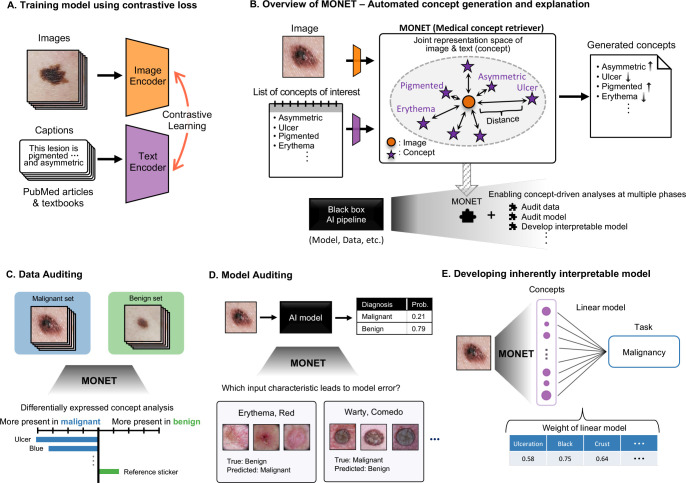
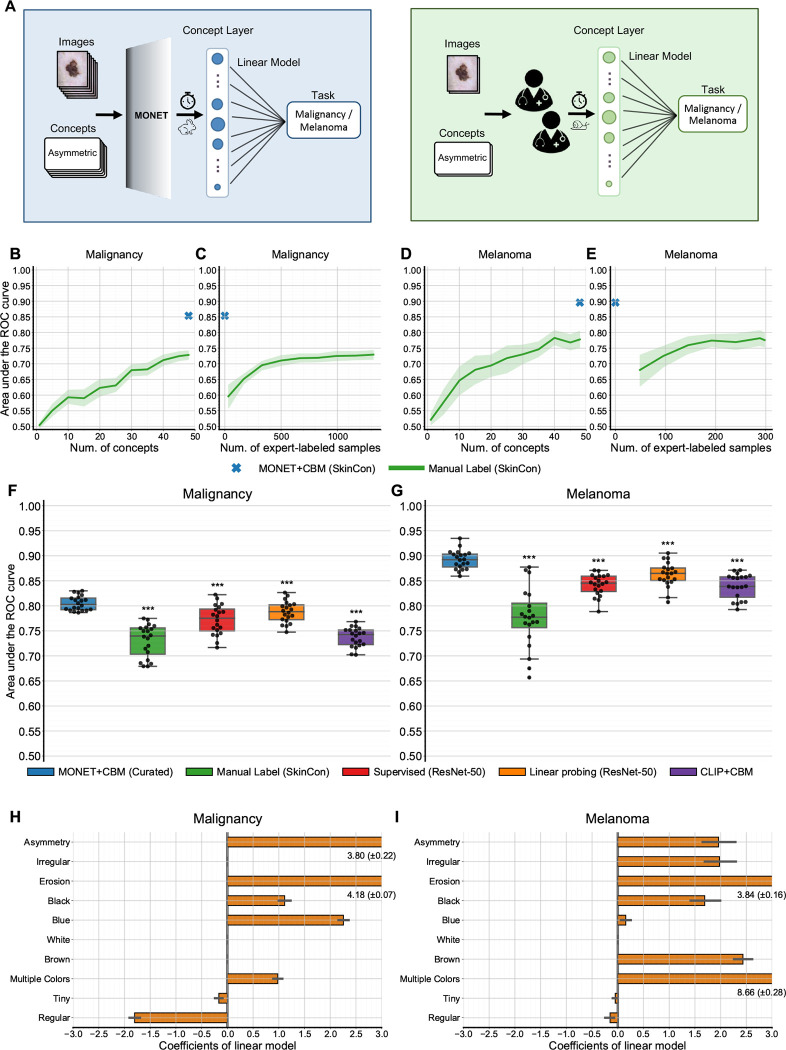
Abstract Building trustworthy and transparent image-based medical AI systems requires the ability to interrogate data and models at all stages of the development pipeline: from training models to post-deployment monitoring. Ideally, the data and associated AI systems could be described using terms already familiar to physicians, but this requires medical datasets densely annotated with semantically meaningful concepts. Here, we present a foundation model approach, named MONET ( M edical c ON cept r ET riever), which learns how to connect medical images with text and generates dense concept annotations to enable tasks in AI transparency from model auditing to model interpretation. Dermatology provides a demanding use case for the versatility of MONET, due to the heterogeneity in diseases, skin tones, and imaging modalities. We trained MONET on the basis of 105,550 dermatological images paired with natural language descriptions from a large collection of medical literature. MONET can accurately annotate concepts across dermatology images as verified by board-certified dermatologists, outperforming supervised models built on previously concept-annotated dermatology datasets. We demonstrate how MONET enables AI transparency across the entire AI development pipeline from dataset auditing to model auditing to building inherently interpretable models.
Overview
The claims and statistics of this paper haven’t been checked yet.
Run the check — free, no account needed. It reads the open-access text and checks the sources it cites.
Integrity signals
Registry
Cites
Statistics
Figures
Verification
Claims the paper makes
The claims and statistics of this paper haven’t been checked yet.
Run the check — free, no account needed. It reads the open-access text and checks the sources it cites.
Claims other papers make about this one
Each is checked against this paper’s own text: does it say what the citing paper says it does?
In the citing paper
“Furthermore, PanDerm also surpassed vision-language models such as CLIP36, MONET39 and biomedical-specific CLIP (BiomedCLIP)40 in benchmark evaluations (Supplementary Table 1)”
From A Multimodal Vision Foundation Model for Clinical Dermatology (2025) · cites this paper as [39]
In the citing paper
“CLIP-large outperformed biomedical-specific and dermatology-specific CLIP models”
From A Multimodal Vision Foundation Model for Clinical Dermatology (2025) · cites this paper as [39]
Self-check
Percentages, sums and reported differences re-computed from the paper’s own numbers.
The self-check needs the paper’s full text.
Citations
Cites
Deep Residual Learning for Image Recognition
He, K., Zhang, X., Ren, S., & Sun, J. (2016) · 2016 IEEE Conference on Computer Vision and Pattern Recognition (CVPR) · doi:10.1109/cvpr.2016.90 · Cited by 235,474
Scikit-learn: Machine Learning in Python
Pedregosa, F., Varoquaux, G., Gramfort, A., Michel, V., Thirion, B., Grisel, O., Blondel, M., Müller, A., Nothman, J., Louppe, G., et al. (2012) · arXiv · doi:10.48550/arxiv.1201.0490 · Cited by 71,016
ImageNet: A large-scale hierarchical image database
Deng, J., Dong, W., Socher, R., Li, L.-J., Li, K., & Fei-Fei, L. (2009) · 2009 IEEE Conference on Computer Vision and Pattern Recognition · doi:10.1109/cvpr.2009.5206848 · Cited by 65,333
Densely Connected Convolutional Networks
Huang, G., Liu, Z., Van Der Maaten, L., & Weinberger, K. Q. (2017) · 2017 IEEE Conference on Computer Vision and Pattern Recognition (CVPR) · doi:10.1109/cvpr.2017.243 · Cited by 48,566
Grad-CAM: Visual Explanations from Deep Networks via Gradient-Based Localization
Selvaraju, R. R., Cogswell, M., Das, A., Vedantam, R., Parikh, D., & Batra, D. (2017) · 2017 IEEE International Conference on Computer Vision (ICCV) · doi:10.1109/iccv.2017.74 · Cited by 24,513
Unpaired image-to-image translation using cycle-consistent adversarial networks
Zhu, J.-Y., Park, T., Isola, P., & Efros, A. A. (2017) · 2017 IEEE International Conference on Computer Vision (ICCV) · doi:10.1109/iccv.2017.244 · Cited by 23,602
Least squares quantization in PCM
Lloyd, S. (1982) · IEEE Transactions on Information Theory · doi:10.1109/tit.1982.1056489 · Cited by 15,836
Learning Transferable Visual Models From Natural Language Supervision
Radford, A., Kim, J. W., Hallacy, C., Ramesh, A., Goh, G., Agarwal, S., Sastry, G., Askell, A., Mishkin, P., Clark, J., et al. (2021) · arXiv · doi:10.48550/arxiv.2103.00020 · Cited by 15,293
Large Language Models Encode Clinical Knowledge
Singhal, K., Azizi, S., Tu, T., Mahdavi, S. S., Wei, J., Chung, H. W., Scales, N., Tanwani, A., Cole-Lewis, H., Pfohl, S., et al. (2022) · arXiv · doi:10.48550/arxiv.2212.13138 · Cited by 4,083
Large language models encode clinical knowledge
Singhal, K., Azizi, S., Tu, T., Mahdavi, S. S., Wei, J., Chung, H. W., Scales, N., Tanwani, A., Cole-Lewis, H., Pfohl, S., et al. (2023) · Nature · doi:10.1038/s41586-023-06291-2 · Cited by 4,083
Tschandl, P., Rosendahl, C., & Kittler, H. (2018) · Scientific Data · doi:10.1038/sdata.2018.161 · Cited by 3,628
Codella, N. C. F., Gutman, D., Celebi, M. E., Helba, B., Marchetti, M. A., Dusza, S. W., Kalloo, A., Liopyris, K., Mishra, N., Kittler, H., et al. (2018) · 2018 IEEE 15th International Symposium on Biomedical Imaging (ISBI 2018) · doi:10.1109/isbi.2018.8363547 · Cited by 2,620
Kim, B., Wattenberg, M., Gilmer, J., Cai, C., Wexler, J., Viegas, F., & Sayres, R. (2017) · arXiv · doi:10.48550/arxiv.1711.11279 · Cited by 1,240
Simulation physiologischer Regelkreise mit der objektorientierten Modellbibliothek “HumanLib”
Brunberg, A., Spillner, J. W., Autschbach, R., & Abel, D. (2011) · at - Automatisierungstechnik · doi:10.1524/auto.2011.0951 · Cited by 1,015
MedCLIP: Contrastive Learning from Unpaired Medical Images and Text
Wang, Z., Wu, Z., Agarwal, D., & Sun, J. (2022) · Conference on Empirical Methods in Natural Language Processing (EMNLP) · doi:10.18653/v1/2022.emnlp-main.256 · Cited by 1,011
PH2 - A dermoscopic image database for research and benchmarking
Mendonca, T., Ferreira, P. M., Marques, J. S., Marcal, A. R. S., & Rozeira, J. (2013) · 2013 35th Annual International Conference of the IEEE Engineering in Medicine and Biology Society (EMBC) · doi:10.1109/embc.2013.6610779 · Cited by 1,009
Codella, N., Rotemberg, V., Tschandl, P., Celebi, M. E., Dusza, S., Gutman, D., Helba, B., Kalloo, A., Liopyris, K., Marchetti, M., et al. (2019) · arXiv · doi:10.48550/arxiv.1902.03368 · Cited by 984
A visual–language foundation model for pathology image analysis using medical twitter
Huang, Z., Bianchi, F., Yuksekgonul, M., Montine, T. J., & Zou, J. (2023) · Nature Medicine · doi:10.1038/s41591-023-02504-3 · Cited by 693
AI for radiographic COVID-19 detection selects shortcuts over signal
DeGrave, A. J., Janizek, J. D., & Lee, S.-I. (2021) · Nature Machine Intelligence · doi:10.1038/s42256-021-00338-7 · Cited by 631
Self-citationA patient-centric dataset of images and metadata for identifying melanomas using clinical context
Rotemberg, V. M., Kurtansky, N. R., Betz‐Stablein, B., Caffery, L. J., Chousakos, E., Codella, N., Combalia, M., Dusza, S. W., Guitera, P., Gutman, D. A., et al. (2021) · Scientific Data · doi:10.1038/s41597-021-00815-z · Cited by 617
Seven-point checklist and skin lesion classification using multitask multimodal neural nets
Kawahara, J., Daneshvar, S., Argenziano, G., & Hamarneh, G. (2019) · IEEE Journal of Biomedical and Health Informatics · doi:10.1109/jbhi.2018.2824327 · Cited by 584
Disparities in dermatology AI performance on a diverse, curated clinical image set
Daneshjou, R., Vodrahalli, K., Novoa, R. A., Jenkins, M., Liang, W., Rotemberg, V., Ko, J., Swetter, S. M., Bailey, E. E., Gevaert, O., et al. (2022) · Science Advances · doi:10.1126/sciadv.abq6147 · Cited by 544
Self-citationOn the interpretability of artificial intelligence in radiology: challenges and opportunities
Reyes, M., Meier, R., Pereira, S., Silva, C. A., Dahlweid, F.-M., Tengg-Kobligk, H. V., Summers, R. M., & Wiest, R. (2020) · Radiology: Artificial Intelligence · doi:10.1148/ryai.2020190043 · Cited by 484
MURA: Large Dataset for Abnormality Detection in Musculoskeletal RadiographsPreprint
Rajpurkar, P., Irvin, J., Bagul, A., Ding, D. Y., Duan, T., Mehta, H., Yang, B., Zhu, K., Laird, D., Ball, R. L., et al. (2017) · arXiv (Cornell University) · doi:10.48550/arxiv.1712.06957 · Cited by 470
Health system-scale language models are all-purpose prediction engines
Jiang, L. Y., Liu, X. C., Nejatian, N. P., Nasir-Moin, M., Wang, D., Abidin, A., Eaton, K., Riina, H. A., Laufer, I., Punjabi, P., et al. (2023) · Nature · doi:10.1038/s41586-023-06160-y · Cited by 460
Tiu, E., Talius, E., Patel, P., Langlotz, C. P., Ng, A. Y., & Rajpurkar, P. (2022) · Nature Biomedical Engineering · doi:10.1038/s41551-022-00936-9 · Cited by 442
Feng, J., Phillips, R. V., Malenica, I., Bishara, A., Hubbard, A. E., Celi, L. A., & Pirracchio, R. (2022) · npj Digital Medicine · doi:10.1038/s41746-022-00611-y · Cited by 423
Hidden stratification causes clinically meaningful failures in machine learning for medical imaging
Oakden-Rayner, L., Dunnmon, J., Carneiro, G., & Re, C. (2020) · Proceedings of the ACM Conference on Health, Inference, and Learning · doi:10.1145/3368555.3384468 · Cited by 411
Daneshjou, R., Smith, M. P., Sun, M. D., Rotemberg, V., & Zou, J. (2021) · JAMA Dermatology · doi:10.1001/jamadermatol.2021.3129 · Cited by 403
Self-citationGeneral Multi-label Image Classification with Transformers
Lanchantin, J., Wang, T., Ordóñez, V., & Qi, Y. (2021) · IEEE Computer Society Conference on Computer Vision and Pattern Recognition/Proceedings - IEEE Computer Society Conference on Computer Vision and Pattern Recognition/Proceedings · doi:10.1109/cvpr46437.2021.01621 · Cited by 389
Agbai, O. N., Buster, K., Sanchez, M., Hernandez, C., Kundu, R. V., Chiu, M., Roberts, W. E., Draelos, Z. D., Bhushan, R., Taylor, S. C., et al. (2014) · Journal of the American Academy of Dermatology · doi:10.1016/j.jaad.2013.11.038 · Cited by 376
Winkler, J. K., Fink, C., Toberer, F., Enk, A., Deinlein, T., Hofmann-Wellenhof, R., Thomas, L., Lallas, A., Blum, A., Stolz, W., et al. (2019) · JAMA Dermatology · doi:10.1001/jamadermatol.2019.1735 · Cited by 365
Gutman, D. A., Codella, N., Celebi, E., Helba, B., Marchetti, M. A., Mishra, N. K., & Halpern, A. C. (2016) · arXiv (Cornell University) · doi:10.48550/arxiv.1605.01397 · Cited by 365
Assessing the trustworthiness of saliency maps for localizing abnormalities in medical imaging
Arun, N., Gaw, N., Singh, P., Chang, K., Aggarwal, M., Chen, B., Hoebel, K., Gupta, S., Patel, J., Gidwani, M., et al. (2021) · Radiology: Artificial Intelligence · doi:10.1148/ryai.2021200267 · Cited by 342
Koh, P. W., Nguyen, T., Tang, Y. S., Mussmann, S., Pierson, E., Kim, B., & Liang, P. (2020) · arXiv · doi:10.48550/arxiv.2007.04612 · Cited by 338
Analysis of the ISIC image datasets: Usage, benchmarks and recommendations
Cassidy, B., Kendrick, C., Brodzicki, A., Jaworek-Korjakowska, J., & Yap, M. H. (2022) · Medical Image Analysis · doi:10.1016/j.media.2021.102305 · Cited by 307
Representations of race and skin tone in medical textbook imagery
Louie, P., & Wilkes, R. (2018) · Social Science & Medicine · doi:10.1016/j.socscimed.2018.02.023 · Cited by 289
27th Annual International Conference of the IEEE Engineering in Medicine and Biology Society
(2005) · IEEE Transactions on NanoBioscience · doi:10.1109/tnb.2005.845677 · Cited by 288
Groh, M., Harris, C., Soenksen, L. R., Lau, F., Han, R., Kim, A., Koochek, A., & Badri, O. (2021) · IEEE/CVF Conference on Computer Vision and Pattern Recognition Workshops (CVPRW) · doi:10.1109/cvprw53098.2021.00201 · Cited by 275
Jones, O. T., Matin, R. N., van der Schaar, M., Prathivadi Bhayankaram, K., Ranmuthu, C. K. I., Islam, M. S., Behiyat, D., Boscott, R., Calanzani, N., Emery, J., et al. (2022) · The Lancet Digital Health · doi:10.1016/s2589-7500(22)00023-1 · Cited by 272
Continuous Learning AI in Radiology: Implementation Principles and Early Applications
Pianykh, O. S., Langs, G., Dewey, M., Enzmann, D. R., Herold, C. J., Schoenberg, S. O., & Brink, J. A. (2020) · Radiology · doi:10.1148/radiol.2020200038 · Cited by 237
ABCDE - an evolving concept in the early detection of melanoma
Rigel, D. S., Friedman, R. J., Kopf, A. W., & Polsky, D. (2005) · Archives of Dermatology · doi:10.1001/archderm.141.8.1032 · Cited by 189
Training confounder-free deep learning models for medical applications
Zhao, Q., Adeli, E., & Pohl, K. M. (2020) · Nature Communications · doi:10.1038/s41467-020-19784-9 · Cited by 160
Combalia, M., Codella, N., Rotemberg, V. M., Carrera, C., Dusza, S. W., Gutman, D. A., Helba, B., Kittler, H., Kurtansky, N. R., Liopyris, K., et al. (2022) · The Lancet Digital Health · doi:10.1016/s2589-7500(22)00021-8 · Cited by 154
Automated Dermatological Diagnosis: Hype or Reality?
Navarrete-Dechent, C., Dusza, S. W., Liopyris, K., Marghoob, A. A., Halpern, A. C., & Marchetti, M. A. (2018) · Journal of Investigative Dermatology · doi:10.1016/j.jid.2018.04.040 · Cited by 129
A framework for the oversight and local deployment of safe and high-quality prediction models
Bedoya, A. D., Economou-Zavlanos, N. J., Goldstein, B. A., Young, A., Jelovsek, J. E., O’Brien, C., Parrish, A. B., Elengold, S., Lytle, K., Balu, S., et al. (2022) · Journal of the American Medical Informatics Association · doi:10.1093/jamia/ocac078 · Cited by 119 · cited 1×
“We envision that MONET will impact the clinical deployment and monitoring of medical image AI systems by enabling more thorough auditing 63–65 .”
Domino: Discovering Systematic Errors with Cross-Modal EmbeddingsPreprint
Eyuboglu, S., Varma, M., Saab, K. K., Delbrouck, J.-B., Lee‐Messer, C., Dunnmon, J., Zou, J., & Ré, C. (2022) · arXiv (Cornell University) · doi:10.48550/arxiv.2203.14960 · Cited by 110
Absence of images of skin of colour in publications of COVID‐19 skin manifestations
Lester, J., Jia, J. L., Zhang, L., Okoye, G. A., & Linos, E. (2020) · British Journal of Dermatology · doi:10.1111/bjd.19258 · Cited by 99
Continual learning in medical devices: FDA's action plan and beyond
Vokinger, K. N., Feuerriegel, S., & Kesselheim, A. S. (2021) · The Lancet Digital Health · doi:10.1016/s2589-7500(21)00076-5 · Cited by 95
(De) Constructing Bias on Skin Lesion Datasets
Bissoto, A. E., Fornaciali, M. S., Junior, E. A. D. V., & Avila, S. (2019) · IEEE/CVF Conference on Computer Vision and Pattern Recognition Workshops (CVPRW) · doi:10.1109/cvprw.2019.00335 · Cited by 89
Marchetti, M. A., Cowen, E. A., Kurtansky, N. R., Weber, J., Dauscher, M., DeFazio, J., Deng, L., Dusza, S. W., Haliasos, H. C., Halpern, A. C., et al. (2023) · npj Digital Medicine · doi:10.1038/s41746-023-00872-1 · Cited by 89
Groh, M., Harris, C., Daneshjou, R., Badri, O., & Koochek, A. (2022) · Proceedings of the ACM on Human-Computer Interaction · doi:10.1145/3555634 · Cited by 82
Self-citationMultiple Instance Captioning: Learning Representations from Histopathology Textbooks and Articles
Gamper, J., & Rajpoot, N. (2021) · 2021 IEEE/CVF Conference on Computer Vision and Pattern Recognition (CVPR) · doi:10.1109/cvpr46437.2021.01628 · Cited by 75
DeGrave, A. J., Cai, Z. R., Janizek, J. D., Daneshjou, R., & Lee, S. (2023) · Nature Biomedical Engineering · doi:10.1038/s41551-023-01160-9 · Cited by 71
Self-citationInterpreting Deep Learning Models in Natural Language Processing: A ReviewPreprint
Sun, X., Yang, D., Li, X., Zhang, T., Meng, Y., Qiu, H., Wang, G., Hovy, E. H., & Li, J. (2021) · arXiv (Cornell University) · doi:10.48550/arxiv.2110.10470 · Cited by 64
Corbin, C. K., Maclay, R., Acharya, A., Mony, S., Punnathanam, S., Thapa, R., Kotecha, N., Shah, N. H., & Chen, J. H. (2023) · Journal of the American Medical Informatics Association · doi:10.1093/jamia/ocad114 · Cited by 64
A Picture of Modern Medicine: Race and Visual Representation in Medical Literature
Massie, J. P., Cho, D., Kneib, C. J., Sousa, J. D., Morrison, S. D., & Friedrich, J. B. (2020) · Journal of the National Medical Association · doi:10.1016/j.jnma.2020.07.013 · Cited by 60
Automated Data Slicing for Model Validation: A Big Data - AI Integration Approach
Chung, Y., Kraska, T., Polyzotis, N., Tae, K. H., & Whang, S. E. (2019) · IEEE Transactions on Knowledge and Data Engineering · doi:10.1109/tkde.2019.2916074 · Cited by 55
Patient Representation in Medical Literature: Are We Appropriately Depicting Diversity?
Massie, J. P., Cho, D., Kneib, C., Burns, J. R., Crowe, C., Lane, M. E., Shakir, A., Sobol, D., Sabin, J., Sousa, J. D., et al. (2019) · Plastic and Reconstructive Surgery, Global Open · doi:10.1097/gox.0000000000002563 · Cited by 55
Lara, M. A. R., Kowalczuk, M. V. R., Eliceche, M. L., Ferraresso, M. G., Luna, D. R., Benítez, S., & Mazzuoccolo, L. D. (2023) · Scientific Data · doi:10.1038/s41597-023-02630-0 · Cited by 40
An adversarial approach for the robust classification of pneumonia from chest radiographs
Janizek, J. D., Erion, G., DeGrave, A. J., & Lee, S. (2020) · ACM Conference on Health, Inference, and Learning (CHIL) · doi:10.1145/3368555.3384458 · Cited by 35
Self-citationMulticlass Artificial Intelligence in Dermatology: Progress but Still Room for Improvement
Navarrete‐Dechent, C., Liopyris, K., & Marchetti, M. A. (2020) · Journal of Investigative Dermatology · doi:10.1016/j.jid.2020.06.040 · Cited by 29
Leveraging medical Twitter to build a visual–language foundation model for pathology AIPreprint
Huang, Z., Bianchi, F., Yüksekgönül, M., Montine, T. J., & Zou, J. (2023) · bioRxiv (Cold Spring Harbor Laboratory) · doi:10.1101/2023.03.29.534834 · Cited by 27
Leming, M., Das, S., & Im, H. (2022) · Artificial Intelligence in Medicine · doi:10.1016/j.artmed.2022.102309 · Cited by 20
Automatic Concept Extraction for Concept Bottleneck-based Video ClassificationPreprint
Jeyakumar, J. V., Dickens, L., Garcia, L. A., Cheng, Y.-H., Echavarria, D. R., Noor, J., Russo, A., Kaplan, L., Blasch, E., & Srivastava, M. B. (2022) · arXiv (Cornell University) · doi:10.48550/arxiv.2206.10129 · Cited by 14
Dissection of medical AI reasoning processes via physician and generative-AI collaborationPreprint
DeGrave, A. J., Cai, Z. R., Janizek, J. D., Daneshjou, R., & Lee, S. (2023) · medRxiv · doi:10.1101/2023.05.12.23289878 · Cited by 14
Self-citationHan, S. S., Navarrete‐Dechent, C., Liopyris, K., Kim, M. S., Park, G. H., Woo, S. S., Park, J., Shin, J. W., Kim, B. R., Kim, M. J., et al. (2022) · Scientific Reports · doi:10.1038/s41598-022-20632-7 · Cited by 13
Sierro, T. J., Blumenthal, L. Y., Hekmatjah, J., Chat, V. S., Kassardjian, A., Read, C., & Armstrong, A. W. (2021) · Journal of the American Academy of Dermatology · doi:10.1016/j.jaad.2021.07.005 · Cited by 11
Multiview Concept Bottleneck Models Applied to Diagnosing Pediatric Appendicitis
Klimiene, U., Marcinkevičs, R., Wolfertstetter, P. R., Özkan, E., Paschke, A., Niederberger, D., Wellmann, S., Knorr, C., & Vogt, J. E. (2022) · Repository for Publications and Research Data (ETH Zurich) · doi:10.3929/ethz-b-000560075 · Cited by 3
Corbin, C. K., Maclay, R., Acharya, A., et al. (2023) · arXiv (Cornell University) · doi:10.48550/arxiv.2303.06269 · Cited by 2
Consecutive biopsies for melanoma across year 2020
Memorial Sloan Kettering Cancer Center (2022) · ISIC Archive · doi:10.34970/151324 · Cited by 1
Research works printed but not linked: 16
- Daneshjou, R., Yuksekgonul, M., Cai, Z. R., Novoa, R. & Zou, J. Y. SkinCon: a skin disease dataset densely annotated by domain experts for fine-grained debugging and analysis. In Advances in Neural Information Processing Systems (eds Koyejo, S. et al.) 18157–18167 (Curran Associates, Inc., 2022).
- Combalia, M. et al. BCN20000: dermoscopic lesions in the wild. Preprint at https://arxiv.org/abs/1908.02288 (2019). · arXiv
- Singh, C., Balakrishnan, G. & Perona, P. Matched sample selection with GANs for mitigating attribute confounding. Preprint at https://arxiv.org/abs/2103.13455 (2021). · arXiv
- Goel, K., Gu, A., Li, Y. & Ré, C. Model patching: closing the subgroup performance gap with data augmentation. In 9th International Conference on Learning Representations (ICLR, 2021); https://openreview.net/forum?id=9YlaeLfuhJF
- Sagawa, S., Koh, P. W., Hashimoto, T. B. & Liang, P. Distributionally robust neural networks. In International Conference on Learning Representations (ICLR, 2020); https://dblp.org/rec/conf/iclr/SagawaKHL20.html?view=bibtex
- Lundberg, S. M. & Lee, S.-I. A unified approach to interpreting model predictions. In Proc. 31st International Conference on Neural Information Processing Systems (eds Guyon, I. et al.) 4768–4777 (Curran Associates Inc., 2017).
- Sundararajan, M., Taly, A. & Yan, Q. Axiomatic attribution for deep networks. In Proc. 34th International Conference on Machine Learning (eds Precup, D. & Teh, Y. W.) 3319–3328 (PMLR, 2017).
- Crabbé, J. & van der Schaar, M. Concept activation regions: a generalized framework for concept-based explanations. In Advances in Neural Information Processing Systems (eds Koyejo, S. et al.) 2590–2607 (Curran Associates Inc., 2022).
- Abid, A., Yuksekgonul, M. & Zou, J. Meaningfully debugging model mistakes using conceptual counterfactual explanations. In Proc. 39th International Conference on Machine Learning (eds Chaudhuri, K. et al.) 66–68 (PMLR, 2022).
- Yuksekgonul, M., Wang, M. & Zou, J. Post-hoc concept bottleneck models. In The Eleventh International Conference on Learning Representations (ICLR, 2023); https://dblp.org/rec/conf/iclr/YuksekgonulW023.html?view=bibtex
- PMC Open Access Subset. National Library of Medicine www.ncbi.nlm.nih.gov/pmc/tools/openftlist (2022).
- Tan, M. & Le, Q. V. EfficientNetV2: smaller models and faster training. In Proc. 38th International Conference on Machine Learning, ICML 2021 (eds Meila, M. & Zhang, T.) 10096–10106 (PMLR, 2021).
- Dosovitskiy, A. et al. An image is worth 16 × 16 words: transformers for image recognition at scale. In 9th International Conference on Learning Representations, ICLR 2021 (ICLR, 2021); https://openreview.net/forum?id=YicbFdNTTy
- Sennrich, R., Haddow, B. & Birch, A. Neural machine translation of rare words with subword units. In Proc. 54th Annual Meeting of the Association for Computational Linguistics, Vol. 1: Long Papers 1715–1725 (Association for Computational Linguistics, 2016). · DOI · Paper page
- Kingma, D. P. & Ba, J. Adam: A method for stochastic optimization. In 3rd International Conference on Learning Representations, ICLR 2015 (eds Bengio, Y. & LeCun, Y.) (ICLR, 2015).
- Wu, C., Parbhoo, S., Havasi, M. & Doshi-Velez, F. Learning optimal summaries of clinical time-series with concept bottleneck models. In Proc. 7th Machine Learning for Healthcare Conference (eds Lipton, Z. C. et al.) 648–672 (PMLR, 2022).
Cited by
Sorted by citations
A Vision-Language Foundation Model for Precision Oncology
Xiang, J., Wang, X., Zhang, X., Xi, Y., Eweje, F., Chen, Y., Li, Y., Bergstrom, C., Gopaulchan, M., Kim, T., et al. (2025) · Nature · doi:10.1038/s41586-024-08378-w · Cited by 256
CLIP in medical imaging: A survey
Zhao, Z., Liu, Y., Wu, H., Wang, M., Li, Y., Wang, S., Teng, L., Liu, D., Cui, Z., Wang, Q., et al. (2025) · Medical Image Analysis · doi:10.1016/j.media.2025.103551 · Cited by 248
A Multimodal Vision Foundation Model for Clinical Dermatology
Yan, S., Yu, Z., Primiero, C., Vico-Alonso, C., Wang, Z., Yang, L., Tschandl, P., Hu, M., Ju, L., Tan, G., et al. (2025) · Nature Medicine · doi:10.1038/s41591-025-03747-y · Cited by 117
“Furthermore, PanDerm also surpassed vision-language models such as CLIP 36 , MONET 39 and biomedical-specific CLIP (BiomedCLIP) 40 in benchmark evaluations (Supplementary Table 1), while showing emergent capabilities in dermatology similar to those of DINOv2 in natural images, with linear probing performance comparabl…”
Digital twins as global learning health and disease models for preventive and personalized medicine
Li, X., Loscalzo, J., Mahmud, A. K. M. F., Aly, D. M., Rzhetsky, A., Žitnik, M., & Benson, M. (2025) · Genome Medicine · doi:10.1186/s13073-025-01435-7 · Cited by 135
Principles, applications, and future of artificial intelligence in dermatology
Omiye, J. A., Gui, H., Daneshjou, R., Cai, Z. R., & Muralidharan, V. (2023) · Frontiers in Medicine · doi:10.3389/fmed.2023.1278232 · Cited by 87
Self-citation
Metadata
- Authors
- Kim, C., Gadgil, S. U., DeGrave, A. J., Omiye, J. A., Cai, Z. R., Daneshjou, R., & Lee, S.-I.
- Affiliations
- University of Washington (US)
- Stanford Medicine (US)
- Stanford University (US)
- Corresponding author
- Daneshjou, Roxana
- Lee, Su-In
- ORCID
- Venue
- Nature Medicine
- Published
- 2024-04
- Volume
- 30
- Issue
- 4
- Pages
- 1154-1165
- ISSN
- 1078-8956 (ISSN-L)
- 1546-170X
- PMC
- PMC10312868
- OpenAlex
- W4394832225
- Cited by
- 125
- References
- 72
- Citations by year
- 2026: 48 · 2025: 50 · 2024: 25
- FWCI
- 11.52
- Type
- journal article
- Language
- en
- Open access
- hybrid
- doi.org
- Licence
- Locations
- Nature Medicine (publishedVersion, cc-by)
- medRxiv (acceptedVersion, cc-by-nc)
- PubMed (publishedVersion)
- PubMed Central (submittedVersion, cc-by-nc)
- Funders
- National Science Foundation (DBI-1552309, DBI-1759487)
- U.S. Department of Health & Human Services | National Institutes of Health (R01 AG061132, R35 GM 128638, 5T32 AR007422-38, AR007422-38)
- Topics
- Health Sciences › Medicine › Health Informatics › Artificial Intelligence in Healthcare and Education
- Physical Sciences › Computer Science › Artificial Intelligence › Explainable Artificial Intelligence (XAI)
- Physical Sciences › Computer Science › Computer Vision and Pattern Recognition › Multimodal Machine Learning Applications
- Keywords
- vision-language models, medical literature, dermatological images, model auditing, data auditing, model interpretability, AI transparency, self-supervised learning
About these checks
Registry, retraction, Cites and statistics results are computed, not judged, with one exception: a printed reference that no index lists is read once by a model before it counts as a citation error. Claims are extracted by a model and kept only when their quote appears verbatim in the text; each cited source is then checked, with a model’s help, for whether it says what the claim relies on. Those verdicts can be wrong — read the claim’s quote and the cited source before relying on one.
Statistics and arithmetic are recomputed, not judged.
Confidence bands are shown only for fields calibrated on our annotated test set. None is calibrated yet, so no band is shown.
What counts as a claim ›How we measure confidence ›How we check this ›
Are you an author, or do you see a problem with this page? Request a review
