

The DOI matches its Crossref record; 48 of the 49 references it cites were found in a registry or an index.
Nucleus segmentation across imaging experiments: the 2018 Data Science Bowl
Open accessAbstract
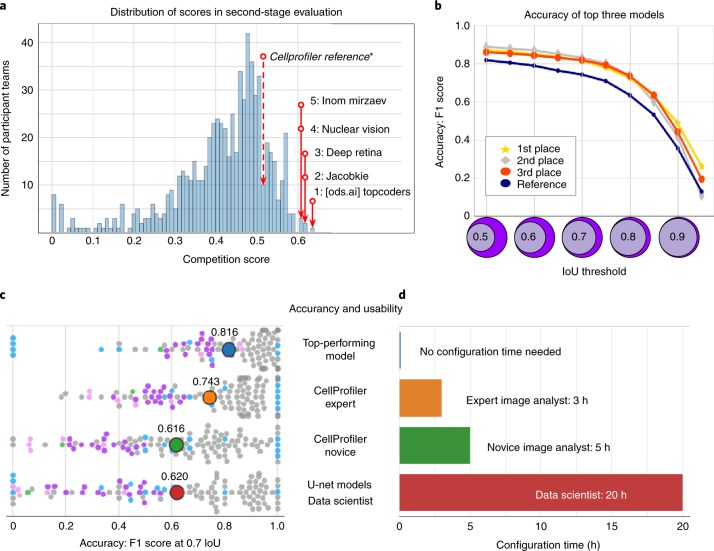
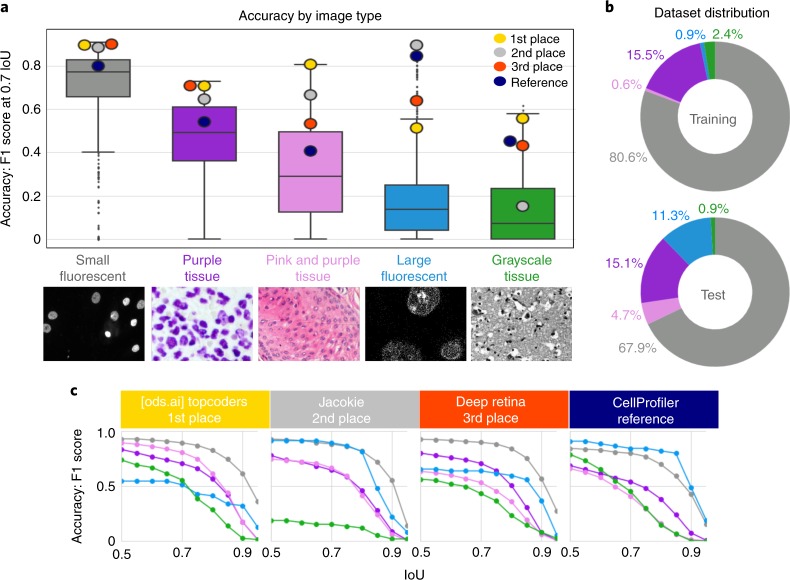
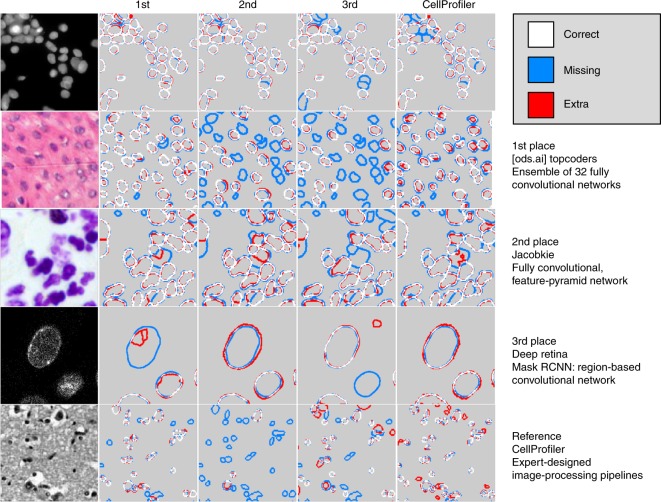
Segmenting the nuclei of cells in microscopy images is often the first step in the quantitative analysis of imaging data for biological and biomedical applications. Many bioimage analysis tools can segment nuclei in images but need to be selected and configured for every experiment. The 2018 Data Science Bowl attracted 3,891 teams worldwide to make the first attempt to build a segmentation method that could be applied to any two-dimensional light microscopy image of stained nuclei across experiments, with no human interaction. Top participants in the challenge succeeded in this task, developing deep-learning-based models that identified cell nuclei across many image types and experimental conditions without the need to manually adjust segmentation parameters. This represents an important step toward configuration-free bioimage analysis software tools.
Overview
The claims and statistics of this paper haven’t been checked yet.
Run the check — free, no account needed. It reads the open-access text and checks the sources it cites.
Integrity signals
Registry
Cites
Statistics
Figures
Verification
Claims the paper makes
The claims and statistics of this paper haven’t been checked yet.
Run the check — free, no account needed. It reads the open-access text and checks the sources it cites.
Claims other papers make about this one
Each is checked against this paper’s own text: does it say what the citing paper says it does?
The source backs part of the claim, not all of it — or backs it for a different population, condition or comparison.
In the citing paper
“However, we did not see an improvement for the ensemble of models compared to the generalist model (Extended Data Fig. 2), consistent with the results of ref. 27.”
From Cellpose 2.0: how to train your own model (2022) · cites this paper as [27]
Experimental — accuracy not yet measuredThe cited source says what the claim attributes to it.
In the citing paper
“Finally, we point out that the LiveCell study used a different average precision score from ours, which additionally requires a confidence score per ROI, while we used the average precision formulation from the Data Science Bowl challenge and other studies12,27,35.”
From Cellpose 2.0: how to train your own model (2022) · cites this paper as [27]
Self-check
Percentages, sums and reported differences re-computed from the paper’s own numbers.
The self-check needs the paper’s full text.
Citations
Cites
Deep Residual Learning for Image Recognition
He, K., Zhang, X., Ren, S., & Sun, J. (2016) · 2016 IEEE Conference on Computer Vision and Pattern Recognition (CVPR) · doi:10.1109/cvpr.2016.90 · Cited by 235,474
U-Net: Convolutional Networks for Biomedical Image Segmentation
Ronneberger, O., Fischer, P., & Brox, T. (2015) · Lecture notes in computer science · doi:10.1007/978-3-319-24574-4_28 · Cited by 99,404
LeCun, Y., Bengio, Y., & Hinton, G. (2015) · Nature · doi:10.1038/nature14539 · Cited by 84,126
Fiji: an open-source platform for biological-image analysis
Schindelin, J., Arganda-Carreras, I., Frise, E., Kaynig, V., Longair, M., Pietzsch, T., Preibisch, S., Rueden, C., Saalfeld, S., Schmid, B., et al. (2012) · Nature Methods · doi:10.1038/nmeth.2019 · Cited by 66,890
Microsoft COCO: Common Objects in Context
Lin, T.-Y., Maire, M., Belongie, S., Hays, J., Perona, P., Ramanan, D., Dollár, P., & Zitnick, C. L. (2014) · Lecture Notes in Computer Science · doi:10.1007/978-3-319-10602-1_48 · Cited by 45,460
A Threshold Selection Method from Gray-Level Histograms
Otsu, N. (1979) · IEEE Transactions on Systems, Man and Cybernetics · doi:10.1109/tsmc.1979.4310076 · Cited by 44,708
ImageNet Large Scale Visual Recognition Challenge
Russakovsky, O., Deng, J., Su, H., Krause, J., Satheesh, S., Ma, S., Huang, Z., Karpathy, A., Khosla, A., Bernstein, M., et al. (2015) · International Journal of Computer Vision · doi:10.1007/s11263-015-0816-y · Cited by 39,380
Feature Pyramid Networks for Object Detection
Lin, T.-Y., Dollar, P., Girshick, R., He, K., Hariharan, B., & Belongie, S. (2017) · 2017 IEEE Conference on Computer Vision and Pattern Recognition (CVPR) · doi:10.1109/cvpr.2017.106 · Cited by 30,939
He, K., Gkioxari, G., Dollar, P., & Girshick, R. (2017) · 2017 IEEE International Conference on Computer Vision (ICCV) · doi:10.1109/iccv.2017.322 · Cited by 29,137
Unpaired image-to-image translation using cycle-consistent adversarial networks
Zhu, J.-Y., Park, T., Isola, P., & Efros, A. A. (2017) · 2017 IEEE International Conference on Computer Vision (ICCV) · doi:10.1109/iccv.2017.244 · Cited by 23,602
Research works printed but not linked: 3
- Hollandi, R. et al. A deep learning framework for nucleus segmentation using image style transfer. Preprint at bioRxiv https://doi.org/10.1101/580605 (2019). · DOI
- Bolukbasi, T., Chang, K.-W., Zou, J. Y., Saligrama, V. & Kalai, A. T. in Advances in Neural Information Processing Systems (eds Lee, D. D. et al.) 4349–4357 (papers.nips.cc, 2016).
- Ren, S., He, K., Girshick, R. & Sun, J. in Advances in Neural Information Processing Systems 28 (eds. Cortes, C. et al.) 91–99 (Curran Associates, 2015).
Cited by
Sorted by citations
Items 401–500 of 811
Yücel, Z., Akal, F., & Oltulu, P. (2024) · Medical & Biological Engineering & Computing · doi:10.1007/s11517-024-03045-8 · Cited by 7
Improved Segmentation of Cellular Nuclei Using UNET Architectures for Enhanced Pathology Imaging
Castro, S., Pereira, V., & Silva, R. (2024) · Electronics · doi:10.3390/electronics13163335 · Cited by 6
Vadori, V., Graïc, J., Peruffo, A., Vadori, G., Finos, L., & Grisan, E. (2025) · Computers in Biology and Medicine · doi:10.1016/j.compbiomed.2025.111018 · Cited by 12
Tatout, C., Mougeot, G., Parry, G., Baroux, C., Pradillo, M., & Evans, D. E. (2022) · Journal of Experimental Botany · doi:10.1093/jxb/erac005 · Cited by 6
STAGETOOL, a Novel Automated Approach for Mouse Testis Histological Analysis
Meikar, O., Majoral, D., Heikkinen, O., Valkama, E., Leskinen, S., Rebane, A., Ruusuvuori, P., Toppari, J., Mäkelä, J., & Kotaja, N. (2022) · Endocrinology · doi:10.1210/endocr/bqac202 · Cited by 6
Mou, T., Liang, J., Vu, T. N., Tian, M., & Gao, Y. (2023) · Sensors · doi:10.3390/s23031432 · Cited by 6
U-Net_dc: A Novel U-Net-Based Model for Endometrial Cancer Cell Image Segmentation
Ji, Z., Yao, D., Chen, R., Lyu, T., Liao, Q., Zhao, L. Y., & Ганчев, И. (2023) · Information · doi:10.3390/info14070366 · Cited by 6
Nartova, A. V., Matveev, A. V., Mashukov, M. Y., Belotserkovskii, V. A., Sankova, N. N., Kudinov, V. Y., & Okunev, A. G. (2023) · Kinetics and Catalysis · doi:10.1134/s0023158423040092 · Cited by 6
Wu, H., Niyogisubizo, J., Zhao, K., Meng, J., Xi, W., Li, H., Pan, Y. F., & Wei, Y. (2023) · International Journal of Molecular Sciences · doi:10.3390/ijms242216028 · Cited by 6
Zheng, W., Chen, J., Zhang, K., Yan, J., Wang, J., Cheng, Y., Du, B., Chen, D. Z., Gao, H., Wu, J., et al. (2023) · IEEE Journal of Biomedical and Health Informatics · doi:10.1109/jbhi.2023.3341699 · Cited by 6
Optimizing deep learning-based segmentation of densely packed cells using cell surface markers
Han, S., Phasouk, K., Zhu, J., & Fong, Y. (2024) · BMC Medical Informatics and Decision Making · doi:10.1186/s12911-024-02502-6 · Cited by 12
Predicting Rotator Cuff Tear Severity Using Radiographic Images and Machine Learning Techniques
Cho, Y., Jalics, A., Lv, D., Gilbert, M., Dickson, K., Chen, D., Nguyen, T., Joines, H., Kakos, B., Chen, C., et al. (2021) · International Conference on Computing and Pattern Recognition (ICCPR) · doi:10.1145/3497623.3497661 · Cited by 6
Joint Learning with Local and Global Consistency for Improved Medical Image Segmentation
Ahamed, M. A., & Imran, A.-A.-Z. (2022) · Lecture notes in computer science · doi:10.1007/978-3-031-12053-4_23 · Cited by 6
The STOIC2021 COVID-19 AI challenge: Applying reusable training methodologies to private data
Boulogne, L., Lorenz, J., Kienzle, D., Schön, R., Ludwig, K., Lienhart, R. W., Jégou, S., Li, G., Chen, C., Wang, Q., et al. (2024) · Medical Image Analysis · doi:10.1016/j.media.2024.103230 · Cited by 7
Render U-Net: A Unique Perspective on Render to Explore Accurate Medical Image Segmentation
Li, C., Chen, W. R., & Tan, Y. (2020) · Applied Sciences · doi:10.3390/app10186439 · Cited by 6
ImPartial: Partial Annotations for Cell Instance SegmentationPreprint
Martinez, N., Sapiro, G., Tannenbaum, A., Hollmann, T. J., & Nadeem, S. (2021) · bioRxiv (Cold Spring Harbor Laboratory) · doi:10.1101/2021.01.20.427458 · Cited by 6
Image-based identification and isolation of micronucleated cells to dissect cellular consequencesPreprint
DiPeso, L., Pendyala, S., Huang, H. Z., Fowler, D. M., & Hatch, E. M. (2024) · eLife · doi:10.7554/elife.101579 · Cited by 6
Alenezi, A., Mayya, A. M., Alajmi, M., Almutairi, W., Alaradah, D., & Alhamad, H. (2024) · Diagnostics · doi:10.3390/diagnostics14242865 · Cited by 6
Du, X., Li, Y., Song, J., Zhang, Z., Zhang, J., Li, Y., Chen, Z., & Gu, Z. (2025) · Bio-Design and Manufacturing · doi:10.1631/bdm.2500119 · Cited by 5
Goyal, V., Schaub, N. J., Voss, T. C., & Hotaling, N. A. (2023) · BMC Bioinformatics · doi:10.1186/s12859-023-05486-8 · Cited by 6
Automated counting of Drosophila imaginal disc cell nuclei
Bosch, P. S., & Axelrod, J. D. (2024) · Biology Open · doi:10.1242/bio.060254 · Cited by 5
Kang, Y., Cheng, S., Guo, L., Zheng, C., & Zhao, J. (2024) · IEEE Access · doi:10.1109/access.2024.3457823 · Cited by 5
Huang, J., Luo, Y., Guo, Y., Li, W., Wang, Z., Liu, G., & Yang, G. (2024) · Bioinformatics · doi:10.1093/bioinformatics/btae559 · Cited by 5
Xia, B., Zhan, B., Shen, M., & Yang, H. (2024) · Knowledge-Based Systems · doi:10.1016/j.knosys.2024.112707 · Cited by 5
Inverse Evolution Layers: Physics-Informed Regularizers for Image Segmentation
Liu, C., Qiao, Z., Li, C., & Schönlieb, C. (2025) · SIAM Journal on Mathematics of Data Science · doi:10.1137/24m1633662 · Cited by 9
Segment Anything for Dendrites from Electron Microscopy
Zhuo, Z., Belevich, I. N., Leinonen, V., Jokitalo, E., Malm, T., Sierra, A., & Tohka, J. (2025) · IEEE International Conference on Image Processing, Applications and Systems (IPAS) · doi:10.1109/ipas63548.2025.10924514 · Cited by 5
Wazir, S., & Kim, D. (2025) · Lecture notes in electrical engineering · doi:10.1007/978-981-96-3863-5_17 · Cited by 5
High-throughput single cell motility analysis using nanowell-in-microwells
Deng, P., Lyu, W., Jang, D., Matthews, K., Duffy, S. P., & Ma, H. (2025) · Lab on a Chip · doi:10.1039/d5lc00478k · Cited by 5
Haladik, B., Maurer‐Granofszky, M., Zoescher, P., Heredia, R. J., Frohne, A., Segarra‐Roca, A., Casey, C., Kartnig, F., Giuliani, S., Rashkova, C., et al. (2025) · Cell Reports Medicine · doi:10.1016/j.xcrm.2025.102304 · Cited by 5
Cascaded 3-Stage Nuclei Segmentation Using U-net, Faster-RCNN and SegNet for Higher Precision
Shihavuddin, A., Kiron, M. K., Islam, M. I., Maruf, M. H., Ashique, R. H., & Kabir, S. M. (2021) · International Conference on Sustainable Technologies for Industry 5.0 (STI) · doi:10.1109/sti53101.2021.9732598 · Cited by 5
Vivek, T. V. S., Naureen, A., Ashraf, M. S., Manna, S., Buttar, A. M., Muneeshwari, P., & Ahmad, M. W. (2022) · Computational Intelligence and Neuroscience · doi:10.1155/2022/3531308 · Cited by 5
Impact of Annotation Noise on Histopathology Nucleus Segmentation
Schilling, M. P., Ahuja, N., Rettenberger, L., Scherr, T., & Reischl, M. (2022) · Current Directions in Biomedical Engineering · doi:10.1515/cdbme-2022-1051 · Cited by 5
Nuclei-Net: a multi-stage fusion model for nuclei segmentation in microscopy images
Roy, K., Saha, S., Banik, D., & Bhattacharjee, D. (2023) · Innovations in Systems and Software Engineering · doi:10.1007/s11334-023-00537-y · Cited by 5
An Instance Segmentation Dataset of Yeast Cells in Microstructures
Reich, C., Prangemeier, T., Françani, A. O., & Koeppl, H. (2023) · Annual International Conference of the IEEE Engineering in Medicine and Biology Society (EMBC) · doi:10.1109/embc40787.2023.10340268 · Cited by 5
Unsupervised deep learning of foreground objects from low-rank and sparse dataset
Takeda, K., & Sakai, T. (2024) · Computer Vision and Image Understanding · doi:10.1016/j.cviu.2024.103939 · Cited by 5
SAC UW-Net: A self-attention-based network for multimodal medical image segmentation
Pal, D., Meena, T., Mahapatra, D., & Roy, S. S. (2024) · IEEE International Symposium on Biomedical Imaging (ISBI) · doi:10.1109/isbi56570.2024.10635611 · Cited by 5
Magdy, A., Ismail, K. N., Mohamed, M. H., Hassaballah, M., Mahmoud, H., & Abdelsamea, M. M. (2024) · IEEE Access · doi:10.1109/access.2024.3475877 · Cited by 5
DA-Net: Deep attention network for biomedical image segmentation
Gu, Y., Wang, Y., Ye, H., & Shu, X. (2025) · Signal Processing Image Communication · doi:10.1016/j.image.2025.117283 · Cited by 5
FASTER R-CNN for cell counting in low contrast microscopic images
Uka, A., Tare, A., Polisi, X., & Panci, I. (2020) · International Conference on Computing, Networking, Telecommunications & Engineering Sciences Applications (CoNTESA) · doi:10.1109/contesa50436.2020.9302852 · Cited by 5
Segmentation of Microscope Erythrocyte Images by CNN-Enhanced Algorithms
Buczkowski, M., Szymkowski, P., & Saeed, K. (2021) · Sensors · doi:10.3390/s21051720 · Cited by 5
Information Flow Through U-Nets
Lee, S., & Bajić, I. V. (2021) · IEEE International Symposium on Biomedical Imaging (ISBI) · doi:10.1109/isbi48211.2021.9433801 · Cited by 5
Cardoen, B., Wong, T., Alan, P., Lee, S., Matsubara, J. A., Nabi, I. R., & Hamarneh, G. (2022) · PLoS ONE · doi:10.1371/journal.pone.0276726 · Cited by 5
Image-based Cell Phenotyping Using Deep LearningPreprint
Berryman, S. G., Matthews, K., Lee, J. H., Duffy, S. P., & Ma, H. (2019) · bioRxiv (Cold Spring Harbor Laboratory) · doi:10.1101/817544 · Cited by 5
SEG: Segmentation Evaluation in absence of Ground truth labelsPreprint
Sims, Z., Strgar, L., Thirumalaisamy, D., Heussner, R. T., Thibault, G., & Chang, Y. H. (2023) · bioRxiv (Cold Spring Harbor Laboratory) · doi:10.1101/2023.02.23.529809 · Cited by 8
Mair, D., Witz, G., do Prado, A. H., Garefalakis, P., & Schlunegger, F. (2023) · doi:10.31223/x51h31 · Cited by 4
Benchmarking cellular segmentation methods against CellposePreprint
Stringer, C., & Pachitariu, M. (2024) · bioRxiv (Cold Spring Harbor Laboratory) · doi:10.1101/2024.04.06.587952 · Cited by 9
A method of nucleus image segmentation and counting based on TC-UNet++ and distance watershed
Zheng, K., Pan, J., Jia, Z., Xiao, S., Tao, W., Zhang, D., Li, Q., & Pan, L. (2024) · Medical Engineering & Physics · doi:10.1016/j.medengphy.2024.104244 · Cited by 4
Molina-Moreno, M., Schilling, M. P., Reischl, M., & Mikut, R. (2025) · IEEE Access · doi:10.1109/access.2025.3555020 · Cited by 4
MHS U-Net: Multi-scale hybrid subtraction network for medical image segmentation
Qian, J., Li, H., Liao, S., Xiao, Z., Li, W., & Li, H. (2025) · Computers in Biology and Medicine · doi:10.1016/j.compbiomed.2025.110431 · Cited by 4
Improving the performance of medical image segmentation with instructive feature learning
Dai, D., Dong, C., Huang, H., Liu, F., Li, Z., & Xu, S. (2025) · Medical Image Analysis · doi:10.1016/j.media.2025.103818 · Cited by 4
Representation learning enables robust single cell phenotyping in whole slide liquid biopsy imaging
Naghdloo, A., Tessone, D., Nagaraju, R. M., Zhang, B., Kang, J., Li, S., Oberai, A. A., Hicks, J. B., & Kühn, P. (2025) · Scientific Reports · doi:10.1038/s41598-025-20514-8 · Cited by 4
Spatial self-organization of cancer stem cell niches revealed by live single-cell imaging
Brulé, M., Horochowska, A., Fontaine, E., Ibad, R. T., Woesteland, F., Denoulet, M., Pesez, J., Adriaenssens, É., Toillon, R., Bourhis, X. L., et al. (2025) · Stem Cell Research & Therapy · doi:10.1186/s13287-025-04681-z · Cited by 4
Ye, G., & Kaya, M. (2022) · Bioengineering · doi:10.3390/bioengineering9020081 · Cited by 4
A complementary and contrastive network for stimulus segmentation and generalization
Ta, N., Chen, H., Lyu, Y., Wang, X., Shi, Z., & Liu, Z. (2023) · Image and Vision Computing · doi:10.1016/j.imavis.2023.104694 · Cited by 4
Optical microscopic imaging, manipulation, and analysis methods for morphogenesis research
Katoh, T. A., Fukai, Y. T., & Ishibashi, T. (2023) · Microscopy · doi:10.1093/jmicro/dfad059 · Cited by 5
Celldetective, an AI-enhanced image analysis tool for unraveling dynamic cell interactions
Torro, R., Díaz-Bello, B., Arawi, D. E., Dervanova, K., Ammer, L., Dupuy, F., Chames, P., Sengupta, K., & Limozin, L. (2026) · eLife · doi:10.7554/elife.105302.3 · Cited by 4
CNN-Modified Encoders in U-Net for Nuclei Segmentation and Quantification of Fluorescent Images
Shrestha, A., Bao, X., Cheng, Q., & McRoy, S. (2024) · IEEE Access · doi:10.1109/access.2024.3436509 · Cited by 4
GU-Net: Causal relationship-based generative medical image segmentation model
Cheng, D., Gai, J., Yang, B., Mao, Y., Gao, X., Zhang, B., Jing, W., Deng, J., Zhao, F., & Mao, N. (2024) · Heliyon · doi:10.1016/j.heliyon.2024.e37338 · Cited by 4
GeNSeg-Net: A General Segmentation Framework for Any Nucleus in Immunohistochemistry Images
Xu, S., Li, G., Song, H., Wang, J., Wang, Y., & Li, Q. (2024) · ACM International Conference on Multimedia (ACM MM) · doi:10.1145/3664647.3681441 · Cited by 6
Evaluation of coarse aggregate properties in hardened concrete based on segment anything model (SAM)
Baek, S., Koh, S., Kim, W., & Kim, T. (2024) · Construction and Building Materials · doi:10.1016/j.conbuildmat.2024.139013 · Cited by 4
Efficient Microscopic Image Instance Segmentation for Food Crystal Quality Control
Ji, X., Allebach, J. P., Shakouri, A., & Zhu, F. M. (2024) · IEEE International Workshop on Multimedia Signal Processing (MMSP) · doi:10.1109/mmsp61759.2024.10743276 · Cited by 4
UltraNet: Unleashing the Power of Simplicity for Accurate Medical Image Segmentation
Han, Z., Zhang, Y., Liu, L., & Zhang, Y. (2024) · Interdisciplinary Sciences Computational Life Sciences · doi:10.1007/s12539-024-00682-3 · Cited by 4
Zhan, B., Song, E., Liu, H., & Chu, Z. (2025) · Expert Systems with Applications · doi:10.1016/j.eswa.2025.128549 · Cited by 4
How Shift Equivariance Impacts Metric Learning for Instance Segmentation
Rumberger, J. L., Yu, X., Hirsch, P., Dohmen, M., Guarino, V. E., Mokarian, A., Mais, L., Funke, J., & Kainmueller, D. (2021) · IEEE/CVF International Conference on Computer Vision (ICCV) · doi:10.1109/iccv48922.2021.00704 · Cited by 4
Three-dimensional tumour microenvironment reconstruction and tumour-immune interactions' analysis
Barmpoutis, P., Kayhanian, H., Waddingham, W., Alexander, D. C., & Jansen, M. (2021) · International Conference on Digital Image Computing: Techniques and Applications (DICTA) · doi:10.1109/dicta52665.2021.9647283 · Cited by 4
KNOWLEDGE DISCOVERY IN DATA OF PROSTATE CANCER BY APPLYING ENSEMBLE LEARNING
Manikandan, G., & Dr.Bhuvaneswari, G. (2022) · Indian Journal of Computer Science and Engineering · doi:10.21817/indjcse/2022/v13i3/221303182 · Cited by 10
Effect of capillary fluid flow on single cancer cell cycle dynamics, motility, volume and morphology
Taïeb, H. M., Herment, G., Robinson, T., & Cipitria, A. (2022) · Lab on a Chip · doi:10.1039/d2lc00322h · Cited by 6
TMTrans: texture mixed transformers for medical image segmentation
Chen, L., Wang, T., & Ge, H. (2023) · AI Communications · doi:10.3233/aic-230089 · Cited by 4
Scalable model for segmenting Cells’ Nuclei using the U-NET architecture
Ghnemat, R., Almodawar, A., & Saraireh, J. A. (2024) · Multimedia Tools and Applications · doi:10.1007/s11042-023-18033-7 · Cited by 4
PL-Net: progressive learning network for medical image segmentation
Mao, K., Li, R., Cheng, J., Huang, D., Song, Z., & Liu, Z. (2024) · Frontiers in Bioengineering and Biotechnology · doi:10.3389/fbioe.2024.1414605 · Cited by 4
Maylaa, T., Windal, F., Benhabiles, H., Maubon, G., Maubon, N., Vandenhaute, E., & Collard, D. (2022) · Current Computer - Aided Drug Design · doi:10.2174/1573409918666220208120756 · Cited by 4
Sambaturu, B., Gupta, A., Jawahar, C. V., & Arora, C. (2021) · Lecture notes in computer science · doi:10.1007/978-3-030-87196-3_58 · Cited by 4
OpSeF: Open source Python framework for collaborative instance segmentation of bioimagesPreprint
Rasse, T. M., Hollandi, R., & Horváth, P. (2020) · bioRxiv (Cold Spring Harbor Laboratory) · doi:10.1101/2020.04.29.068023 · Cited by 4
Generative adversarial networks in cell microscopy for image augmentation. A systematic reviewPreprint
Lesmes-Leon, D. N., Dengel, A. R., & Ahmed, S. (2023) · bioRxiv (Cold Spring Harbor Laboratory) · doi:10.1101/2023.08.25.554841 · Cited by 4
Improving Cell Image Segmentation by Using Isotropic Undecimated Wavelet Transform
Toptaş, M., Toptaş, B., & Hanbay, D. (2024) · IEEE Access · doi:10.1109/access.2024.3487481 · Cited by 3
Guarino, V., Vasco, G., Arima, V., Cataldo, R., Zizzari, A. T., Perrone, E., Gigli, G., & Cesaria, M. (2025) · Journal of Functional Biomaterials · doi:10.3390/jfb16080274 · Cited by 3
DPGNet: A Boundary-Aware Medical Image Segmentation Framework via Uncertainty Perception
Wang, H., Qi, Y. L., Liu, W., Guo, K., Lyu, W., & Liang, Z. (2025) · IEEE Journal of Biomedical and Health Informatics · doi:10.1109/jbhi.2025.3601025 · Cited by 6
Chiabotto, G., Dumontel, B., Zilli, L., Vighetto, V., Savino, G., Alfieri, F., Licciardello, M., Cedrino, M., Arena, S., Tonda‐Turo, C., et al. (2025) · ACS Biomaterials Science & Engineering · doi:10.1021/acsbiomaterials.5c00380 · Cited by 3
Generalizable 2D medical image segmentation via wavelet-guided spatial-frequency fusion network
Pan, X., Shi, Z., Zheng, H., & Qiuyu, L. (2025) · Biomedical Physics & Engineering Express · doi:10.1088/2057-1976/ae01a9 · Cited by 3
TSLDSeg: A texture-aware and semantic-enhanced latent diffusion model for medical image segmentation
Yang, Z., Li, C., & Ma, J. (2025) · Pattern Recognition · doi:10.1016/j.patcog.2025.112795 · Cited by 3
Kui, X.-Y., Hu, Z.-P., Ji, Z.-X., Jiang, S., Xiao, Q.-M., Zou, Z.-W., Li, Q.-S., Li, Y., Zou, B.-J., & Chen, L.-M. (2026) · Neurocomputing · doi:10.1016/j.neucom.2026.133326 · Cited by 3
Cell shapes decode molecular phenotypes in image-based spatial proteomics
Le, T., Leineweber, W. D., Viana, M. P., Cesnik, A., Hansen, J. N., Ouyang, W., Rafelski, S. M., & Lundberg, E. (2026) · Cell Systems · doi:10.1016/j.cels.2026.101589 · Cited by 3
A Study and Analysis of Deep Neural Networks for Cancer Using Histopathology Images
Singha, A., & Ganapathy, J. (2022) · Advances in medical technologies and clinical practice book series · doi:10.4018/978-1-6684-4405-4.ch002 · Cited by 3
A Deep Learning Approach to Segment High-Content Images of the E. coli Bacteria
Duong, D. Q., Tran, T.-A., Kieu, P. N. N., Nguyen, T. K., Le, B., Baker, S. G., & Nguyen, B. T. (2023) · Lecture notes in computer science · doi:10.1007/978-3-031-45382-3_16 · Cited by 3
Chen, Y.-X., Xiong, Y.-J., Qiu, X., & Xia, C.-M. (2024) · Biomedical Signal Processing and Control · doi:10.1016/j.bspc.2024.106726 · Cited by 3
Lo, C. S. Y., Taneja, N., & Chaudhuri, A. R. (2024) · DNA repair · doi:10.1016/j.dnarep.2024.103769 · Cited by 3
CMTT-JTracker: a fully test-time adaptive framework serving automated cell lineage construction
Chen, L., Fu, S., & Zhang, Z. (2024) · Briefings in Bioinformatics · doi:10.1093/bib/bbae591 · Cited by 3
A Semantic Conditional Diffusion Model for Enhanced Personal Privacy Preservation in Medical Images
Wang, S., Zhao, Z., Zhao, Y., Wang, L., Zhang, Y., Wang, J., Qiao, S., & Lv, Z. (2024) · IEEE Journal of Biomedical and Health Informatics · doi:10.1109/jbhi.2024.3511583 · Cited by 4
Hazelwood, O. S., & Ashraf, M. A. (2024) · Quantitative Plant Biology · doi:10.1017/qpb.2024.18 · Cited by 3
Proximity adjusted centroid mapping for accurate detection of nuclei in dense 3D cell systems
Looverbosch, T. V. D., Beuckeleer, S. D., Smet, F. D., Sijbers, J., & Vos, W. H. D. (2024) · Computers in Biology and Medicine · doi:10.1016/j.compbiomed.2024.109561 · Cited by 3
Image Segmentation Refinement Based on Region Expansion and Minor Contour Adjustments
Yan, L., Zhang, X., Wang, K., Xiong, S., & Zhang, D. (2025) · IET Image Processing · doi:10.1049/ipr2.70017 · Cited by 3
Schuiki, J., Steiner, M. J., Hofbauer, H., Drothler, S., Pessina, G., Greil, R., Zaborsky, N., & Uhl, A. (2025) · Lecture notes in computer science · doi:10.1007/978-3-031-98694-9_11 · Cited by 3
CUPre: Cross-domain Unsupervised Pre-training for few-shot cell segmentation
Liao, W., Li, X., Wang, Q., Xu, Y., Yin, Z., & Xiong, H. (2025) · Information Fusion · doi:10.1016/j.inffus.2025.103641 · Cited by 5
Financial table extraction in image documents
Watson, W., & Liu, B. (2020) · ACM International Conference on AI in Finance (ICAIF) · doi:10.1145/3383455.3422520 · Cited by 3
Focal Attention Networks: Optimising Attention for Biomedical Image Segmentation
Yeung, M., Rundo, L., Sala, E., Schönlieb, C., & Yang, G. (2022) · IEEE International Symposium on Biomedical Imaging (ISBI) · doi:10.1109/isbi52829.2022.9761414 · Cited by 3
Wu, H., Souedet, N., You, Z., Jan, C., Clouchoux, C., & Delzescaux, T. (2021) · Annual International Conference of the IEEE Engineering in Medicine and Biology Society (EMBC) · doi:10.1109/embc46164.2021.9630914 · Cited by 3
Image-based identification and isolation of micronucleated cells to dissect cellular consequences
DiPeso, L., Pendyala, S., Huang, H. Z., Fowler, D. M., & Hatch, E. M. (2025) · eLife · doi:10.1101/2023.05.04.539483 · Cited by 3
Residual Network with Attention to Neural Cells Segmentation
Abbas, R. F., & Abdulmunim, M. E. (2023) · Iraqi Journal of Science · doi:10.24996/ijs.2023.64.4.37 · Cited by 3
Deep learning based recognition of shape-coded microparticles
Şahin, M. A., van den Eijnden, L., Bhiri, C., & Destgeer, G. (2023) · Frontiers in Lab on a Chip Technologies · doi:10.3389/frlct.2023.1248265 · Cited by 3
Multi-decoder Networks for Semi-supervised Medical Image Segmentation
Zhang, J., Zhao, Z., Chen, Y., & Liu, H. (2023) · International Conference on Digital Image Processing · doi:10.1145/3604078.3604098 · Cited by 3
Metadata
- Authors
- Caicedo, J. C., Goodman, A., Karhohs, K. W., Cimini, B. A., Ackerman, J., Haghighi, M., Heng, C., Becker, T., Doan, M., McQuin, C., Rohban, M., Singh, S., & Carpenter, A. E.
- Affiliations
- Broad Institute (US)
- Corresponding author
- Carpenter, Anne E.
- ORCID
- Venue
- Nature Methods
- Published
- 2019-10-21
- Volume
- 16
- Issue
- 12
- Pages
- 1247-1253
- ISSN
- 1548-7091 (ISSN-L)
- 1548-7105
- PMC
- PMC6919559
- OpenAlex
- W2980998394
- Cited by
- 809
- References
- 49
- Citations by year
- 2026: 86 · 2025: 142 · 2024: 150 · 2023: 144 · 2022: 124 · 2021: 114 · 2020: 44 · 2019: 4
- FWCI
- 34.63
- Type
- journal article
- Language
- en
- Update notices
- correction (2020-01-22)
- Open access
- hybrid
- doi.org
- Locations
- Nature Methods (publishedVersion, cc-by)
- Europe PMC (PubMed Central) (publishedVersion, cc-by)
- PubMed Central (publishedVersion, cc-by)
- PubMed (publishedVersion)
- Funders
- Eli Lilly and Company
- Nvidia
- Broad Institute
- National Institutes of Health
- National Institute of General Medical Sciences (R35GM122547)
- Topics
- Life Sciences › Biochemistry, Genetics and Molecular Biology › Biophysics › Cell Image Analysis Techniques
- Physical Sciences › Computer Science › Computer Vision and Pattern Recognition › Digital Imaging for Blood Diseases
- Physical Sciences › Computer Science › Computer Vision and Pattern Recognition › Advanced Neural Network Applications
- Keywords
- nuclei segmentation, bioimage analysis, deep learning, microscopy image analysis, automated image analysis
- MeSH terms
- Data Science, Cell Nucleus, Humans, Image Processing, Computer-Assisted, Microscopy, Fluorescence
About these checks
Registry, retraction, Cites and statistics results are computed, not judged, with one exception: a printed reference that no index lists is read once by a model before it counts as a citation error. Claims are extracted by a model and kept only when their quote appears verbatim in the text; each cited source is then checked, with a model’s help, for whether it says what the claim relies on. Those verdicts can be wrong — read the claim’s quote and the cited source before relying on one.
Statistics and arithmetic are recomputed, not judged.
Confidence bands are shown only for fields calibrated on our annotated test set. None is calibrated yet, so no band is shown.
What counts as a claim ›How we measure confidence ›How we check this ›
Are you an author, or do you see a problem with this page? Request a review
