

The DOI matches its Crossref record; 97 of the 98 references it cites were found in a registry or an index; 14 of the 30 sources its claims cite were checked for support.
Nucleotide Transformer: building and evaluating robust foundation models for human genomics
Open accessPublished version of a preprint
Abstract
Abstract Closing the gap between measurable genetic information and observable traits is a longstanding challenge in genomics. Yet, the prediction of molecular phenotypes from DNA sequences alone remains limited and inaccurate, often driven by the scarcity of annotated data and the inability to transfer learnings between prediction tasks. Here, we present an extensive study of foundation models pre-trained on DNA sequences, named the Nucleotide Transformer, integrating information from 3,202 diverse human genomes, as well as 850 genomes from a wide range of species, including model and non-model organisms. These transformer models yield transferable, context-specific representations of nucleotide sequences, which allow for accurate molecular phenotype prediction even in low-data settings. We show that the sequence representations alone match or outperform specialized methods on 12 of 18 prediction tasks, and up to 15 after fine-tuning. Despite no supervision, the transformer models learned to focus attention on key genomic elements, including those that regulate gene expression, such as enhancers. Lastly, we demonstrate that utilizing model representations can improve the prioritization of functional genetic variants. The training and application of foundational models in genomics explored in this study provide a widely applicable stepping stone to bridge the gap of accurate molecular phenotype prediction from DNA sequence.
Overview
AI snapshot
Written from the paper’s full text.
TL;DR
Nucleotide Transformer introduces and benchmarks DNA foundation models from 50 million to 2.5 billion parameters pretrained on the human reference genome, 3,202 human genomes, and 850 species genomes. Fine-tuned models match or exceed supervised baselines across many genomic tasks, learn regulatory elements without supervision, and prioritize variants, with optimized NT-v2 models achieving strong performance at much smaller sizes.
Key findings
- Fine-tuned NT models matched (n = 6) or surpassed (n = 12) the 18 BPNet baseline models; probing alone matched 5 and exceeded 8 out of 18 tasks.
- The Multispecies 2.5B model achieved the highest overall performance across the 18 tasks compared with DNABERT-2, HyenaDNA-32-kb, and Enformer, and matched or outperformed HyenaDNA in all 18 tasks (matched n = 7, outperformed n = 11).
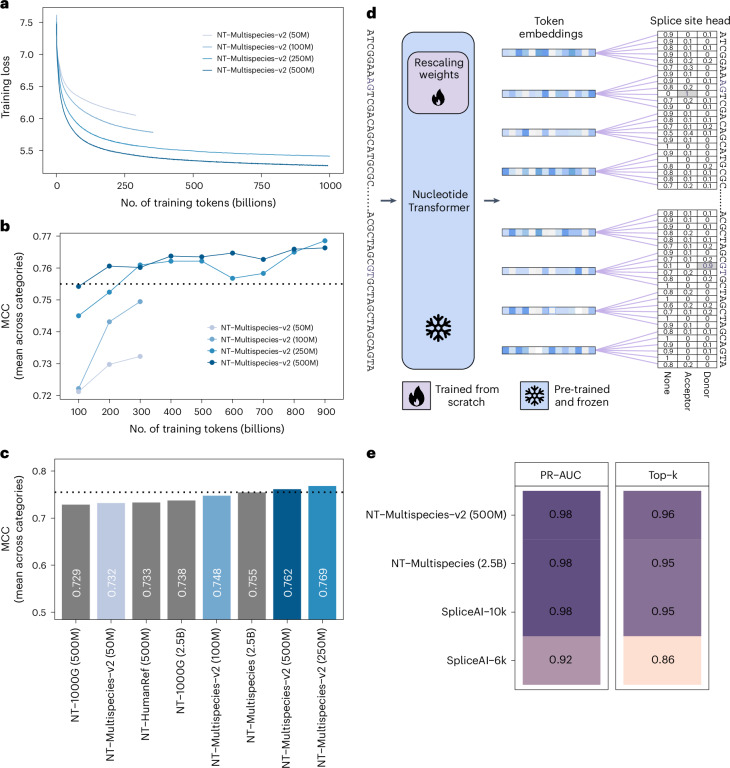
- On additional tasks, the Multispecies 2.5B model reached a top-k accuracy of 95% and precision-recall AUC of 0.98 for splice-site prediction; the NT-v2 500M 12-kb model improved this to 96% top-k accuracy and 0.98 precision-recall AUC.
- The NT-v2 250M model attained the best benchmark performance (average MCC of 0.769) while being ten-times smaller than the 2.5B-parameter model; zero-shot variant scores reached AUCs of 0.7–0.8, with ClinVar AUC 0.80 for the Multispecies 2.5B model.
Methods
- Encoder-only transformer language models trained with masked language modeling on six-mer tokens; NT-v1 used 6-kb context and NT-v2 used 12-kb context with rotary embeddings, swiGLU activations, and no MLP biases or dropout.
- Pre-training datasets included the human reference genome, 3,202 high-coverage human genomes from the 1000 Genomes Project, and 850 species genomes; models ranged from 50 million to 2.5 billion parameters.
- Evaluation used 18 curated genomic tasks with tenfold cross-validation, probing and parameter-efficient IA3 fine-tuning, comparisons with BPNet, DNABERT-2, HyenaDNA, and Enformer, plus additional DeepSEA, SpliceAI, and DeepSTARR tasks and zero-shot variant-effect scoring.
Limitations
- The authors state that the models’ attention span remains limited; they note that Enformer suggested perception fields up to 200 kb may be needed for long-range dependencies, that standard transformers scale quadratically with sequence length, and that HyenaDNA performance deteriorated when its training perception field increased.
- The authors state that supervised models with optimized architectures and extensive training on large datasets continue to demonstrate superior performance, though DNA language models remain competitive on several tasks.
- The authors note that Enformer’s benchmark performance might be inflated due to potential data leakage from different original data splits; the text also makes evident that the 18-task benchmark datasets were subsampled to a maximum of 30,000 training and 3,000 validation/testing examples, which may limit generalizability.
Model-written summary. Check it against the paper before relying on it.
Integrity signals
Registry
Cites
Statistics
Figures
Verification
Claims the paper makes
59 Own result · 30 Own interpretation · 23 Own method · 18 No basis given · 11 Sources not found · 5 Partly supported · 3 Supported · 3 No full text of the sources · 1 Not supported · 1 Couldn’t confirm · accuracy not yet measured
The cited sources support only part of this claim — read each source’s verdict below.
In the paper
“Crucial regulatory elements governing gene expression, such as enhancers and promoters41–43, were consistently detected by all models across multiple heads and layers.”
§ Nucleotide Transformer: building and evaluating robust foundation models for human genomics > Discussion
What the sources say
- Supportedcites [41] Lappalainen, T. et al. Transcriptome and genome sequencing uncovers functional variation in humans. Nature 501, 506–511 (2013). source
The citation is attached to the identification of enhancers and promoters as regulatory elements, not to the citing authors’ claim about detection by models. In “Properties of regulatory variants,” the paper reports enrichment of expression-associated variants in active promoters and strong enhancers and describes regulatory elements as mediating genetic effects on gene expression. (LLM, conf=0.90)
- Supportedcites [42] Consortium, G. The gtex consortium atlas of genetic regulatory effects across human tissues. Science 369, 1318–1330 (2020). source
The citation is attached to “enhancers and promoters,” not to the citing authors’ finding about model detection. The Discussion identifies promoters and enhancers as classical regulatory elements through which genetic perturbations affect gene expression. (LLM, conf=0.92)
- Partly supportedcites [43] Võsa, U. et al. Large-scale cis-and trans-eqtl analyses identify thousands of genetic loci and polygenic scores that regulate blood gene expression. Nat. Genetics 53, 1300–1310 (2021). sourceExperimental — accuracy not yet measured
The Results section, “Local genetic effects on blood gene expression” (page unavailable), links promoter capture Hi-C contacts to genetic effects on gene expression, supporting the regulatory context. The paper does not itself discuss enhancers as gene-expression regulators; enhancers appear in a cited reference’s title. The statement about detection by models follows the citation and is not attributed to this source. (LLM, conf=0.76)
plaincorrelational- Asserted: passes — The authors put it forward as true.
- Checkable: passes — It can be checked against evidence.
- Load-bearing: passes — The paper’s conclusions depend on it.
- Based: passes — The paper gives a reason why it holds.
- Supported
Every source the paper cites for this claim was checked and supports it.
In the paper
“confirming that downstream model engineering can lead to performance improvements47.”
§ Nucleotide Transformer: building and evaluating robust foundation models for human genomics > Discussion
What the sources say
- Supportedcites [47] Stärk, H., Dallago, C., Heinzinger, M. & Rost, B. Light attention predicts protein location from the language of life. Bioinform. Adv. 1, vbab035 (2021). source
The Results (§4.2, page not provided) report that the light-attention architecture consistently outperformed other approaches using embeddings from every protein language model tested. The Discussion (§5.2, page not provided) attributes the improvement to how light attention processes those embeddings, supporting the claim that downstream model design can improve performance. (LLM, conf=0.93)
plaindirect- Asserted: passes — The authors put it forward as true.
- Checkable: passes — It can be checked against evidence.
- Load-bearing: passes — The paper’s conclusions depend on it.
- Based: passes — The paper gives a reason why it holds.
- Supported
The cited sources support only part of this claim — read each source’s verdict below.
In the paper
“it is probable that the models, without any supervision, have learned to distinguish relevant regulatory genomic features associated with gene expression and methylation variation.”
§ Nucleotide Transformer: building and evaluating robust foundation models for human genomics > Results > The pre-trained embeddings predict the impact of mutations
What the sources say
- Partly supportedcites [41] Lappalainen, T. et al. Transcriptome and genome sequencing uncovers functional variation in humans. Nature 501, 506–511 (2013). sourceExperimental — accuracy not yet measured
The Properties of regulatory variants section reports that expression QTLs are enriched in regulatory genomic features, including transcription-factor peaks, promoters, and enhancers. It does not show that unsupervised models learned to distinguish those features or connect them to methylation variation; the Methods instead describe QTL mapping by linear regression. No page numbers are available in our copy. (LLM, conf=0.82)
- Could not verifycites [42] Consortium, G. The gtex consortium atlas of genetic regulatory effects across human tissues. Science 369, 1318–1330 (2020). sourceExperimental — accuracy not yet measured
The Fine-mapping and Discussion sections discuss regulatory variants associated with gene expression, but neither reports that unsupervised models learned to distinguish genomic features. Searches for unsupervised learning and methylation variation found no passage addressing that claim; the available passages have no page numbers. (LLM, conf=0.76)
- Could not verifycites [43] Võsa, U. et al. Large-scale cis-and trans-eqtl analyses identify thousands of genetic loci and polygenic scores that regulate blood gene expression. Nat. Genetics 53, 1300–1310 (2021). sourceExperimental — accuracy not yet measured
The Results section on local and distal gene expression describes eQTL meta-analyses, while Online Methods describes expression-data preprocessing and probe matching. Neither reports that unsupervised models learned to distinguish regulatory genomic features associated with both gene-expression and methylation variation (searched: unsupervised models, regulatory genomic features, methylation variation). (LLM, conf=0.76)
hedgedcorrelational- Asserted: passes — The authors put it forward as true.
- Checkable: passes — It can be checked against evidence.
- Load-bearing: passes — The paper’s conclusions depend on it.
- Based: passes — The paper gives a reason why it holds.
- Partly supported
Every source the paper cites for this claim was checked and supports it.
In the paper
“Note that Enformer has been originally trained in a supervised fashion to solve chromatin and gene expression tasks19.”
§ Nucleotide Transformer: building and evaluating robust foundation models for human genomics > Methods > Models
What the sources say
- Supportedcites [19] Avsec, Ž. et al. Effective gene expression prediction from sequence by integrating long-range interactions. Nat. Methods 18, 1196–1203 (2021). source
The Results section states that Enformer was developed to predict gene expression and chromatin states from DNA sequence. The Methods section describes training it on genomic-track targets with a loss function, supporting the characterization of its original training as supervised. (LLM, conf=0.94)
plain- Asserted: passes — The authors put it forward as true.
- Checkable: passes — It can be checked against evidence.
- Load-bearing: passes — The paper’s conclusions depend on it.
- Based: passes — The paper gives a reason why it holds.
- Supported
The cited sources support only part of this claim — read each source’s verdict below.
In the paper
“The dataset is composed of 484,052 DNA sequences of size 249 nucleotides, each measured for their quantitative enhancer activity toward a developmental or a housekeeping promoter.”
§ Nucleotide Transformer: building and evaluating robust foundation models for human genomics > Methods > Additional downstream tasks
What the sources say
- Partly supportedcites de Almeida et al.12 de Almeida, B. P., Reiter, F., Pagani, M. & Stark, A. DeepSTARR predicts enhancer activity from dna sequence and enables the de novo design of synthetic enhancers. Nat. Genet. 54, 613–624 (2022). sourceExperimental — accuracy not yet measured
The Data preparation section states that the dataset contains 249-bp windows and 484,052 examples after augmentation. It also says reverse complements were added with the same output as their original sequences, so the paper does not support saying that each of the 484,052 sequences was separately measured. The DeepSTARR prediction section describes activities for both developmental and housekeeping promoters. (LLM, conf=0.88)
plain- Asserted: passes — The authors put it forward as true.
- Checkable: passes — It can be checked against evidence.
- Load-bearing: unclear — It is unclear whether the paper’s conclusions depend on it.
- Based: passes — The paper gives a reason why it holds.
- Partly supported
A result the paper reports from its own data — it cites no other source for it, so there is none to check. The quote shows it is in the paper.
In the paper
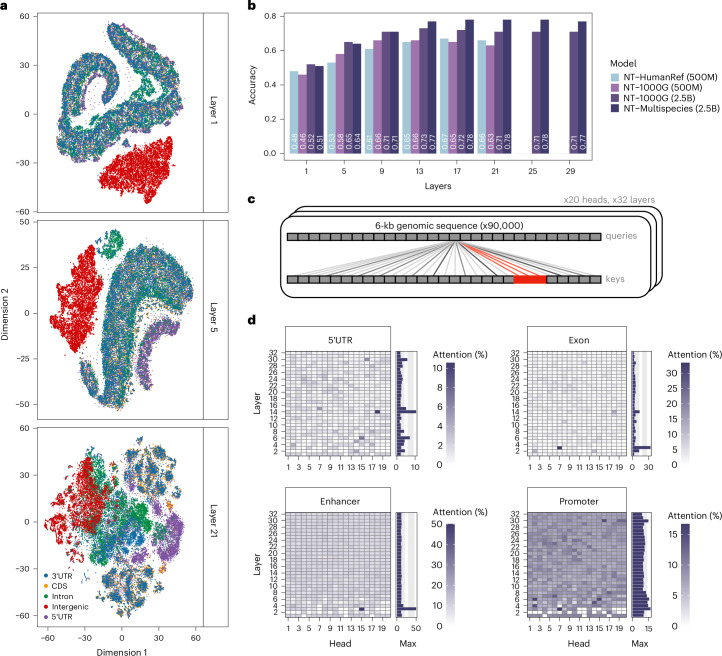
“We observed that the NT models, without any supervision, learned to distinguish genomic sequences that were uniquely annotated as intergenic, intronic, coding and untranslated regions (UTRs), albeit with varying degrees of proficiency across different layers”
§ Nucleotide Transformer: building and evaluating robust foundation models for human genomics > Results > Detection of known genomic elements in an unsupervised manner
plaindirect- Asserted: passes — The authors put it forward as true.
- Checkable: passes — It can be checked against evidence.
- Load-bearing: passes — The paper’s conclusions depend on it.
- Based: passes — The paper gives a reason why it holds.
A result the paper reports from its own data — it cites no other source for it, so there is none to check. The quote shows it is in the paper.
In the paper
“our supervised probing strategy demonstrated high classification performance for these elements, with accuracy values exceeding 0.78, especially for deeper layers”
§ Nucleotide Transformer: building and evaluating robust foundation models for human genomics > Results > Detection of known genomic elements in an unsupervised manner
boostedcorrelational- Asserted: passes — The authors put it forward as true.
- Checkable: passes — It can be checked against evidence.
- Load-bearing: passes — The paper’s conclusions depend on it.
- Based: passes — The paper gives a reason why it holds.
A result the paper reports from its own data — it cites no other source for it, so there is none to check. The quote shows it is in the paper.
In the paper
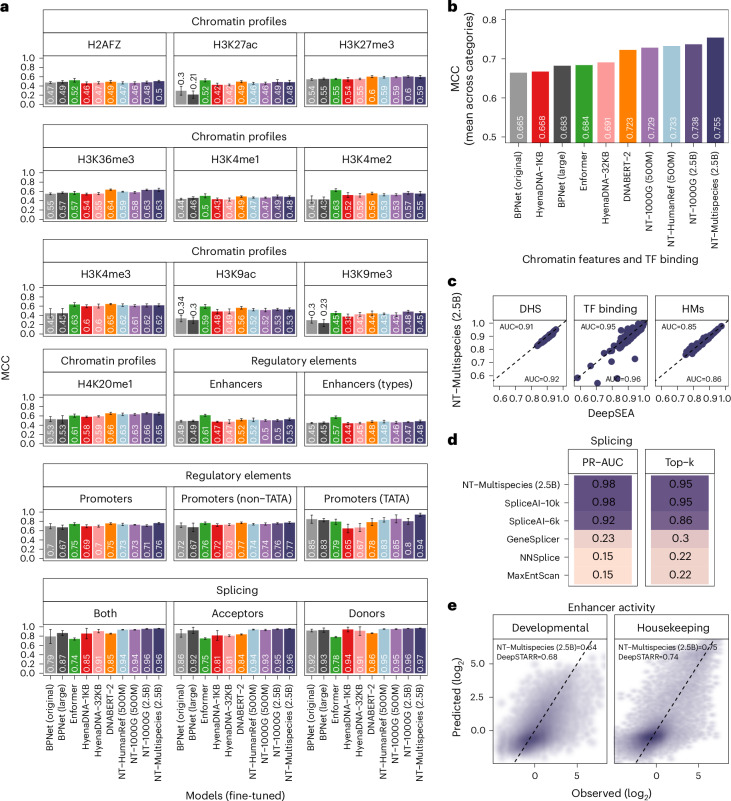
“Notably, fine-tuned NT models outperformed the probed models”
§ Nucleotide Transformer: building and evaluating robust foundation models for human genomics > Results > The Nucleotide Transformer model accurately predicts genomics tasks
plaindirectn = 12- Asserted: passes — The authors put it forward as true.
- Checkable: passes — It can be checked against evidence.
- Load-bearing: passes — The paper’s conclusions depend on it.
- Based: passes — The paper gives a reason why it holds.
A result the paper reports from its own data — it cites no other source for it, so there is none to check. The quote shows it is in the paper.
In the paper
“in the enhancer types prediction task, we observed a relative difference as high as 38% between the highest- and lowest-performing layer”
§ Nucleotide Transformer: building and evaluating robust foundation models for human genomics > Results > The Nucleotide Transformer model accurately predicts genomics tasks
plain- Asserted: passes — The authors put it forward as true.
- Checkable: passes — It can be checked against evidence.
- Load-bearing: unclear — It is unclear whether the paper’s conclusions depend on it.
- Based: passes — The paper gives a reason why it holds.
A result the paper reports from its own data — it cites no other source for it, so there is none to check. The quote shows it is in the paper.
In the paper
“which we could improve by increasing its size to 28 million parameters (average MCC of 0.683)”
§ Nucleotide Transformer: building and evaluating robust foundation models for human genomics > Results > The Nucleotide Transformer model accurately predicts genomics tasks
hedgeddirect- Asserted: passes — The authors put it forward as true.
- Checkable: passes — It can be checked against evidence.
- Load-bearing: unclear — It is unclear whether the paper’s conclusions depend on it.
- Based: passes — The paper gives a reason why it holds.
- It may state two separate claims as one. 46
- Probably not a substantial claim. 35
At least one cited source doesn’t support this claim or points to a different paper, and none confirmed it — see the verdicts below.
In the paper
“We excluded DNABERT-1 from this comparison as it can only handle a maximum input length of 512 bp and thus could not be used for most tasks20.”
- Also stated in: § Models · plain
“We excluded DNABERT-1 from this comparison as it can only handle a maximum input length of 512 bp and thus could not be used for most tasks20.”
§ Nucleotide Transformer: building and evaluating robust foundation models for human genomics > Results > Benchmark of genomics foundational models
What the sources say
- Disputedcites [20] Ji, Y., Zhou, Z., Liu, H. & Davuluri, R. V. Dnabert: pre-trained bidirectional encoder representations from transformers model for DNA-language in genome. Bioinformatics 37, 2112–2120 (2021). sourceExperimental — accuracy not yet measured
The Training section (§2.2) specifies a maximum input length of 512 for the tokenized sequence, not 512 bp. The Fine-tuning section (§2.2.3) says sequences longer than 512 are split into pieces so DNABERT-XL can process extra-long sequences; the paper also reports applications to several prediction tasks. This contradicts the claim that DNABERT could not be used for most tasks because of a 512-bp limit. (LLM, conf=0.88)
Checked by a reasoning model — may be wrong.
plaindirect- Asserted: passes — The authors put it forward as true.
- Checkable: passes — It can be checked against evidence.
- Load-bearing: passes — The paper’s conclusions depend on it.
- Based: passes — The paper gives a reason why it holds.
It may state two separate claims as one.
- Also stated in: § Models · plain
Every source the paper cites for this claim was checked and supports it.
In the paper
“in the case of housekeeping and developmental enhancer prediction, our model slightly surpassed (1%) and obtained lower (4%) correlation values, respectively (Fig. 2e), when compared to those of DeepSTARR12.”
§ Nucleotide Transformer: building and evaluating robust foundation models for human genomics > Results > The Nucleotide Transformer model accurately predicts genomics tasks
What the sources say
- Supportedcites [12] de Almeida, B. P., Reiter, F., Pagani, M. & Stark, A. DeepSTARR predicts enhancer activity from dna sequence and enables the de novo design of synthetic enhancers. Nat. Genet. 54, 613–624 (2022). source
The cited paper’s ‘DeepSTARR quantitatively predicts enhancer activity from DNA sequence’ section reports Pearson correlations for developmental and housekeeping enhancer predictions. The 1% and 4% differences describe the citing authors’ own model and are not attributed to DeepSTARR. (LLM, conf=0.91)
plain- Asserted: passes — The authors put it forward as true.
- Checkable: passes — It can be checked against evidence.
- Load-bearing: unclear — It is unclear whether the paper’s conclusions depend on it.
- Based: passes — The paper gives a reason why it holds.
It may state two separate claims as one.
- Supported
The cited sources that could be checked couldn’t confirm or dispute this claim.
In the paper
“The limited separation of 3′ UTR regions from other elements suggests that the model has not fully learned to distinguish this type of element, or as previously suggested, that many of these regions might be mis-annotated37.”
§ Nucleotide Transformer: building and evaluating robust foundation models for human genomics > Results > Detection of known genomic elements in an unsupervised manner
What the sources say
- Could not verifycites [37] Benegas, G., Batra, S. S. & Song, Y. S. DNA language models are powerful zero-shot predictors of non-coding variant effects. Proc. Natl Acad. Sci. USA 120, e2311219120 (2023). sourceExperimental — accuracy not yet measured
The citation is attached to the suggestion that many 3′ UTR regions might be mis-annotated. In Results, “Unsupervised Clustering of Genomic Regions” (page unavailable), the paper suggests annotation errors for ncRNAs, not 3′ UTRs. Searches for 3′ UTR annotation and classification found no passage in our copy addressing that suggestion. (LLM, conf=0.72)
hedgedconditional- Asserted: passes — The authors put it forward as true.
- Checkable: passes — It can be checked against evidence.
- Load-bearing: unclear — It is unclear whether the paper’s conclusions depend on it.
- Based: passes — The paper gives a reason why it holds.
It may state two separate claims as one.
- Could not verify
The cited sources support only part of this claim — read each source’s verdict below.
In the paper
“The BPNet architecture has been used widely in genomics and represents a very strong default architecture for modeling small-sized datasets from scratch through supervised learning.”
§ Nucleotide Transformer: building and evaluating robust foundation models for human genomics > Results > The Nucleotide Transformer model accurately predicts genomics tasks
What the sources say
- Partly supportedcites [9] Avsec, Ž. et al. Base-resolution models of transcription-factor binding reveal soft motif syntax. Nat. Genet. 53, 354–366 (2021). sourceExperimental — accuracy not yet measured
The BPNet architecture and training sections describe a supervised model trained on genomic data, and the Discussion calls it a general framework that outperformed the methods evaluated. The paper does not establish that BPNet was already widely used in genomics or that it is a strong default for small-sized datasets trained from scratch; its reported training is not presented as a small-dataset evaluation. The supplied passages have section labels but no page numbers. (LLM, conf=0.86)
boosted- Asserted: passes — The authors put it forward as true.
- Checkable: passes — It can be checked against evidence.
- Load-bearing: fails — The paper’s conclusions may not depend on it.
- Based: passes — The paper gives a reason why it holds.
Probably not a substantial claim. The paper’s conclusions may not depend on it. It may state two separate claims as one.
- Partly supported
The cited sources support only part of this claim — read each source’s verdict below.
In the paper
“The dataset is composed of 2.4 million sequences, each of size 1,000 nucleotides, and associated with 919 chromatin features. These include 690 TF, 125 DNase and 104 histone features.”
§ Nucleotide Transformer: building and evaluating robust foundation models for human genomics > Methods > Additional downstream tasks
What the sources say
- Partly supportedcites Zhou et al.10 Zhou, J. & Troyanskaya, O. G. Predicting effects of noncoding variants with deep learning–based sequence model. Nat. Methods 12, 931–934 (2015). sourceExperimental — accuracy not yet measured
Online Methods, “Data for training DeepSEA” (page not specified), says each sample is a 1,000-bp sequence paired with labels for 919 chromatin features. “Model design and training” gives the stated breakdown: 690 TF, 125 DNase and 104 histone features. The copy does not state that the dataset contains 2.4 million sequences; it describes 521,636,200 bp divided into 200-bp bins, with some chromosomes held out for testing. (LLM, conf=0.86)
plaincorrelational- Asserted: passes — The authors put it forward as true.
- Checkable: passes — It can be checked against evidence.
- Load-bearing: unclear — It is unclear whether the paper’s conclusions depend on it.
- Based: passes — The paper gives a reason why it holds.
It may state two separate claims as one.
- Partly supported
A result the paper reports from its own data — it cites no other source for it, so there is none to check. The quote shows it is in the paper.
In the paper
“In comparison with the state-of-the-art enhancer activity DeepSTARR model, our model achieved similar performance for four TF motifs and demonstrated superior performance for the Dref motif”
§ Nucleotide Transformer: building and evaluating robust foundation models for human genomics > Results > Detection of known genomic elements in an unsupervised manner
plain- Asserted: passes — The authors put it forward as true.
- Checkable: passes — It can be checked against evidence.
- Load-bearing: passes — The paper’s conclusions depend on it.
- Based: passes — The paper gives a reason why it holds.
It may state two separate claims as one.
A result the paper reports from its own data — it cites no other source for it, so there is none to check. The quote shows it is in the paper.
In the paper
“The model not only captured constraints at different splicing junctions but also identified a region in the middle of the second intron crucial for the splicing of this exon.”
§ Nucleotide Transformer: building and evaluating robust foundation models for human genomics > Results > Detection of known genomic elements in an unsupervised manner
plaindirectSingle case- Asserted: passes — The authors put it forward as true.
- Checkable: passes — It can be checked against evidence.
- Load-bearing: passes — The paper’s conclusions depend on it.
- Based: passes — The paper gives a reason why it holds.
It may state two separate claims as one.
A result the paper reports from its own data — it cites no other source for it, so there is none to check. The quote shows it is in the paper.
In the paper
“our fine-tuned models either matched (n = 6) or surpassed (n = 12) out of the 18 baseline models”
§ Nucleotide Transformer: building and evaluating robust foundation models for human genomics > Results > The Nucleotide Transformer model accurately predicts genomics tasks
plainn = 12- Asserted: passes — The authors put it forward as true.
- Checkable: passes — It can be checked against evidence.
- Load-bearing: passes — The paper’s conclusions depend on it.
- Based: passes — The paper gives a reason why it holds.
It may state two separate claims as one.
The paper states this without a source or data behind it here, so there is nothing to check it against. The quote shows it is in the paper.
In the paper
“This approach allowed for faster fine-tuning on a single GPU, reduced storage needs by 1,000-fold over all fine-tuning parameters, while still delivering comparable performance.”
§ Nucleotide Transformer: building and evaluating robust foundation models for human genomics > Results > The Nucleotide Transformer model accurately predicts genomics tasks
plaindirect- Asserted: passes — The authors put it forward as true.
- Checkable: passes — It can be checked against evidence.
- Load-bearing: passes — The paper’s conclusions depend on it.
- Based: passes — The paper gives a reason why it holds.
It may state two separate claims as one.
The paper states this without a source or data behind it here, so there is nothing to check it against. The quote shows it is in the paper.
In the paper
“Additionally, fine-tuning exhibited a smaller variance in performance, enhancing the robustness of the approach.”
§ Nucleotide Transformer: building and evaluating robust foundation models for human genomics > Results > The Nucleotide Transformer model accurately predicts genomics tasks
plaindirect- Asserted: passes — The authors put it forward as true.
- Checkable: passes — It can be checked against evidence.
- Load-bearing: passes — The paper’s conclusions depend on it.
- Based: passes — The paper gives a reason why it holds.
It may state two separate claims as one.
A result the paper reports from its own data — it cites no other source for it, so there is none to check. The quote shows it is in the paper.
In the paper
“In particular, the 500-M-sized models and those trained on less-diverse sequences, exhibited lower separation among genomic regions”
§ Nucleotide Transformer: building and evaluating robust foundation models for human genomics > Results > Detection of known genomic elements in an unsupervised manner
plaincorrelational- Asserted: passes — The authors put it forward as true.
- Checkable: passes — It can be checked against evidence.
- Load-bearing: unclear — It is unclear whether the paper’s conclusions depend on it.
- Based: passes — The paper gives a reason why it holds.
It may state two separate claims as one.
A result the paper reports from its own data — it cites no other source for it, so there is none to check. The quote shows it is in the paper.
In the paper
“Still, Enformer achieved the best performance on enhancer prediction and some chromatin tasks”
§ Nucleotide Transformer: building and evaluating robust foundation models for human genomics > Results > Benchmark of genomics foundational models
plain- Asserted: passes — The authors put it forward as true.
- Checkable: passes — It can be checked against evidence.
- Load-bearing: unclear — It is unclear whether the paper’s conclusions depend on it.
- Based: passes — The paper gives a reason why it holds.
It may state two separate claims as one.
A result the paper reports from its own data — it cites no other source for it, so there is none to check. The quote shows it is in the paper.
In the paper
“In the case of the Multispecies 2.5B model, the strongest separation at layer 1 was observed between intergenic and genic regions, followed by 5′ UTR regions on layer 5, and a separation between most regions on layer 21”
§ Nucleotide Transformer: building and evaluating robust foundation models for human genomics > Results > Detection of known genomic elements in an unsupervised manner
plaincorrelational- Asserted: passes — The authors put it forward as true.
- Checkable: passes — It can be checked against evidence.
- Load-bearing: unclear — It is unclear whether the paper’s conclusions depend on it.
- Based: passes — The paper gives a reason why it holds.
It may state two separate claims as one.
A result the paper reports from its own data — it cites no other source for it, so there is none to check. The quote shows it is in the paper.
In the paper
“The number of significant attention heads across layers varied markedly across models, with the highest number of significant attention heads observed for the Multispecies 2.5B model for introns (117 out of 640 heads), exons (n = 72) and transcription factor (TF) binding sites (n = 74)”
§ Nucleotide Transformer: building and evaluating robust foundation models for human genomics > Results > Detection of known genomic elements in an unsupervised manner
plaincorrelational- Asserted: passes — The authors put it forward as true.
- Checkable: passes — It can be checked against evidence.
- Load-bearing: unclear — It is unclear whether the paper’s conclusions depend on it.
- Based: passes — The paper gives a reason why it holds.
It may state two separate claims as one.
A result the paper reports from its own data — it cites no other source for it, so there is none to check. The quote shows it is in the paper.
In the paper
“we observed no significant improvement in chromatin and splicing predictions, and only a modest 3% enhancement in enhancer activity predictions”
§ Nucleotide Transformer: building and evaluating robust foundation models for human genomics > Results > The Nucleotide Transformer model accurately predicts genomics tasks
plain- Asserted: passes — The authors put it forward as true.
- Checkable: passes — It can be checked against evidence.
- Load-bearing: passes — The paper’s conclusions depend on it.
- Based: passes — The paper gives a reason why it holds.
It may state two separate claims as one.
A result the paper reports from its own data — it cites no other source for it, so there is none to check. The quote shows it is in the paper.
In the paper
“NT models matched the baseline BPNet models in 5 tasks and exceeded them in 8 out of the 18 tasks through probing alone”
§ Nucleotide Transformer: building and evaluating robust foundation models for human genomics > Results > The Nucleotide Transformer model accurately predicts genomics tasks
plain- Asserted: passes — The authors put it forward as true.
- Checkable: passes — It can be checked against evidence.
- Load-bearing: passes — The paper’s conclusions depend on it.
- Based: passes — The paper gives a reason why it holds.
It may state two separate claims as one.
In the paper
“We also noted that the highest model performance is never achieved by using embeddings from the final layer, as shown in earlier work5.”
§ Nucleotide Transformer: building and evaluating robust foundation models for human genomics > Results > The Nucleotide Transformer model accurately predicts genomics tasks
What the sources say
- Not checked — no full text of the sourcecites [5] Elnaggar, A. et al. ProtTrans: towards cracking the language of life’s code through self-supervised deep learning and high performance computing. IEEE Trans. Pattern Anal. Mach. Intell. 44, 7112–7127 (2022). source
plain- Asserted: passes — The authors put it forward as true.
- Checkable: passes — It can be checked against evidence.
- Load-bearing: fails — The paper’s conclusions may not depend on it.
- Based: passes — The paper gives a reason why it holds.
Probably not a substantial claim. The paper’s conclusions may not depend on it.
A result the paper reports from its own data — it cites no other source for it, so there is none to check. The quote shows it is in the paper.
In the paper
“we adapted the NT model to deliver nucleotide-level splice site predictions and achieved a top-k accuracy of 95% and a precision-recall AUC of 0.98”
§ Nucleotide Transformer: building and evaluating robust foundation models for human genomics > Results > The Nucleotide Transformer model accurately predicts genomics tasks
plain- Asserted: passes — The authors put it forward as true.
- Checkable: passes — It can be checked against evidence.
- Load-bearing: passes — The paper’s conclusions depend on it.
- Based: passes — The paper gives a reason why it holds.
It may state two separate claims as one.
A result the paper reports from its own data — it cites no other source for it, so there is none to check. The quote shows it is in the paper.
In the paper
“Regarding enhancers, the maximum attention percentages were highest for the largest models, with the 1000G 2.5B model, for instance, achieving nearly 100% attention”
§ Nucleotide Transformer: building and evaluating robust foundation models for human genomics > Results > Detection of known genomic elements in an unsupervised manner
plaincorrelational- Asserted: passes — The authors put it forward as true.
- Checkable: passes — It can be checked against evidence.
- Load-bearing: unclear — It is unclear whether the paper’s conclusions depend on it.
- Based: passes — The paper gives a reason why it holds.
It may state two separate claims as one.
A result the paper reports from its own data — it cites no other source for it, so there is none to check. The quote shows it is in the paper.
In the paper
“In comparison to the extensive probing exercise, this technique yielded superior results while using fewer compute resources”
§ Nucleotide Transformer: building and evaluating robust foundation models for human genomics > Discussion
plaindirect- Asserted: passes — The authors put it forward as true.
- Checkable: passes — It can be checked against evidence.
- Load-bearing: passes — The paper’s conclusions depend on it.
- Based: passes — The paper gives a reason why it holds.
It may state two separate claims as one.
The paper states this without a source or data behind it here, so there is nothing to check it against. The quote shows it is in the paper.
In the paper
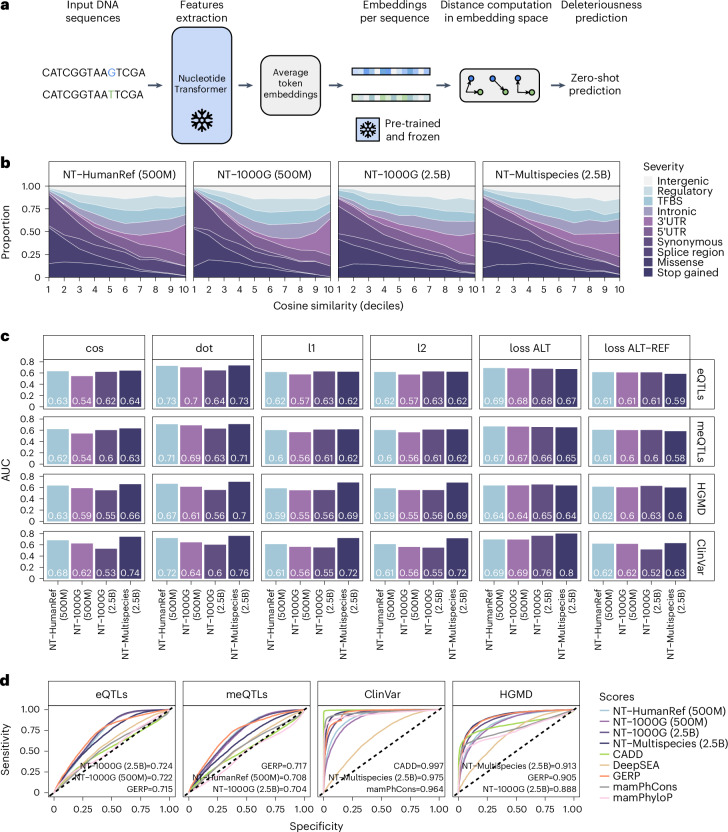
“The best-performing models for prioritizing molecular phenotypes (eQTLs and meQTLs) were those trained on human sequences, whereas the best-performing model for prioritizing pathogenic variants was based on multispecies sequences.”
§ Nucleotide Transformer: building and evaluating robust foundation models for human genomics > Results > The pre-trained embeddings predict the impact of mutations
plaincorrelational- Asserted: passes — The authors put it forward as true.
- Checkable: passes — It can be checked against evidence.
- Load-bearing: passes — The paper’s conclusions depend on it.
- Based: passes — The paper gives a reason why it holds.
It may state two separate claims as one.
A result the paper reports from its own data — it cites no other source for it, so there is none to check. The quote shows it is in the paper.
In the paper
“Of particular interest is the NT-v2 250M-parameter model, which attained the best performance on our benchmark (average MCC of 0.769) while being ten-times smaller than the 2.5B-parameter model (Fig. 5c).”
§ Nucleotide Transformer: building and evaluating robust foundation models for human genomics > Results > Model optimization for cost-effective predictions in genomics
plain- Asserted: passes — The authors put it forward as true.
- Checkable: passes — It can be checked against evidence.
- Load-bearing: passes — The paper’s conclusions depend on it.
- Based: passes — The paper gives a reason why it holds.
It may state two separate claims as one.
A result the paper reports from its own data — it cites no other source for it, so there is none to check. The quote shows it is in the paper.
In the paper
“We have demonstrated that transformer models can match and even outperform other methods for predicting variant effects and deleteriousness.”
§ Nucleotide Transformer: building and evaluating robust foundation models for human genomics > Discussion
boostedcorrelational- Asserted: passes — The authors put it forward as true.
- Checkable: passes — It can be checked against evidence.
- Load-bearing: passes — The paper’s conclusions depend on it.
- Based: passes — The paper gives a reason why it holds.
It may state two separate claims as one.
The paper states this without a source or data behind it here, so there is nothing to check it against. The quote shows it is in the paper.
In the paper
“This probing strategy resulted in 760,000 downstream models trained”
§ Nucleotide Transformer: building and evaluating robust foundation models for human genomics > Methods > Models
plaindirect- Asserted: passes — The authors put it forward as true.
- Checkable: passes — It can be checked against evidence.
- Load-bearing: fails — The paper’s conclusions may not depend on it.
- Based: passes — The paper gives a reason why it holds.
Probably not a substantial claim. The paper’s conclusions may not depend on it.
The paper states this without a source or data behind it here, so there is nothing to check it against. The quote shows it is in the paper.
In the paper
“as it was the model with the highest test set performance”
§ Nucleotide Transformer: building and evaluating robust foundation models for human genomics > Methods > Additional performance analysis
plain- Asserted: passes — The authors put it forward as true.
- Checkable: passes — It can be checked against evidence.
- Load-bearing: passes — The paper’s conclusions depend on it.
- Based: fails — The paper may give no reason why it holds.
Probably not a substantial claim. The paper may give no reason why it holds.
A result the paper reports from its own data — it cites no other source for it, so there is none to check. The quote shows it is in the paper.
In the paper
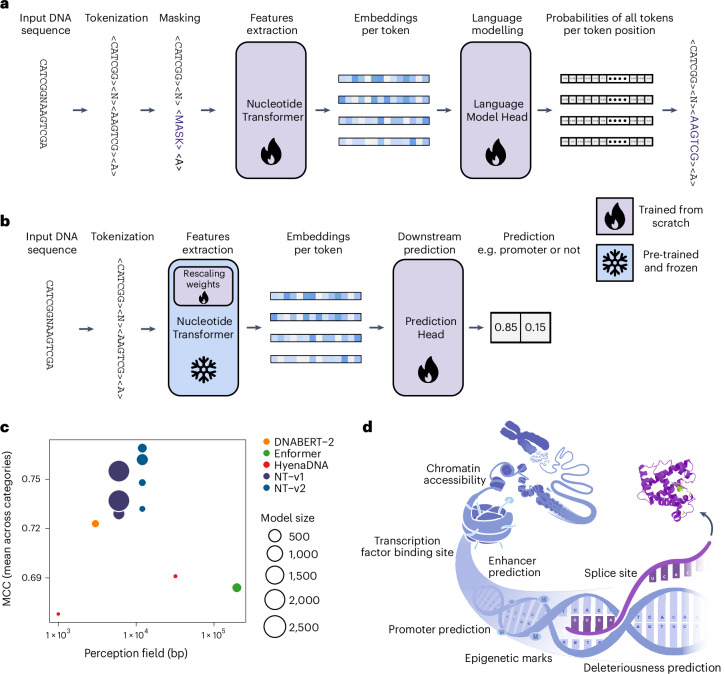
“Our results, based on distinct genomic prediction tasks, demonstrate that both intra-species (when training on multiple genomes of a single species) and inter-species (on genomes across different species) variability significantly influences accuracy across tasks (Figs. 1c and 2a).”
§ Nucleotide Transformer: building and evaluating robust foundation models for human genomics > Discussion
boosteddirect- Asserted: passes — The authors put it forward as true.
- Checkable: passes — It can be checked against evidence.
- Load-bearing: passes — The paper’s conclusions depend on it.
- Based: passes — The paper gives a reason why it holds.
It may state two separate claims as one.
A result the paper reports from its own data — it cites no other source for it, so there is none to check. The quote shows it is in the paper.
In the paper
“Indeed, the NT-v2 250M- and 500M-parameter model managed to achieve improved performance over the 2.5B-parameter multispecies model while maintaining a significantly leaner parameter count and doubling the perception field.”
§ Nucleotide Transformer: building and evaluating robust foundation models for human genomics > Results > Model optimization for cost-effective predictions in genomics
plaindirect- Asserted: passes — The authors put it forward as true.
- Checkable: passes — It can be checked against evidence.
- Load-bearing: passes — The paper’s conclusions depend on it.
- Based: passes — The paper gives a reason why it holds.
It may state two separate claims as one.
A result the paper reports from its own data — it cites no other source for it, so there is none to check. The quote shows it is in the paper.
In the paper
“we have demonstrated that the models have acquired the ability not only to reconstruct genetic variants (Supplementary Note) but also to recognize key regulatory genomic elements.”
§ Nucleotide Transformer: building and evaluating robust foundation models for human genomics > Discussion
boosted- Asserted: passes — The authors put it forward as true.
- Checkable: passes — It can be checked against evidence.
- Load-bearing: passes — The paper’s conclusions depend on it.
- Based: passes — The paper gives a reason why it holds.
It may state two separate claims as one.
The paper states this without a source or data behind it here, so there is nothing to check it against. The quote shows it is in the paper.
In the paper
“We successfully constructed a model that achieves the performance of our previous best model with only one-tenth the number of parameters and while doubling the perception field size.”
§ Nucleotide Transformer: building and evaluating robust foundation models for human genomics > Main
plaindirect- Asserted: passes — The authors put it forward as true.
- Checkable: passes — It can be checked against evidence.
- Load-bearing: passes — The paper’s conclusions depend on it.
- Based: passes — The paper gives a reason why it holds.
It may state two separate claims as one.
The paper states this without a source or data behind it here, so there is nothing to check it against. The quote shows it is in the paper.
In the paper
“Notably, this fine-tuning approach only requires 0.1% of the total number of parameters, allowing even our largest models to be fine-tuned in under 15 min on a single GPU.”
§ Nucleotide Transformer: building and evaluating robust foundation models for human genomics > Discussion
plaindirect- Asserted: passes — The authors put it forward as true.
- Checkable: passes — It can be checked against evidence.
- Load-bearing: passes — The paper’s conclusions depend on it.
- Based: passes — The paper gives a reason why it holds.
It may state two separate claims as one.
A result the paper reports from its own data — it cites no other source for it, so there is none to check. The quote shows it is in the paper.
In the paper
“Compared to the NT 6-kb models, our NT-v2 500M 12-kb model improved performance by 1% to a top-k accuracy of 96% and a precision-recall AUC of 0.98 (Fig. 5e).”
§ Nucleotide Transformer: building and evaluating robust foundation models for human genomics > Results > Model optimization for cost-effective predictions in genomics
plaindirect- Asserted: passes — The authors put it forward as true.
- Checkable: passes — It can be checked against evidence.
- Load-bearing: unclear — It is unclear whether the paper’s conclusions depend on it.
- Based: passes — The paper gives a reason why it holds.
It may state two separate claims as one.
A result the paper reports from its own data — it cites no other source for it, so there is none to check. The quote shows it is in the paper.
In the paper
“After these filters, we retained a total of 80,590, 11,734, 70,224 and 14,626 genetic variants for the eQTLs, meQTLs, ClinVar and HGMD SNP datasets, respectively.”
§ Nucleotide Transformer: building and evaluating robust foundation models for human genomics > Methods > Additional performance analysis
plain- Asserted: passes — The authors put it forward as true.
- Checkable: passes — It can be checked against evidence.
- Load-bearing: passes — The paper’s conclusions depend on it.
- Based: passes — The paper gives a reason why it holds.
Probably not a substantial claim. It may state two separate claims as one.
In the paper
“This resulted in 29,598 promoter regions, 3,065 of which were TATA-box promoters (using the motif annotation at https://epd.expasy.org/ftp/epdnew/H_sapiens/006/db/promoter_motifs.txt).”
§ Nucleotide Transformer: building and evaluating robust foundation models for human genomics > Methods > Nucleotide Transformer downstream tasks
What the sources say
- Not matchedcites Eukaryotic Promoter Database30
Couldn’t be matched to a paper in Crossref, so it can’t be checked.
plain- Asserted: passes — The authors put it forward as true.
- Checkable: passes — It can be checked against evidence.
- Load-bearing: unclear — It is unclear whether the paper’s conclusions depend on it.
- Based: passes — The paper gives a reason why it holds.
It may state two separate claims as one.
- Not matched
A result the paper reports from its own data — it cites no other source for it, so there is none to check. The quote shows it is in the paper.
In the paper
“After keeping only SNPs and filtering out variants annotated to more than one consequence (for example those annotated as stop-gained and splice variants), we obtained a final dataset composed of 920 genetic variants per class.”
§ Nucleotide Transformer: building and evaluating robust foundation models for human genomics > Methods > Additional performance analysis
plaindirect- Asserted: passes — The authors put it forward as true.
- Checkable: passes — It can be checked against evidence.
- Load-bearing: fails — The paper’s conclusions may not depend on it.
- Based: passes — The paper gives a reason why it holds.
Probably not a substantial claim. The paper’s conclusions may not depend on it.
What the paper did — it cites no source for this, so there is none to check. The quote shows it is in the paper.
In the paper
“These datasets were processed into a standardized format to facilitate experimentation and ensure reproducibility in the assessment of large LM performance (Methods).”
§ Nucleotide Transformer: building and evaluating robust foundation models for human genomics > Results > The Nucleotide Transformer model accurately predicts genomics tasks
plaindirect- Asserted: passes — The authors put it forward as true.
- Checkable: passes — It can be checked against evidence.
- Load-bearing: fails — The paper’s conclusions may not depend on it.
- Based: passes — The paper gives a reason why it holds.
Probably not a substantial claim. The paper’s conclusions may not depend on it.
What the paper did — it cites no source for this, so there is none to check. The quote shows it is in the paper.
In the paper
“To ensure a fair and accurate comparison between different models, we implemented a tenfold cross-validation strategy.”
§ Nucleotide Transformer: building and evaluating robust foundation models for human genomics > Results > The Nucleotide Transformer model accurately predicts genomics tasks
plaindirect- Asserted: passes — The authors put it forward as true.
- Checkable: passes — It can be checked against evidence.
- Load-bearing: passes — The paper’s conclusions depend on it.
- Based: passes — The paper gives a reason why it holds.
Probably not a substantial claim.
A conclusion the paper draws from its own results — it cites no other source for it, so there is none to check. The quote shows it is in the paper.
In the paper
“Altogether, our extensive benchmarks and results demonstrate the flexibility and performance of NT as a general approach to tackle many diverse genomics tasks with high accuracy.”
§ Nucleotide Transformer: building and evaluating robust foundation models for human genomics > Results > The Nucleotide Transformer model accurately predicts genomics tasks
boosted- Asserted: passes — The authors put it forward as true.
- Checkable: passes — It can be checked against evidence.
- Load-bearing: passes — The paper’s conclusions depend on it.
- Based: passes — The paper gives a reason why it holds.
It may state two separate claims as one.
A conclusion the paper draws from its own results — it cites no other source for it, so there is none to check. The quote shows it is in the paper.
In the paper
“Collectively, these results illustrate how the NT models have acquired the ability to recover gene structure and functional properties of genomic sequences and integrate them directly into its attention mechanism.”
§ Nucleotide Transformer: building and evaluating robust foundation models for human genomics > Results > Detection of known genomic elements in an unsupervised manner
plaindirect- Asserted: passes — The authors put it forward as true.
- Checkable: passes — It can be checked against evidence.
- Load-bearing: passes — The paper’s conclusions depend on it.
- Based: passes — The paper gives a reason why it holds.
It may state two separate claims as one.
A conclusion the paper draws from its own results — it cites no other source for it, so there is none to check. The quote shows it is in the paper.
In the paper
“This demonstrated that the NT models have learned to detect known genomic elements within their embeddings in an unsupervised manner, which can be harnessed for efficient downstream genomics task predictions.”
§ Nucleotide Transformer: building and evaluating robust foundation models for human genomics > Results > Detection of known genomic elements in an unsupervised manner
boosteddirect- Asserted: passes — The authors put it forward as true.
- Checkable: passes — It can be checked against evidence.
- Load-bearing: passes — The paper’s conclusions depend on it.
- Based: passes — The paper gives a reason why it holds.
It may state two separate claims as one.
A conclusion the paper draws from its own results — it cites no other source for it, so there is none to check. The quote shows it is in the paper.
In the paper
“This encoded information should prove helpful in evaluating the significance of genetic variants.”
§ Nucleotide Transformer: building and evaluating robust foundation models for human genomics > Results > Detection of known genomic elements in an unsupervised manner
hedgedconditional- Asserted: passes — The authors put it forward as true.
- Checkable: fails — It may be too vague to check against evidence.
- Load-bearing: passes — The paper’s conclusions depend on it.
- Based: passes — The paper gives a reason why it holds.
Probably not a substantial claim. It may be too vague to check against evidence.
A result the paper reports from its own data — it cites no other source for it, so there is none to check. The quote shows it is in the paper.
In the paper
“The Human reference dataset was constructed by considering all autosomal and sex chromosomes sequences from the reference assembly GRCh38/hg38 (https://www.ncbi.nlm.nih.gov/assembly/GCF_000001405.26) and reached a total of 3.2 billion nucleotides.”
§ Nucleotide Transformer: building and evaluating robust foundation models for human genomics > Methods > Pre-training datasets
plain- Asserted: passes — The authors put it forward as true.
- Checkable: passes — It can be checked against evidence.
- Load-bearing: fails — The paper’s conclusions may not depend on it.
- Based: passes — The paper gives a reason why it holds.
Probably not a substantial claim. The paper’s conclusions may not depend on it.
What the paper did — it cites no source for this, so there is none to check. The quote shows it is in the paper.
In the paper
“The total number of heads of each model was used as a Bonferroni correction to the significance level (α) of 0.05.”
§ Nucleotide Transformer: building and evaluating robust foundation models for human genomics > Methods > Additional performance analysis
plaindirect- Asserted: passes — The authors put it forward as true.
- Checkable: passes — It can be checked against evidence.
- Load-bearing: passes — The paper’s conclusions depend on it.
- Based: passes — The paper gives a reason why it holds.
Probably not a substantial claim.
What the paper did — it cites no source for this, so there is none to check. The quote shows it is in the paper.
In the paper
“For a consistent performance evaluation across tasks, we used the binary or multi-class MCC as the metric as it is robust to uneven label ratios.”
§ Nucleotide Transformer: building and evaluating robust foundation models for human genomics > Methods > Nucleotide Transformer downstream tasks
plaindirect- Asserted: passes — The authors put it forward as true.
- Checkable: passes — It can be checked against evidence.
- Load-bearing: passes — The paper’s conclusions depend on it.
- Based: passes — The paper gives a reason why it holds.
Probably not a substantial claim.
What the paper did — it cites no source for this, so there is none to check. The quote shows it is in the paper.
In the paper
“We employed a similar strategy to the one previously described, with the primary difference being that the training and test sets were divided by chromosomes and strictly kept as nonoverlapping.”
§ Nucleotide Transformer: building and evaluating robust foundation models for human genomics > Methods > Additional performance analysis
plain- Asserted: passes — The authors put it forward as true.
- Checkable: passes — It can be checked against evidence.
- Load-bearing: passes — The paper’s conclusions depend on it.
- Based: passes — The paper gives a reason why it holds.
Probably not a substantial claim.
What the paper did — it cites no source for this, so there is none to check. The quote shows it is in the paper.
In the paper
“We used a tenfold cross-validation scheme to evaluate each model, where the training set is split into ten folds, and each time we used nine of those parts for training and reserved one-tenth for validation and selecting the final checkpoint.”
§ Nucleotide Transformer: building and evaluating robust foundation models for human genomics > Methods > Nucleotide Transformer downstream tasks
plain- Asserted: passes — The authors put it forward as true.
- Checkable: passes — It can be checked against evidence.
- Load-bearing: passes — The paper’s conclusions depend on it.
- Based: passes — The paper gives a reason why it holds.
Probably not a substantial claim.
What the paper did — it cites no source for this, so there is none to check. The quote shows it is in the paper.
In the paper
“For a final comparison across models, we calculated for each model the mean MCC across the three different categories of task (chromatin profiles, regulatory elements and splicing), where for each category we used the median MCC across tasks.”
§ Nucleotide Transformer: building and evaluating robust foundation models for human genomics > Methods > Nucleotide Transformer downstream tasks
plain- Asserted: passes — The authors put it forward as true.
- Checkable: passes — It can be checked against evidence.
- Load-bearing: passes — The paper’s conclusions depend on it.
- Based: passes — The paper gives a reason why it holds.
Probably not a substantial claim.
What the paper did — it cites no source for this, so there is none to check. The quote shows it is in the paper.
In the paper
“Model training and performance evaluation were performed on different sets of chromosomes from the human genome. Namely, sequences from chromosomes 20 and 21 were used for the test and the remainder were used for training the different models.”
§ Nucleotide Transformer: building and evaluating robust foundation models for human genomics > Methods > Nucleotide Transformer downstream tasks
plain- Asserted: passes — The authors put it forward as true.
- Checkable: passes — It can be checked against evidence.
- Load-bearing: passes — The paper’s conclusions depend on it.
- Based: passes — The paper gives a reason why it holds.
Probably not a substantial claim.
What the paper did — it cites no source for this, so there is none to check. The quote shows it is in the paper.
In the paper
“We used the median performance across the ten folds as the final performance metric of each model on a given task.”
§ Nucleotide Transformer: building and evaluating robust foundation models for human genomics > Methods > Nucleotide Transformer downstream tasks
plain- Asserted: passes — The authors put it forward as true.
- Checkable: passes — It can be checked against evidence.
- Load-bearing: fails — The paper’s conclusions may not depend on it.
- Based: passes — The paper gives a reason why it holds.
Probably not a substantial claim. The paper’s conclusions may not depend on it.
What the paper did — it cites no source for this, so there is none to check. The quote shows it is in the paper.
In the paper
“Attention heads with P values below the Bonferroni-corrected significance level were considered to be significant.”
§ Nucleotide Transformer: building and evaluating robust foundation models for human genomics > Methods > Additional performance analysis
plain- Asserted: passes — The authors put it forward as true.
- Checkable: passes — It can be checked against evidence.
- Load-bearing: passes — The paper’s conclusions depend on it.
- Based: passes — The paper gives a reason why it holds.
Probably not a substantial claim.
What the paper did — it cites no source for this, so there is none to check. The quote shows it is in the paper.
In the paper
“We used a tenfold validation scheme, where the training dataset was split ten times in a training and validation set, that contain different shuffles with 90% and 10% of the initial set.”
§ Nucleotide Transformer: building and evaluating robust foundation models for human genomics > Methods > Models
plain- Asserted: passes — The authors put it forward as true.
- Checkable: passes — It can be checked against evidence.
- Load-bearing: fails — The paper’s conclusions may not depend on it.
- Based: passes — The paper gives a reason why it holds.
Probably not a substantial claim. The paper’s conclusions may not depend on it.
What the paper did — it cites no source for this, so there is none to check. The quote shows it is in the paper.
In the paper
“We considered that a feature was captured by an attention head if the quantity pα(f) was significantly greater than the natural occurring frequency of the feature within the dataset (Supplementary Table 10).”
§ Nucleotide Transformer: building and evaluating robust foundation models for human genomics > Methods > Additional performance analysis
plain- Asserted: passes — The authors put it forward as true.
- Checkable: passes — It can be checked against evidence.
- Load-bearing: passes — The paper’s conclusions depend on it.
- Based: passes — The paper gives a reason why it holds.
Probably not a substantial claim.
The paper states this without a source or data behind it here, so there is nothing to check it against. The quote shows it is in the paper.
In the paper
“To put this in perspective, this length is 24× and 4× larger than the respective average context lengths of DNABERT-1 (500 bp) and DNABERT-2 (3 kb).”
§ Nucleotide Transformer: building and evaluating robust foundation models for human genomics > Discussion
plain- Asserted: passes — The authors put it forward as true.
- Checkable: passes — It can be checked against evidence.
- Load-bearing: fails — The paper’s conclusions may not depend on it.
- Based: passes — The paper gives a reason why it holds.
Probably not a substantial claim. The paper’s conclusions may not depend on it. It may state two separate claims as one.
A conclusion the paper draws from its own results — it cites no other source for it, so there is none to check. The quote shows it is in the paper.
In the paper
“In summary, these results affirmed the utility and effectiveness of both NT v1 and v2 models for a wide range of genomics tasks, requiring minimal modifications and computing power while achieving high accuracy.”
§ Nucleotide Transformer: building and evaluating robust foundation models for human genomics > Results > Model optimization for cost-effective predictions in genomics
plain- Asserted: passes — The authors put it forward as true.
- Checkable: passes — It can be checked against evidence.
- Load-bearing: passes — The paper’s conclusions depend on it.
- Based: passes — The paper gives a reason why it holds.
It may state two separate claims as one.
In the paper
“Perplexity measures how well a model can reconstruct masked positions and is a more-refined measure than accuracy as it does also account for magnitude. In contrast to accuracy, lower perplexity suggests better reconstruction ability, thus better performance.”
§ Nucleotide Transformer: building and evaluating robust foundation models for human genomics > Methods > Additional performance analysis
What the sources say
- Not matchedcites Rives4
Couldn’t be matched to a paper in Crossref, so it can’t be checked.
hedgedcorrelational- Asserted: passes — The authors put it forward as true.
- Checkable: passes — It can be checked against evidence.
- Load-bearing: fails — The paper’s conclusions may not depend on it.
- Based: passes — The paper gives a reason why it holds.
Probably not a substantial claim. The paper’s conclusions may not depend on it. It may state two separate claims as one.
- Not matched
A conclusion the paper draws from its own results — it cites no other source for it, so there is none to check. The quote shows it is in the paper.
In the paper
“These advanced models not only exhibit improved downstream performance but also offer the advantage of being suitable for execution and fine-tuning on economical hardware.”
§ Nucleotide Transformer: building and evaluating robust foundation models for human genomics > Discussion
plaindirect- Asserted: passes — The authors put it forward as true.
- Checkable: passes — It can be checked against evidence.
- Load-bearing: passes — The paper’s conclusions depend on it.
- Based: passes — The paper gives a reason why it holds.
It may state two separate claims as one.
A conclusion the paper draws from its own results — it cites no other source for it, so there is none to check. The quote shows it is in the paper.
In the paper
“it is possible that the multispecies model leveraged sequence variation across species to learn about the degree of conservation across sites.”
§ Nucleotide Transformer: building and evaluating robust foundation models for human genomics > Results > The pre-trained embeddings predict the impact of mutations
hedgedconditional- Asserted: passes — The authors put it forward as true.
- Checkable: passes — It can be checked against evidence.
- Load-bearing: fails — The paper’s conclusions may not depend on it.
- Based: passes — The paper gives a reason why it holds.
Probably not a substantial claim. The paper’s conclusions may not depend on it.
- Rests on an assumption: The most severely pathogenic variants tend to impact gene function due to amino acid changes.
What the paper did — it cites no source for this, so there is none to check. The quote shows it is in the paper.
In the paper
“Annotations were filtered to exclude level-3 transcripts (automated annotation), so that all training data were annotated by a human.”
§ Nucleotide Transformer: building and evaluating robust foundation models for human genomics > Methods > Nucleotide Transformer downstream tasks
plaindirect- Asserted: passes — The authors put it forward as true.
- Checkable: passes — It can be checked against evidence.
- Load-bearing: fails — The paper’s conclusions may not depend on it.
- Based: passes — The paper gives a reason why it holds.
Probably not a substantial claim. The paper’s conclusions may not depend on it.
What the paper did — it cites no source for this, so there is none to check. The quote shows it is in the paper.
In the paper
“To validate this, we conducted a two-proportion z-test with the null hypothesis as the natural frequency of the feature, and the alternate hypothesis as pα(f).”
§ Nucleotide Transformer: building and evaluating robust foundation models for human genomics > Methods > Additional performance analysis
plain- Asserted: passes — The authors put it forward as true.
- Checkable: passes — It can be checked against evidence.
- Load-bearing: passes — The paper’s conclusions depend on it.
- Based: passes — The paper gives a reason why it holds.
Probably not a substantial claim.
What the paper did — it cites no source for this, so there is none to check. The quote shows it is in the paper.
In the paper
“To ensure that each embedding is associated with a six-mer, the sequences were cut so that their length was divisible by 6.”
§ Nucleotide Transformer: building and evaluating robust foundation models for human genomics > Methods > Additional downstream tasks
plaincorrelational- Asserted: passes — The authors put it forward as true.
- Checkable: passes — It can be checked against evidence.
- Load-bearing: passes — The paper’s conclusions depend on it.
- Based: passes — The paper gives a reason why it holds.
Probably not a substantial claim.
What the paper did — it cites no source for this, so there is none to check. The quote shows it is in the paper.
In the paper
“For the sake of benchmarking, we reused the provided model torso as a pretrained model for our benchmark, which is not the intended and recommended use of the original paper”
§ Nucleotide Transformer: building and evaluating robust foundation models for human genomics > Methods > Models
plain- Asserted: passes — The authors put it forward as true.
- Checkable: passes — It can be checked against evidence.
- Load-bearing: passes — The paper’s conclusions depend on it.
- Based: passes — The paper gives a reason why it holds.
Probably not a substantial claim.
A result the paper reports from its own data — it cites no other source for it, so there is none to check. The quote shows it is in the paper.
In the paper
“The resulting collection of genomes was downsampled to a total of 850 species, whose genomes add up to 174 billion nucleotides.”
§ Nucleotide Transformer: building and evaluating robust foundation models for human genomics > Methods > Pre-training datasets
plain- Asserted: passes — The authors put it forward as true.
- Checkable: passes — It can be checked against evidence.
- Load-bearing: unclear — It is unclear whether the paper’s conclusions depend on it.
- Based: passes — The paper gives a reason why it holds.
It may state two separate claims as one.
A result the paper reports from its own data — it cites no other source for it, so there is none to check. The quote shows it is in the paper.
In the paper
“The dataset contained 3,202 high-coverage human genomes, originating from 27 geographically structured populations of African, American, East Asian and European ancestry as detailed in Supplementary Table 2, making up a total of 20.5 trillion nucleotides.”
§ Nucleotide Transformer: building and evaluating robust foundation models for human genomics > Methods > Pre-training datasets
plain- Asserted: passes — The authors put it forward as true.
- Checkable: passes — It can be checked against evidence.
- Load-bearing: unclear — It is unclear whether the paper’s conclusions depend on it.
- Based: passes — The paper gives a reason why it holds.
It may state two separate claims as one.
What the paper did — it cites no source for this, so there is none to check. The quote shows it is in the paper.
In the paper
“Only for HyenaDNA we performed full fine-tuning due to the incompatibility of our parameter-efficient fine-tuning approach with the model architecture.”
§ Nucleotide Transformer: building and evaluating robust foundation models for human genomics > Methods > Models
plaindirect- Asserted: passes — The authors put it forward as true.
- Checkable: passes — It can be checked against evidence.
- Load-bearing: fails — The paper’s conclusions may not depend on it.
- Based: passes — The paper gives a reason why it holds.
Probably not a substantial claim. The paper’s conclusions may not depend on it.
What the paper did — it cites no source for this, so there is none to check. The quote shows it is in the paper.
In the paper
“Furthermore, all sequences with Ns were removed from both training and test set, which represented a negligible portion of the data.”
§ Nucleotide Transformer: building and evaluating robust foundation models for human genomics > Methods > Additional downstream tasks
plain- Asserted: passes — The authors put it forward as true.
- Checkable: passes — It can be checked against evidence.
- Load-bearing: fails — The paper’s conclusions may not depend on it.
- Based: passes — The paper gives a reason why it holds.
Probably not a substantial claim. The paper’s conclusions may not depend on it. It may state two separate claims as one.
A result the paper reports from its own data — it cites no other source for it, so there is none to check. The quote shows it is in the paper.
In the paper
“To allow haplotype reconstruction in the FASTA format from the VCF files, we considered the phased version of the data, which corresponded to a total of 125 million mutations, 111 million and 14 million of which are single-nucleotide polymorphisms (SNPs) and indels, respectively.”
§ Nucleotide Transformer: building and evaluating robust foundation models for human genomics > Methods > Pre-training datasets
plain- Asserted: passes — The authors put it forward as true.
- Checkable: passes — It can be checked against evidence.
- Load-bearing: unclear — It is unclear whether the paper’s conclusions depend on it.
- Based: passes — The paper gives a reason why it holds.
It may state two separate claims as one.
A conclusion the paper draws from its own results — it cites no other source for it, so there is none to check. The quote shows it is in the paper.
In the paper
“This suggests that transformer models trained on diverse species have learned to capture genomic features that likely have functional importance across species, thus enabling better generalization in various human-based prediction tasks.”
§ Nucleotide Transformer: building and evaluating robust foundation models for human genomics > Discussion
hedgeddirect- Asserted: passes — The authors put it forward as true.
- Checkable: passes — It can be checked against evidence.
- Load-bearing: passes — The paper’s conclusions depend on it.
- Based: passes — The paper gives a reason why it holds.
It may state two separate claims as one.
None of the sources cited for this claim could be matched to a paper in Crossref, so there is nothing to check it against.
In the paper
“In brief, this training dataset was constructed using GENCODE V24lift37 annotations and RNA-seq data from the GTEx cohort, focusing solely on splice site annotations from the principal transcript.”
§ Nucleotide Transformer: building and evaluating robust foundation models for human genomics > Methods > Additional downstream tasks
What the sources say
- Not matchedcites SpliceAI36
Couldn’t be matched to a paper in Crossref, so it can’t be checked.
- Not matchedcites GENCODE V24lift37
Couldn’t be matched to a paper in Crossref, so it can’t be checked.
- Not matchedcites GTEx
Couldn’t be matched to a paper in Crossref, so it can’t be checked.
plain- Asserted: passes — The authors put it forward as true.
- Checkable: passes — It can be checked against evidence.
- Load-bearing: fails — The paper’s conclusions may not depend on it.
- Based: passes — The paper gives a reason why it holds.
Probably not a substantial claim. The paper’s conclusions may not depend on it. It may state two separate claims as one.
- Not matched
In the paper
“Following the methodology used elsewhere3, we chose to treat this regression task as a multilabel classification problem.”
§ Nucleotide Transformer: building and evaluating robust foundation models for human genomics > Methods > Additional downstream tasks
What the sources say
- Not matchedcites elsewhere3
Couldn’t be matched to a paper in Crossref, so it can’t be checked.
plain- Asserted: passes — The authors put it forward as true.
- Checkable: passes — It can be checked against evidence.
- Load-bearing: fails — The paper’s conclusions may not depend on it.
- Based: passes — The paper gives a reason why it holds.
Probably not a substantial claim. The paper’s conclusions may not depend on it.
- Not matched
In the paper
“The training dataset comprised annotations from genes located on chromosomes 2, 4, 6, 8 and 10–22, as well as chromosomes X and Y, while annotations from genes on the remaining chromosomes, which were not paralogs, constituted the test dataset.”
§ Nucleotide Transformer: building and evaluating robust foundation models for human genomics > Methods > Additional downstream tasks
What the sources say
- Not matchedcites SpliceAI36
Couldn’t be matched to a paper in Crossref, so it can’t be checked.
plain- Asserted: passes — The authors put it forward as true.
- Checkable: passes — It can be checked against evidence.
- Load-bearing: fails — The paper’s conclusions may not depend on it.
- Based: passes — The paper gives a reason why it holds.
Probably not a substantial claim. The paper’s conclusions may not depend on it. It may state two separate claims as one.
- Not matched
In the paper
“For each of these four datasets, we then constructed a set of negative variants based on SNPs from the 1000G Project with a minor allele frequency >5% that did not overlap with any variant reported in the dataset tested and that were within 100 kb of the associated variants, resulting in four balanced datasets.”
§ Nucleotide Transformer: building and evaluating robust foundation models for human genomics > Methods > Additional performance analysis
What the sources say
- Not matchedcites 1000G Project
Couldn’t be matched to a paper in Crossref, so it can’t be checked.
plain- Asserted: passes — The authors put it forward as true.
- Checkable: passes — It can be checked against evidence.
- Load-bearing: passes — The paper’s conclusions depend on it.
- Based: passes — The paper gives a reason why it holds.
Probably not a substantial claim.
- Not matched
What the paper did — it cites no source for this, so there is none to check. The quote shows it is in the paper.
In the paper
“As each label is highly unbalanced and is composed mostly of negative samples, the losses associated with positive samples are upscaled by a factor of 8.”
§ Nucleotide Transformer: building and evaluating robust foundation models for human genomics > Methods > Additional downstream tasks
plaindirect- Asserted: passes — The authors put it forward as true.
- Checkable: passes — It can be checked against evidence.
- Load-bearing: fails — The paper’s conclusions may not depend on it.
- Based: passes — The paper gives a reason why it holds.
Probably not a substantial claim. The paper’s conclusions may not depend on it. It may state two separate claims as one.
In the paper
“Each sequence produced by this pipeline had a length of 15,000 bp, with the central 5,000 bp containing the sites to be predicted.”
§ Nucleotide Transformer: building and evaluating robust foundation models for human genomics > Methods > Additional downstream tasks
What the sources say
- Not matchedcites SpliceAI36
Couldn’t be matched to a paper in Crossref, so it can’t be checked.
plain- Asserted: passes — The authors put it forward as true.
- Checkable: passes — It can be checked against evidence.
- Load-bearing: fails — The paper’s conclusions may not depend on it.
- Based: passes — The paper gives a reason why it holds.
Probably not a substantial claim. The paper’s conclusions may not depend on it. It may state two separate claims as one.
- Not matched
The paper relies on this without support.
The most severely pathogenic variants tend to impact gene function due to amino acid changes.
“Given that the most severely pathogenic variants tend to impact gene function due to amino acid changes”
The paper relies on this without support.
The 18 downstream genomic prediction tasks are representative of a wide range of genomics tasks.
“In summary, these results affirmed the utility and effectiveness of both NT v1 and v2 models for a wide range of genomics tasks”
Claims other papers make about this one
Each is checked against this paper’s own text: does it say what the citing paper says it does?
The cited source says what the claim attributes to it.
In the citing paper
“This includes constructing large foundation models for genomics [186], clinical images [187], and clinical text learning [188].”
From Challenges in AI-driven Biomedical Multimodal Data Fusion and Analysis (2025) · cites this paper as [186]
Self-check
Percentages, sums and reported differences re-computed from the paper’s own numbers.
Each contradiction between two passages listed here was confirmed by an independent check.
Rated minor: it would not touch a result — a value no result rests on, a p-value that stays on the same side of the significance level, or a conflict that is clerical, resolved elsewhere in the paper, or outside its own findings.
In the paper
§ Nucleotide Transformer: building and evaluating robust foundation models for human genomics > Methods > Models
“Specifically, we pre-trained our NT-v2 50M- and 250M-parameters models for 300 billion tokens, while our ‘250M’ and ‘500M’ parameters models were trained for up to 1 trillion tokens to understand the scaling laws at play.”
§ Nucleotide Transformer: building and evaluating robust foundation models for human genomics > Methods > Models
“In the end we used the following model checkpoints for the NT-v2 models: checkpoint 300 billion tokens for the ‘50M’ and ‘100M’ models, checkpoint 800 billion tokens for the ‘250M’ model and checkpoint 900 billion tokens for the ‘500M’ model.”
Rated minor: it would not touch a result — a value no result rests on, a p-value that stays on the same side of the significance level, or a conflict that is clerical, resolved elsewhere in the paper, or outside its own findings.
In the paper
§ Nucleotide Transformer: building and evaluating robust foundation models for human genomics > Results > The pre-trained embeddings predict the impact of mutations
“This is in accordance with the level of attention observed across layers and heads, especially for relevant regulatory sequences such as enhancers (Fig. 3a) and promoters (Supplementary Fig. 13), which have been shown to be enriched in meQTLs and eQTLs41–43.”
§ Nucleotide Transformer: building and evaluating robust foundation models for human genomics > Results > Detection of known genomic elements in an unsupervised manner
“a, t-SNE projections of embeddings of five genomic elements from layer 1, 5 and 21 based on the Multispecies 2.5B model. b, Accuracy estimates based on probing to classify five genomic elements across layers. c, Schematic describing the evaluation of attention levels at a given genomic element. d, Attention percentages per head and layer across the Multispecies 2.5B model computed on 5′ UTR, exon, enhancer and promoter regions.”
Citations
Cites
Adam: A Method for Stochastic Optimization
Kingma, D. P., & Ba, J. (2014) · arXiv · doi:10.48550/arxiv.1412.6980 · Cited by 98,946
BERT: Pre-training of Deep Bidirectional Transformers for Language Understanding
Devlin, J., Chang, M.-W., Lee, K., & Toutanova, K. (2018) · arXiv · doi:10.48550/arxiv.1810.04805 · Cited by 73,173
Scikit-learn: Machine Learning in Python
Pedregosa, F., Varoquaux, G., Gramfort, A., Michel, V., Thirion, B., Grisel, O., Blondel, M., Müller, A., Nothman, J., Louppe, G., et al. (2012) · arXiv · doi:10.48550/arxiv.1201.0490 · Cited by 71,016 · cited 2×
“We tested logistic regression with the default hyperparameters from scikit-learn 53 and an MLP.”
Highly accurate protein structure prediction with AlphaFold
Jumper, J., Evans, R., Pritzel, A., Green, T., Figurnov, M., Ronneberger, O., Tunyasuvunakool, K., Bates, R., Žídek, A., Potapenko, A., et al. (2021) · Nature · doi:10.1038/s41586-021-03819-2 · Cited by 43,764 · cited 3×
“Early instances of foundation models applying this objective to biology involved training LMs on protein sequences, where they were tasked with predicting masked amino acids in large protein sequence datasets 3–5 .”
Language Models are Few-Shot Learners
Brown, T. B., Mann, B., Ryder, N., Subbiah, M., Kaplan, J., Dhariwal, P., Neelakantan, A., Shyam, P., Sastry, G., Askell, A., et al. (2020) · arXiv · doi:10.48550/arxiv.2005.14165 · Cited by 23,372 · cited 1×
“LMs have been primarily developed within NLP to model spoken languages 1,2 .”
A global reference for human genetic variation
The 1000 Genomes Project Consortium, authors, C., Auton, A., Abecasis, G. R., Steering committee, Altshuler, D. M., Durbin, R. M., Abecasis, G. R., Bentley, D. R., Chakravarti, A., et al. (2015) · Nature · doi:10.1038/nature15393 · Cited by 18,247 · cited 1×
“…a 500-million-parameter model (‘1000G 500M’) and (3) a 2.5-billion-parameter model (‘1000G 2.5B’) both trained on 3,202 genetically diverse human genomes 28 ; and (4) a 2.5-billion-parameter model, encompassing 850 species from diverse phyla (‘Multispecies 2.5B’), including 11 model organisms (Fig.”
InfluentialAn integrated encyclopedia of DNA elements in the human genome
The ENCODE Project Consortium (2012) · Nature · doi:10.1038/nature11247 · Cited by 18,072 · cited 1×
“…publicly available resources encompassing splice site prediction tasks (GEN-CODE 29 ), promoter tasks (Eukaryotic Promoter Database 30 ) and histone modification and enhancer tasks (ENCODE 31–33 ), each designed to be of reasonable size to enable fast and rigorous cross-validation procedures (Fig.”
Graph-based genome alignment and genotyping with HISAT2 and HISAT-genotype
Kim, D., Paggi, J. M., Park, C., Bennett, C., & Salzberg, S. L. (2019) · Nature Biotechnology · doi:10.1038/s41587-019-0201-4 · Cited by 15,022
Scikit-learn: Machine Learning in Python
(2011) · Journal of Machine Learning Research · doi:10.5555/1953048.2078195 · Cited by 8,539
The Ensembl Variant Effect Predictor
McLaren, W., Gil, L., Hunt, S. E., Riat, H. S., Ritchie, G. R. S., Thormann, A., Flicek, P., & Cunningham, F. (2016) · Genome Biology · doi:10.1186/s13059-016-0974-4 · Cited by 8,099
Research works printed but not linked: 1
- Li, F.-Z., Amini, A. P., Yang, K. K. & Lu, A. X. Pretrained protein language model transfer learning: is the final layer representation what we want? in Machine Learning for Structural Biology Workshop (NeurIPS, 2022).
Cited by
Sorted by citations
Sequence modeling and design from molecular to genome scale with Evo
Nguyen, E., Poli, M., Durrant, M. G., Kang, B., Katrekar, D., Li, D. B., Bartie, L. J., Thomas, A. W., King, S. H., Brixi, G., et al. (2024) · Science · doi:10.1126/science.ado9336 · Cited by 580
AlphaGenome: advancing regulatory variant effect prediction with a unified DNA sequence model
Avsec, Ž., Latysheva, N., Cheng, J., Novati, G., Taylor, K. R., Ward, T., Bycroft, C., Nicolaisen, L., Arvaniti, E., Pan, J., et al. (2025) · doi:10.1101/2025.06.25.661532 · Cited by 395
How to build the virtual cell with artificial intelligence: Priorities and opportunities
Bunne, C., Roohani, Y., Rosen, Y., Gupta, A., Zhang, X., Roed, M., Alexandrov, T., AlQuraishi, M., Brennan, P., Burkhardt, D. B., et al. (2024) · Cell · doi:10.1016/j.cell.2024.11.015 · Cited by 393
Large language models (LLMs): survey, technical frameworks, and future challenges
Kumar, P. (2024) · Artificial Intelligence Review · doi:10.1007/s10462-024-10888-y · Cited by 395
Advancing regulatory variant effect prediction with AlphaGenome
Avsec, Ž., Latysheva, N., Cheng, J., Novati, G., Taylor, K. R., Ward, T., Bycroft, C., Nicolaisen, L., Arvaniti, E., Pan, J., et al. (2026) · Nature · doi:10.1038/s41586-025-10014-0 · Cited by 373
“…incorporating a broader range of data modalities (such as DNA methylation and RNA structural features) and pursuing foundational model improvements (such as leveraging DNA language models 45–47 , expanding multi-species capabilities and developing robust methods for assay bias correction 29,48 ).”
Metadata
- Authors
- Dalla-Torre, H., Gonzalez, L., Mendoza-Revilla, J., Lopez Carranza, N., Grzywaczewski, A. H., Oteri, F., Dallago, C., Trop, E., de Almeida, B. P., Sirelkhatim, H., Richard, G., Skwark, M., Beguir, K., Lopez, M., & Pierrot, T.
- Affiliations
- Nvidia (United States) (US)
- Corresponding author
- Lopez, Marie
- Pierrot, Thomas
- ORCID
- Venue
- Nature Methods
- Published
- 2024-11-28
- Volume
- 22
- Issue
- 2
- Pages
- 287-297
- ISSN
- 1548-7091 (ISSN-L)
- 1548-7105
- PMC
- PMC11810778
- OpenAlex
- W4404821554
- Semantic Scholar
- aa0f6f7393ee9663c75832d4f253d380e8ea0f6e
- Cited by
- 772
- References
- 74
- Citations by year
- 2026: 433 · 2025: 243 · 2024: 85
- FWCI
- 87.82
- Type
- journal article
- Language
- en
- Open access
- hybrid
- doi.org
- Licence
- Locations
- Nature Methods (publishedVersion, cc-by-nc-nd)
- Research Square (submittedVersion, cc-by)
- bioRxiv (Cold Spring Harbor Laboratory) (submittedVersion, cc-by-nd)
- PubMed Central (publishedVersion, cc-by-nc-nd)
- PubMed (publishedVersion)
- Topics
- Life Sciences › Biochemistry, Genetics and Molecular Biology › Molecular Biology › Machine Learning in Bioinformatics
- Life Sciences › Biochemistry, Genetics and Molecular Biology › Genetics › Genetic Associations and Epidemiology
- Life Sciences › Biochemistry, Genetics and Molecular Biology › Molecular Biology › Genomics and Phylogenetic Studies
- Keywords
- Nucleotide Transformer, sequence representation, transfer learning, low-data settings, enhancers, gene expression regulation, transformer models
- MeSH terms
- Algorithms, Base Sequence, Humans, Models, Genetic, Phenotype, Genome, Human, Sequence Analysis, DNA, Computational Biology, Genomics
About these checks
Registry, retraction, Cites and statistics results are computed, not judged, with one exception: a printed reference that no index lists is read once by a model before it counts as a citation error. Claims are extracted by a model and kept only when their quote appears verbatim in the text; each cited source is then checked, with a model’s help, for whether it says what the claim relies on. Those verdicts can be wrong — read the claim’s quote and the cited source before relying on one.
A language model drew the claims from the paper on 2026-10-10, under version 3 of the claim definition (model deepseek-v4.1-flash, prompt extract-v3).
A second model labelled each claim on 2026-10-10 (model jev-1.13-20260917, definition revision gold-guideline-v0.2).
Cited sources are checked with a language model’s help (gpt-6-sol).
Statistics and arithmetic are recomputed, not judged.
Confidence bands are shown only for fields calibrated on our annotated test set. None is calibrated yet, so no band is shown.
What counts as a claim ›How we measure confidence ›How we check this ›
Are you an author, or do you see a problem with this page? Request a review
