

The DOI matches its Crossref record; 53 of the 53 references it cites were found in a registry or an index.
Weaning age influences the severity of gastrointestinal microbiome shifts in dairy calves
Open accessAbstract
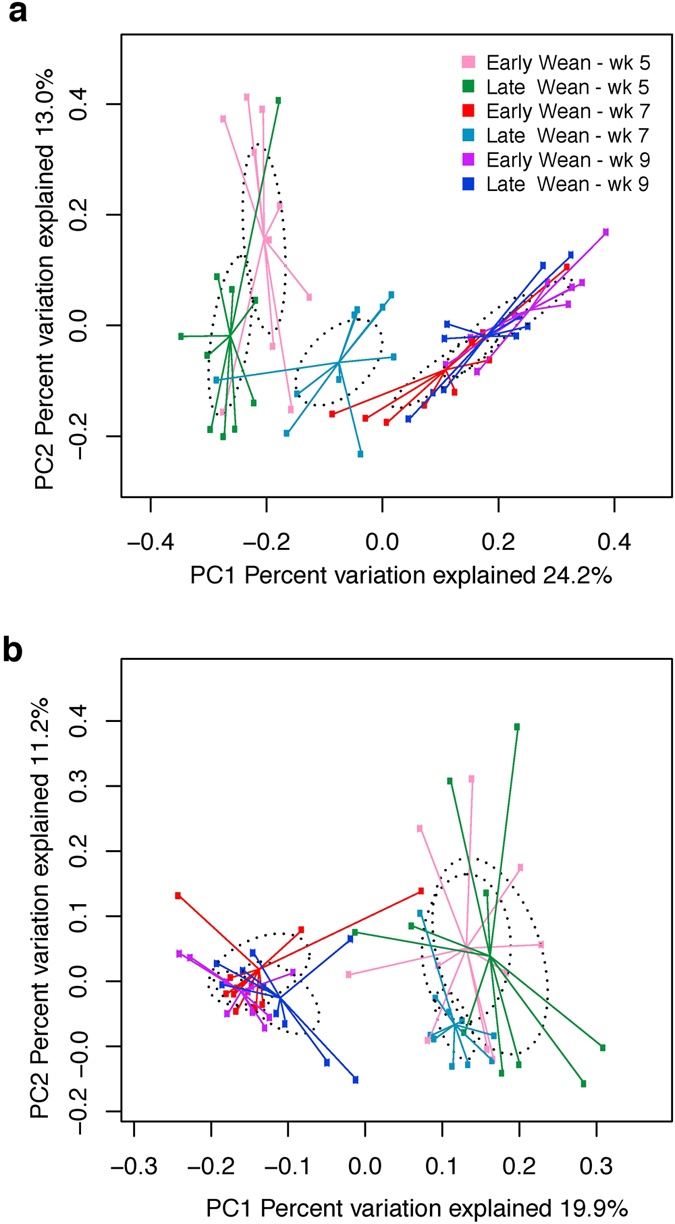
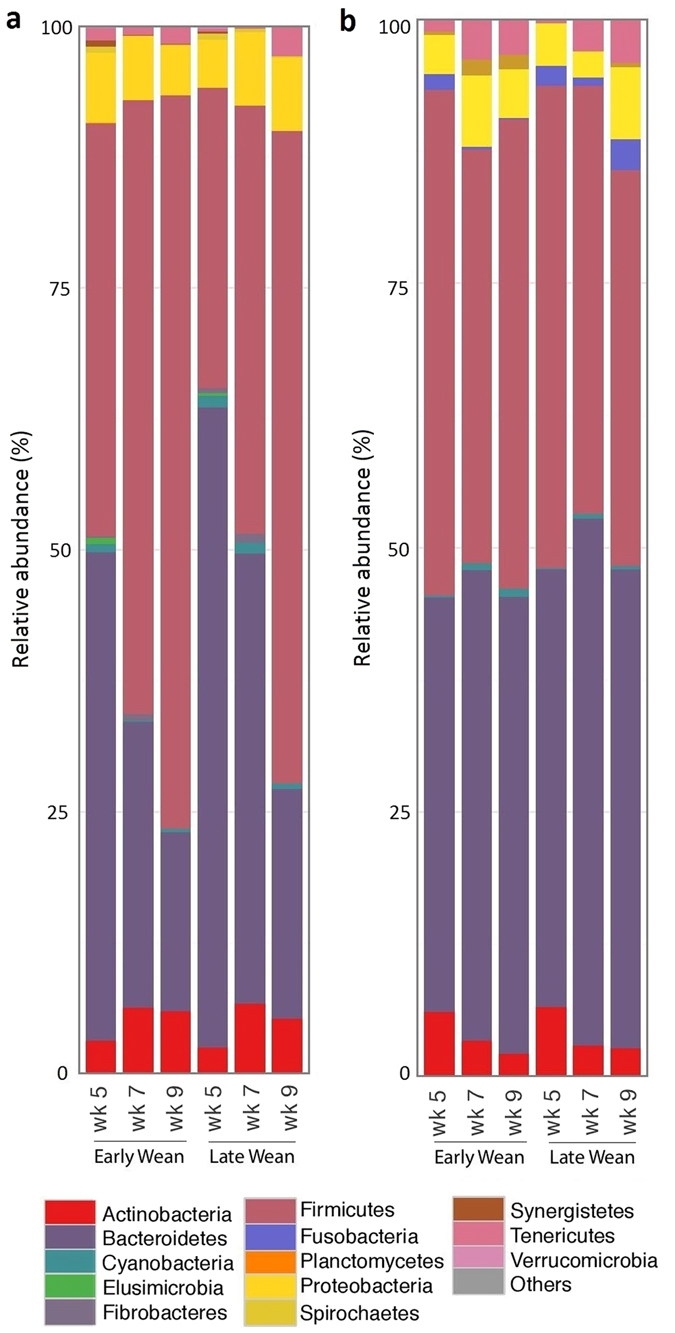
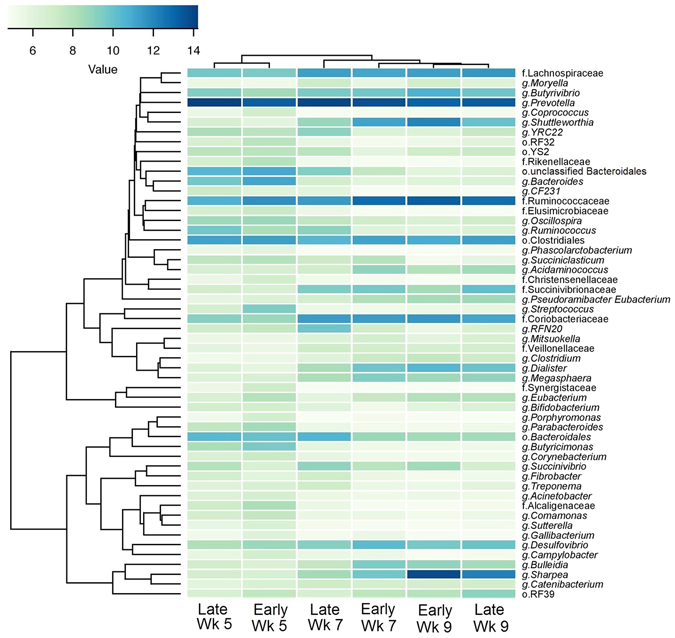
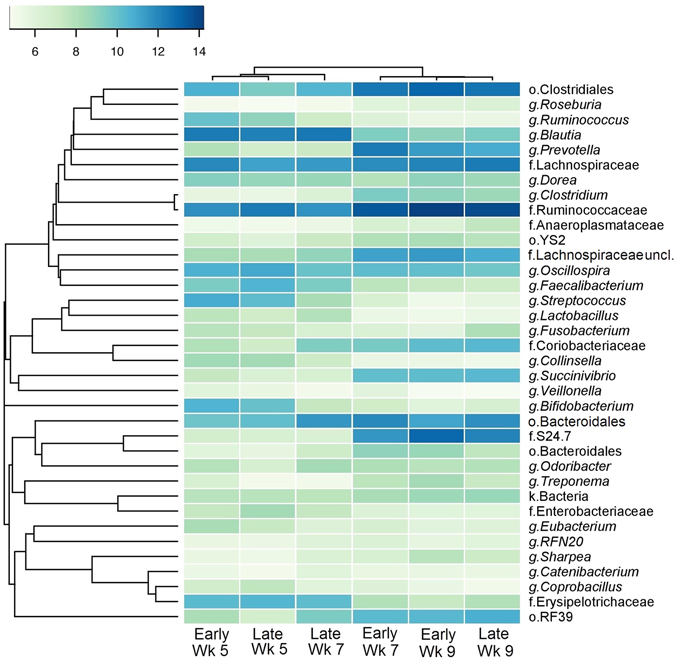
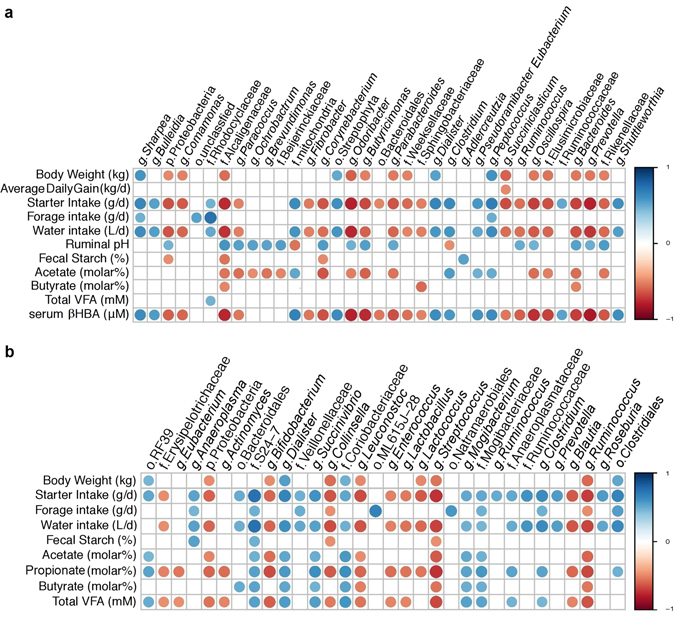
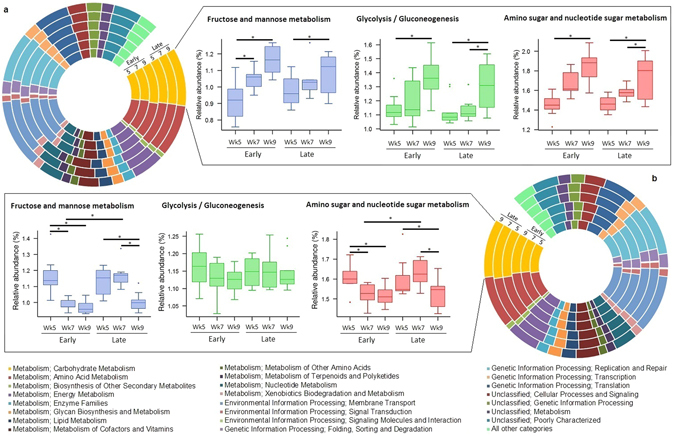
Ruminants microbial consortium is responsible for ruminal fermentation, a process which converts fibrous feeds unsuitable for human consumption into desirable dairy and meat products, begins to establish soon after birth. However, it undergoes a significant transition when digestion shifts from the lower intestine to ruminal fermentation. We hypothesised that delaying the transition from a high milk diet to an exclusively solid food diet (weaning) would lessen the severity of changes in the gastrointestinal microbiome during this transition. β-diversity of ruminal and faecal microbiota shifted rapidly in early-weaned calves (6 weeks), whereas, a more gradual shift was observed in late-weaned calves (8 weeks) up to weaning. Bacteroidetes and Firmicutes were the most abundant ruminal phyla in pre- and post-weaned calves, respectively. Yet, the relative abundance of these phyla remained stable in faeces (P ≥ 0.391). Inferred gene families assigned to KEGG pathways revealed an increase in ruminal carbohydrate metabolism (P ≤ 0.009) at 9, compared to 5 weeks. Conversely, carbohydrate metabolism in faeces declined (P ≤ 0.002) following a change in weaning status (i.e., the shift from pre- to post-weaning). Our results indicate weaning later facilitates a more gradual shift in microbiota and could potentially explain the negative effects of early-weaning associated with feeding a high-plane of pre-weaning nutrition.
Overview
The claims and statistics of this paper haven’t been checked yet.
Run the check — free, no account needed. It reads the open-access text and checks the sources it cites.
Integrity signals
Registry
Cites
Statistics
Figures
Verification
Claims the paper makes
The claims and statistics of this paper haven’t been checked yet.
Run the check — free, no account needed. It reads the open-access text and checks the sources it cites.
Claims other papers make about this one
Each is checked against this paper’s own text: does it say what the citing paper says it does?
In the citing paper
“However, the lower gastrointestinal (GI) tract microbiomes also play an important role, particularly in early life (Meale et al., 2017).”
From Addressing global ruminant agricultural challenges through understanding the rumen microbiome: past, present, and future (2018) · cites this paper as Meale et al., 2017
Self-check
Percentages, sums and reported differences re-computed from the paper’s own numbers.
The self-check needs the paper’s full text.
Citations
Cites
Moderated estimation of fold change and dispersion for RNA-seq data with DESeq2
Love, M. I., Huber, W., & Anders, S. (2014) · Genome Biology · doi:10.1186/s13059-014-0550-8 · Cited by 95,106
KEGG: Kyoto Encyclopedia of Genes and Genomes
Kanehisa, M. (2000) · Nucleic Acids Research · doi:10.1093/nar/28.1.27 · Cited by 37,077
QIIME allows analysis of high-throughput community sequencing data
Caporaso, J. G., Kuczynski, J., Stombaugh, J., Bittinger, K., Bushman, F. D., Costello, E. K., Fierer, N., Peña, A. G., Goodrich, J. K., Gordon, J. I., et al. (2010) · Nature Methods · doi:10.1038/nmeth.f.303 · Cited by 34,887
KEGG: Kyoto Encyclopedia of Genes and Genomes
Ogata, H., Goto, S., Sato, K., Fujibuchi, W., Bono, H., & Kanehisa, M. (1999) · Nucleic Acids Research · doi:10.1093/nar/27.1.29 · Cited by 31,232
phyloseq: An R Package for Reproducible Interactive Analysis and Graphics of Microbiome Census Data
McMurdie, P. J., & Holmes, S. (2013) · PLoS ONE · doi:10.1371/journal.pone.0061217 · Cited by 21,942
Naive Bayesian Classifier for Rapid Assignment of rRNA Sequences into the New Bacterial Taxonomy
Wang, Q., Garrity, G. M., Tiedje, J. M., & Cole, J. R. (2007) · Applied and Environmental Microbiology · doi:10.1128/aem.00062-07 · Cited by 20,145
PAST: PALEONTOLOGICAL STATISTICAL SOFTWARE PACKAGE FOR EDUCATION AND DATA ANALYSIS
Hammer, Ø., Harper, D. A. T., & Ryan, P. D. (2001) · Palaeontologia Electronica · Cited by 17,871
UCHIME improves sensitivity and speed of chimera detection
Edgar, R. C., Haas, B. J., Clemente, J. C., Quince, C., & Knight, R. (2011) · Bioinformatics · doi:10.1093/bioinformatics/btr381 · Cited by 15,114
Predictive functional profiling of microbial communities using 16S rRNA marker gene sequences
Langille, M. G. I., Zaneveld, J., Caporaso, J. G., McDonald, D., Knights, D., Reyes, J. A., Clemente, J. C., Burkepile, D. E., Vega Thurber, R. L., Knight, R., et al. (2013) · Nature Biotechnology · doi:10.1038/nbt.2676 · Cited by 9,116
Ultra-high-throughput microbial community analysis on the Illumina HiSeq and MiSeq platforms
Caporaso, J. G., Lauber, C. L., Walters, W. A., Berg-Lyons, D., Huntley, J., Fierer, N., Owens, S. M., Betley, J., Fraser, L., Bauer, M., et al. (2012) · The ISME Journal · doi:10.1038/ismej.2012.8 · Cited by 8,839
Research works printed but not linked: 3
- Church, D. C. Digestive Physiology and Nutrition of Ruminants. 2 edn, Vol. 1 (Corvallis OR: O&B Books, 1976).
- Hungate, R. E. (Academic Press, New York, 1966).
- Geishauser, T. An instrument for the collection and transfer of ruminal fluid and for the administration of water soluble drugs in adult cattle. Bovine Practice 27, 38–42 (1993).
Cited by
Sorted by citations
Huws, S. A., Creevey, C. J., Oyama, L. B., Mizrahi, I., Denman, S. E., Popova, M., Muñoz-Tamayo, R., Forano, E., Waters, S. M., Hess, M., et al. (2018) · Frontiers in Microbiology · doi:10.3389/fmicb.2018.02161 · Cited by 487
Ruminal microbiota–host interaction and its effect on nutrient metabolism
Liu, K., Zhang, Y., Yu, Z., Xu, Q., Zheng, N., Zhao, S., Huang, G., & Wang, J. (2020) · Animal nutrition · doi:10.1016/j.aninu.2020.12.001 · Cited by 242
Review of Strategies to Promote Rumen Development in Calves
Diao, Q., Zhang, R., & Fu, T. (2019) · Animals · doi:10.3390/ani9080490 · Cited by 218
Weaning Stress Perturbs Gut Microbiome and Its Metabolic Profile in Piglets
Li, Y., Guo, Y., Wen, Z., Jiang, X., Ma, X., & Han, X. (2018) · Scientific Reports · doi:10.1038/s41598-018-33649-8 · Cited by 200
Melatonin alleviates weanling stress in mice: Involvement of intestinal microbiota
Ren, W., Wang, P., Yan, J., Liu, G., Zeng, B., Hussain, T., Peng, C., Yin, J., Li, T., Wei, H., et al. (2017) · Journal of Pineal Research · doi:10.1111/jpi.12448 · Cited by 178
Metadata
- Authors
- Meale, S. J., Li, S. C., Azevedo, P., Derakhshani, H., DeVries, T. J., Plaizier, J. C., Steele, M. A., & Khafipour, E.
- Affiliations
- VetAgro Sup (FR)
- University of Manitoba (CA)
- University of Guelph (CA)
- University of Alberta (CA)
- Corresponding author
- Steele, M. A.
- Khafipour, E.
- Venue
- Scientific Reports
- Published
- 2017-03-15
- Volume
- 7
- Issue
- 1
- Pages
- 198-198
- ISSN
- 2045-2322 (ISSN-L)
- PMC
- PMC5428063
- OpenAlex
- W2594291939
- Cited by
- 133
- References
- 53
- Citations by year
- 2026: 9 · 2025: 10 · 2024: 14 · 2023: 17 · 2022: 22 · 2021: 19 · 2020: 19 · 2019: 10 · 2018: 11 · 2017: 2
- FWCI
- 20.90
- Type
- journal article
- Language
- en
- Open access
- gold
- doi.org
- Locations
- Scientific Reports (publishedVersion, cc-by)
- PubMed Central (publishedVersion, cc-by)
- PubMed (publishedVersion)
- HAL (submittedVersion, cc-by)
- DOAJ (DOAJ: Directory of Open Access Journals) (submittedVersion, cc-by-sa)
- Topics
- Life Sciences › Agricultural and Biological Sciences › Animal Science and Zoology › Ruminant Nutrition and Digestive Physiology
- Life Sciences › Agricultural and Biological Sciences › Animal Science and Zoology › Animal Nutrition and Physiology
- Life Sciences › Biochemistry, Genetics and Molecular Biology › Molecular Biology › Gut microbiota and health
- Keywords
- weaning age, dairy calves, gastrointestinal microbiome, rumen microbiota, fecal microbiota, rumen fermentation, Bacteroidetes, Firmicutes, carbohydrate metabolism, early weaning, plane of nutrition, microbial diversity
- MeSH terms
- Bacillota, Gastrointestinal Microbiome, Animals, Cattle, Feces, Phylogeny, Rumen, Weaning, Bacteroidetes, Carbohydrate Metabolism
About these checks
Registry, retraction, Cites and statistics results are computed, not judged, with one exception: a printed reference that no index lists is read once by a model before it counts as a citation error. Claims are extracted by a model and kept only when their quote appears verbatim in the text; each cited source is then checked, with a model’s help, for whether it says what the claim relies on. Those verdicts can be wrong — read the claim’s quote and the cited source before relying on one.
Statistics and arithmetic are recomputed, not judged.
Confidence bands are shown only for fields calibrated on our annotated test set. None is calibrated yet, so no band is shown.
What counts as a claim ›How we measure confidence ›How we check this ›
Are you an author, or do you see a problem with this page? Request a review
