

The DOI matches its Crossref record.
Bias in recent miRBase annotations potentially associated with RNA quality issues
Abstract
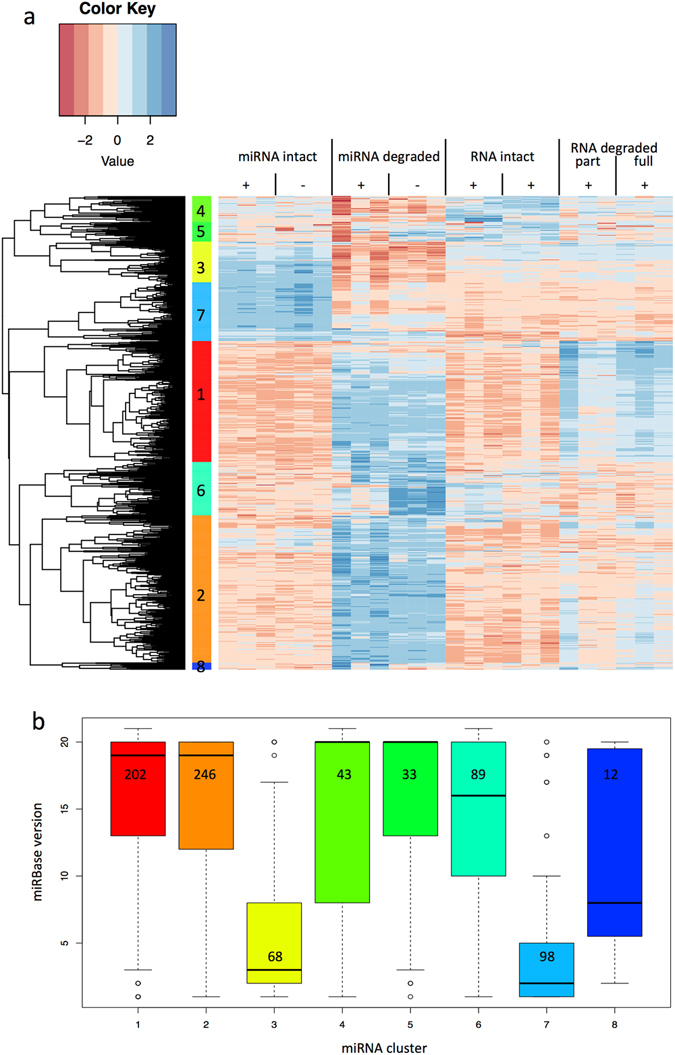
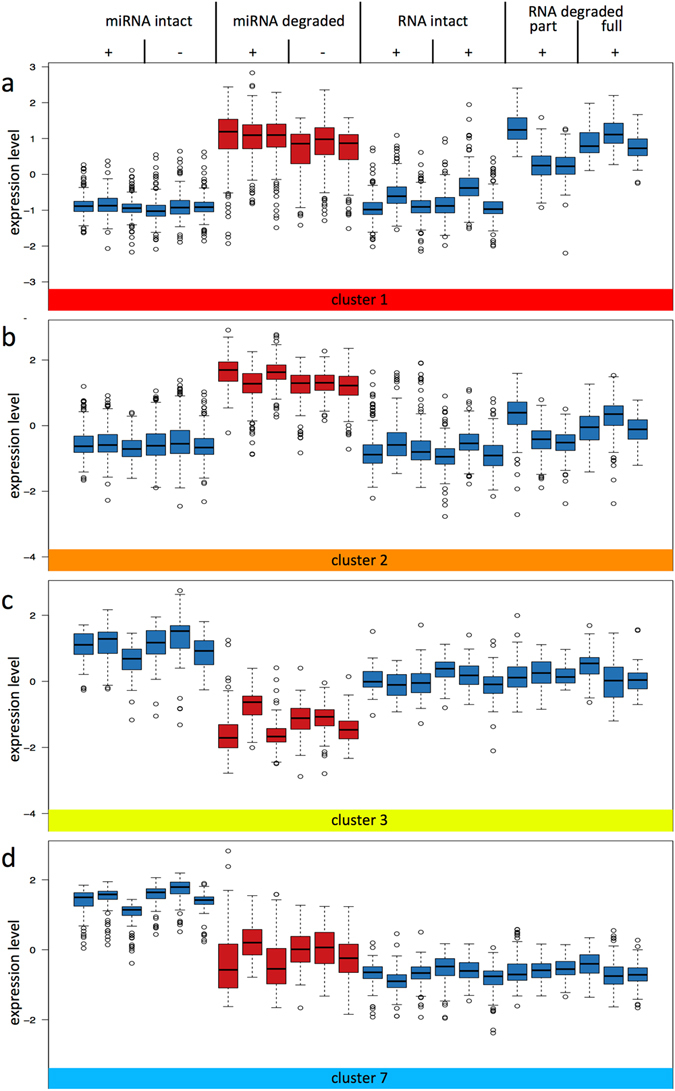
Although microRNAs are supposed to be stable in-vivo, degradation processes potentially blur our knowledge on the small oligonucleotides. We set to quantify the effect of degradation on microRNAs in mouse to identify causes for distorted microRNAs patterns. In liver, we found 298, 99 and 8 microRNAs whose expression significantly correlated to RNA integrity, storage time at room temperature and storage time at 4 °C, respectively. Expression levels of 226 microRNAs significantly differed between liver samples with high RNA integrity compared to liver samples with low RNA integrity by more than two-fold. Especially the 157 microRNAs with increased expression in tissue samples with low RNA integrity were most recently added to miRBase. Testing potentially confounding sources, e.g. in-vitro degraded RNA depleted of small RNAs, we detected signals for 350 microRNAs, suggesting cross-hybridization of fragmented RNAs. Therefore, we conclude that especially microRNAs added in the latest miRBase versions might be artefacts due to RNA degradation. The results facilitate differentiation between degradation-resilient microRNAs, degradation-sensitive microRNAs, and likely erroneously annotated microRNAs. The latter were largely identified by NGS but not experimentally validated and can severely bias microRNA biomarker research and impact the value of microRNAs as diagnostic, prognostic or therapeutic tools.
Overview
The claims and statistics of this paper haven’t been checked yet.
Run the check — free, no account needed. It reads the open-access text and checks the sources it cites.
Integrity signals
Registry
Cites
Statistics
Figures
Verification
Claims the paper makes
The claims and statistics of this paper haven’t been checked yet.
Run the check — free, no account needed. It reads the open-access text and checks the sources it cites.
Claims other papers make about this one
Each is checked against this paper’s own text: does it say what the citing paper says it does?
In the citing paper
“Moreover, the RNA quality can affect the results of small RNA sequencing studies (56), but a heterogenous quality of RNA samples can hardly be avoided in projects making use of post-mortem whole body samples.”
From miRNATissueAtlas2: an update to the human miRNA tissue atlas (2022) · cites this paper as [56]
Self-check
Percentages, sums and reported differences re-computed from the paper’s own numbers.
The self-check needs the paper’s full text.
Citations
Cites
No references could be resolved yet.
Research works printed but not linked: 42
- Bartel, D. P. MicroRNAs: genomics, biogenesis, mechanism, and function. Cell. 116, 281–297 (2004). · DOI
- Griffiths-Jones, S. The microRNA Registry. Nucleic acids research. 32, D109–111 (2004). · DOI
- Kozomara, A. & Griffiths-Jones, S. miRBase: annotating high confidence microRNAs using deep sequencing data. Nucleic acids research. 42, D68–73 (2014). · DOI · Paper page
- Kozomara, A. & Griffiths-Jones, S. miRBase: integrating microRNA annotation and deep-sequencing data. Nucleic acids research. 39, D152–157 (2011). · DOI · Paper page
- Aryani, A. & Denecke, B. In vitro application of ribonucleases: comparison of the effects on mRNA and miRNA stability. BMC research notes. 8, 164 (2015). · DOI
- Nagy, C. et al. Effects of postmortem interval on biomolecule integrity in the brain. Journal of neuropathology and experimental neurology. 74, 459–469 (2015). · DOI · Paper page
- Peiro-Chova, L. et al. High stability of microRNAs in tissue samples of compromised quality. Virchows Archiv: an international journal of pathology. 463, 765–774 (2013). · DOI
- Jung, M. et al. Robust microRNA stability in degraded RNA preparations from human tissue and cell samples. Clinical chemistry. 56, 998–1006 (2010). · DOI
- Winter, J. & Diederichs, S. Argonaute proteins regulate microRNA stability: Increased microRNA abundance by Argonaute proteins is due to microRNA stabilization. RNA biology. 8, 1149–1157 (2011). · DOI
- Marzi, M. J. et al. Degradation dynamics of microRNAs revealed by a novel pulse-chase approach. Genome research. 26, 554–565 (2016). · DOI
- Mitchell, P. S. et al. Circulating microRNAs as stable blood-based markers for cancer detection. Proceedings of the National Academy of Sciences of the United States of America. 105, 10513–10518 (2008). · DOI · Paper page
- Ibberson, D., Benes, V., Muckenthaler, M. U. & Castoldi, M. RNA degradation compromises the reliability of microRNA expression profiling. BMC biotechnology. 9, 102 (2009). · DOI · Paper page
- Weis, S. et al. Quality control for microarray analysis of human brain samples: The impact of postmortem factors, RNA characteristics, and histopathology. Journal of neuroscience methods. 165, 198–209 (2007). · DOI
- Imbeaud, S. et al. Towards standardization of RNA quality assessment using user-independent classifiers of microcapillary electrophoresis traces. Nucleic acids research. 33, e56 (2005). · DOI
- Becker, C., Hammerle-Fickinger, A., Riedmaier, I. & Pfaffl, M. W. mRNA and microRNA quality control for RT-qPCR analysis. Methods. 50, 237–243 (2010). · DOI
- Lv, Y. H. et al. A time course study demonstrating mRNA, microRNA, 18S rRNA, and U6 snRNA changes to estimate PMI in deceased rat’s spleen. Journal of forensic sciences. 59, 1286–1294 (2014). · DOI · Paper page
- Li, W. C. et al. Postmortem interval determination using 18S-rRNA and microRNA. Science & justice: journal of the Forensic Science Society. 54, 307–310 (2014). · DOI
- Borgan, E. et al. Ischemia caused by time to freezing induces systematic microRNA and mRNA responses in cancer tissue. Molecular oncology. 5, 564–576 (2011). · DOI
- Walker, D. G. et al. Characterization of RNA isolated from eighteen different human tissues: results from a rapid human autopsy program. Cell and tissue banking. 17, 361–375 (2016). · DOI
- Lv, Y. H. et al. RNA degradation as described by a mathematical model for postmortem interval determination. Journal of forensic and legal medicine. 44, 43–52 (2016). · DOI
- Gallego Romero, I., Pai, A. A., Tung, J. & Gilad, Y. RNA-seq: impact of RNA degradation on transcript quantification. BMC biology. 12, 42 (2014). · DOI
- Khan, J., Lieberman, J. A. & Lockwood, C. M. Variability in, variability out: best practice recommendations to standardize pre-analytical variables in the detection of circulating and tissue microRNAs. Clinical chemistry and laboratory medicine. 55, 608–621 (2017). · DOI
- Betsou, F. et al. Standard preanalytical coding for biospecimens: defining the sample PREanalytical code. Cancer epidemiology, biomarkers & prevention: a publication of the American Association for Cancer Research, cosponsored by the American Society of Preventive Oncology. 19, 1004–1011 (2010). · DOI
- Na, Y. J. et al. Comprehensive analysis of microRNA-mRNA co-expression in circadian rhythm. Experimental & molecular medicine. 41, 638–647 (2009). · DOI
- Vollmers, C. et al. Circadian oscillations of protein-coding and regulatory RNAs in a highly dynamic mammalian liver epigenome. Cell metabolism. 16, 833–845 (2012). · DOI
- Heegaard, N. H. et al. Diurnal Variations of Human Circulating Cell-Free Micro-RNA. PloS one. 11, e0160577 (2016). · DOI
- Rekker, K. et al. Circulating miR-200-family micro-RNAs have altered plasma levels in patients with endometriosis and vary with blood collection time. Fertility and sterility. 104(938-946), e932 (2015).
- Ambros, V. et al. A uniform system for microRNA annotation. Rna. 9, 277–279 (2003). · DOI · Paper page
- Okamura, K., Hagen, J. W., Duan, H., Tyler, D. M. & Lai, E. C. The mirtron pathway generates microRNA-class regulatory RNAs in Drosophila. Cell. 130, 89–100 (2007). · DOI
- Ruby, J. G., Jan, C. H. & Bartel, D. P. Intronic microRNA precursors that bypass Drosha processing. Nature. 448, 83–86 (2007). · DOI · Paper page
- Babiarz, J. E., Ruby, J. G., Wang, Y., Bartel, D. P. & Blelloch, R. Mouse ES cells express endogenous shRNAs, siRNAs, and other Microprocessor-independent, Dicer-dependent small RNAs. Genes & development. 22, 2773–2785 (2008). · DOI
- Cifuentes, D. et al. A novel miRNA processing pathway independent of Dicer requires Argonaute2 catalytic activity. Science. 328, 1694–1698 (2010). · DOI
- Brown, M., Suryawanshi, H., Hafner, M., Farazi, T. A. & Tuschl, T. Mammalian miRNA curation through next-generation sequencing. Frontiers in genetics. 4, 145 (2013). · DOI
- Chiang, H. R. et al. Mammalian microRNAs: experimental evaluation of novel and previously annotated genes. Genes & development. 24, 992–1009 (2010). · DOI · Paper page
- Meng, Y., Shao, C., Wang, H. & Chen, M. Are all the miRBase-registered microRNAs true? A structure- and expression-based re-examination in plants. RNA biology. 9, 249–253 (2012). · DOI
- Backes, C. et al. Prioritizing and selecting likely novel miRNAs from NGS data. Nucleic acids research. 44, e53 (2016). · DOI
- Hansen, T. B., Kjems, J. & Bramsen, J. B. Enhancing miRNA annotation confidence in miRBase by continuous cross dataset analysis. RNA biology. 8, 378–383 (2011). · DOI
- Castellano, L. & Stebbing, J. Deep sequencing of small RNAs identifies canonical and non-canonical miRNA and endogenous siRNAs in mammalian somatic tissues. Nucleic acids research. 41, 3339–3351 (2013). · DOI
- Wang, X. & Liu, X. S. Systematic Curation of miRBase Annotation Using Integrated Small RNA High-Throughput Sequencing Data for C. elegans and Drosophila. Frontiers in genetics. 2, 25 (2011).
- Ludwig, N. et al. Combining miRNA and mRNA Expression Profiles in Wilms Tumor Subtypes. International journal of molecular sciences. 17 (2016). · DOI
- Huber, W., von Heydebreck, A., Sultmann, H., Poustka, A. & Vingron, M. Variance stabilization applied to microarray data calibration and to the quantification of differential expression. Bioinformatics. 18(Suppl 1), S96–104 (2002). · DOI · Paper page
- Benjamini Y, H. Y. Controlling the False Discovery Rate: A Practical and Powerful Approach to Multiple Testing. J R Statist Soc B, 289–300 (1995). · DOI · Paper page
Cited by
Sorted by citations
miRNATissueAtlas2: an update to the human miRNA tissue atlas
Keller, A., Gröger, L., Tschernig, T., Solomon, J., Laham, O., Schaum, N., Wagner, V., Kern, F., Schmartz, G. P., Li, Y., et al. (2022) · Nucleic Acids Research · doi:10.1093/nar/gkab808 · Cited by 143
Self-citationVattathil, S. M., Gerasimov, E. S., Canon, S. M., Lori, A., Tan, S. S. M., Kim, P. J., Liu, Y., Lai, E. C., Bennett, D. A., Wingo, T. S., et al. (2024) · Nature Aging · doi:10.1038/s43587-024-00778-x · Cited by 14
Metadata
- Authors
- Ludwig, N., Becker, M., Schumann, T., Speer, T., Fehlmann, T., Keller, A., & Meese, E.
- Venue
- Scientific Reports
- Published
- 2017-07-12
- Volume
- 7
- Issue
- 1
- ISSN
- 2045-2322
- PMC
- PMC5507985
- Cited by
- 59
- References
- 0
- Language
- en
About these checks
Registry, retraction, Cites and statistics results are computed, not judged, with one exception: a printed reference that no index lists is read once by a model before it counts as a citation error. Claims are extracted by a model and kept only when their quote appears verbatim in the text; each cited source is then checked, with a model’s help, for whether it says what the claim relies on. Those verdicts can be wrong — read the claim’s quote and the cited source before relying on one.
Statistics and arithmetic are recomputed, not judged.
Confidence bands are shown only for fields calibrated on our annotated test set. None is calibrated yet, so no band is shown.
What counts as a claim ›How we measure confidence ›How we check this ›
Are you an author, or do you see a problem with this page? Request a review
How to cite
Cite CoChat for the checks on this page, and the paper for its own findings.
- This page
- CoChat. (2026). Citation check: Bias in recent miRBase annotations potentially associated with RNA quality issues. https://app.cochat.ai/papers/10.1038/s41598-017-05070-0
- The paper
- Ludwig, N., Becker, M., Schumann, T., Speer, T., Fehlmann, T., Keller, A., & Meese, E. (2017). Bias in recent miRBase annotations potentially associated with RNA quality issues. Scientific Reports. https://doi.org/10.1038/s41598-017-05070-0
