

The DOI matches its Crossref record; 78 of the 78 references it cites were found in a registry or an index.
Microbiome of Pacific Whiteleg shrimp reveals differential bacterial community composition between Wild, Aquacultured and AHPND/EMS outbreak conditions
Open accessAbstract
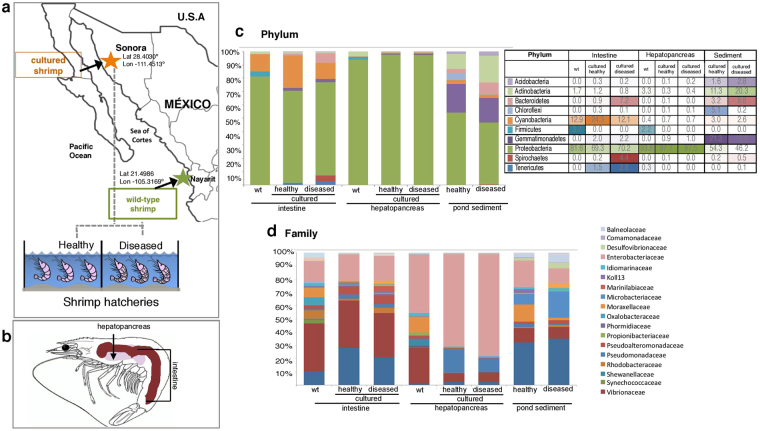
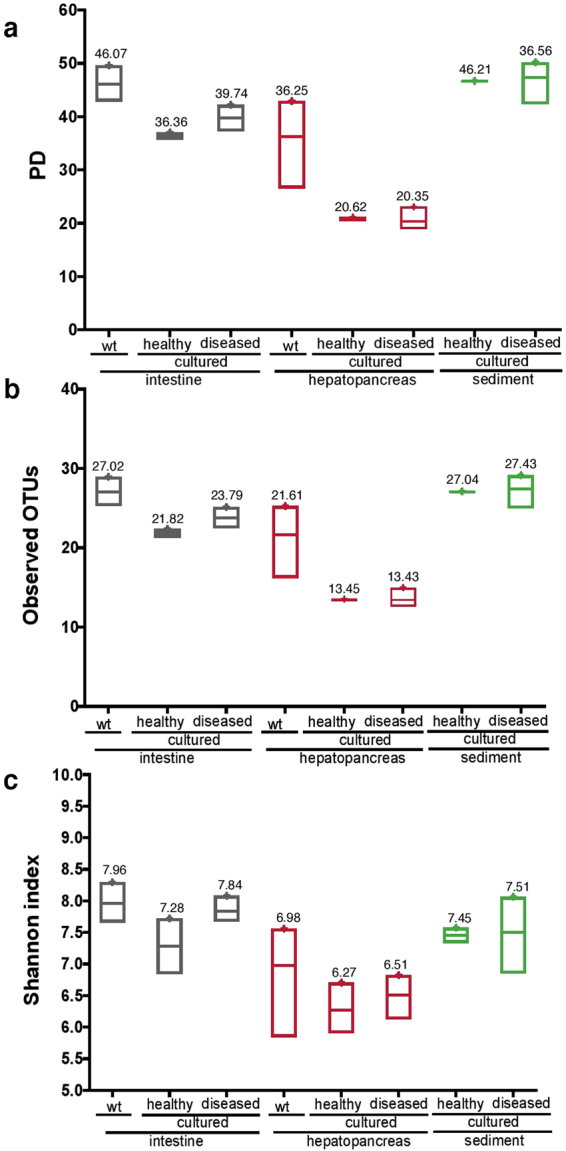
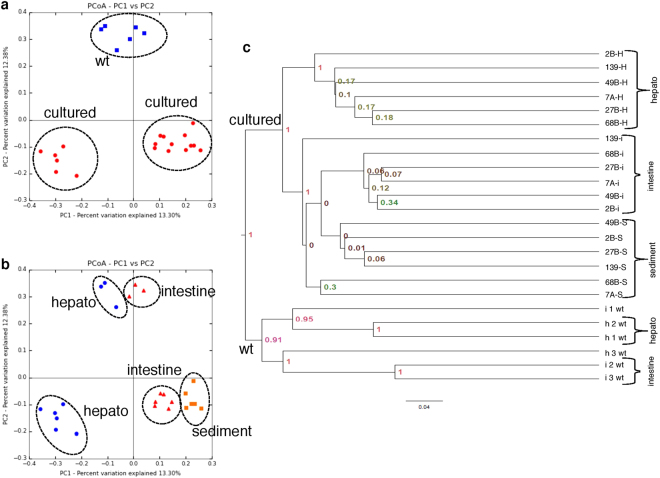
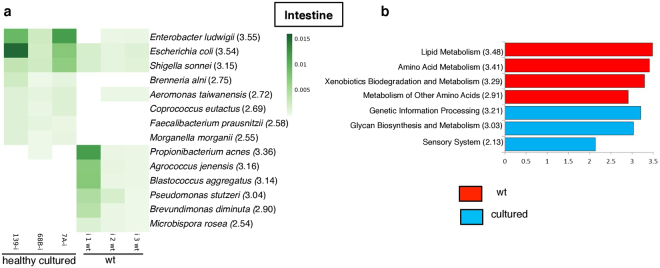
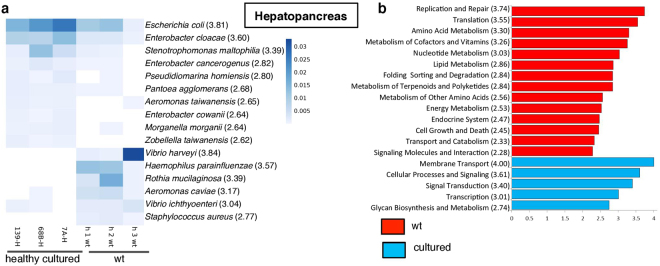
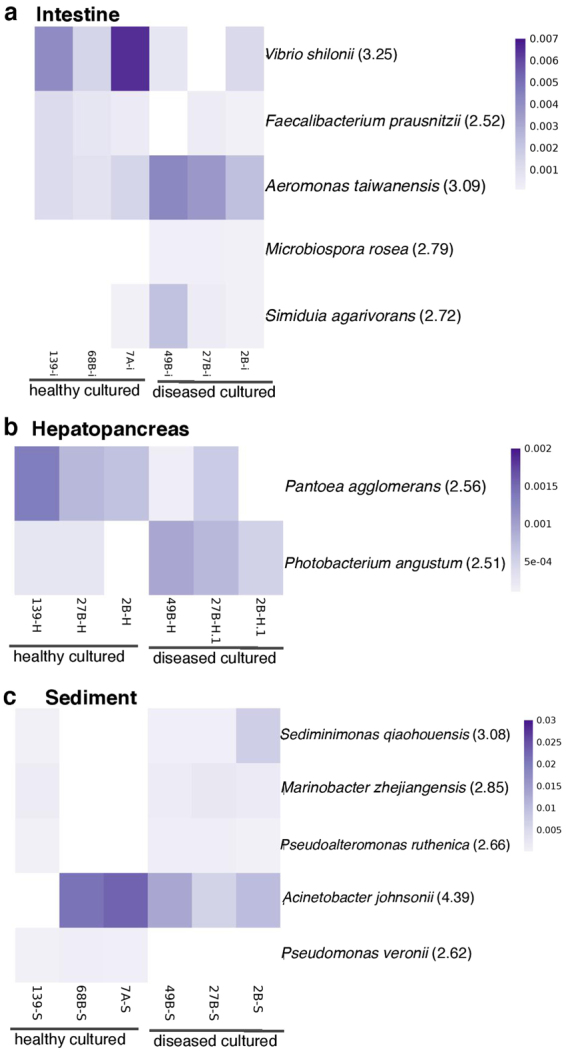
Crustaceans form the second largest subphylum on Earth, which includes Litopeneaus vannamei (Pacific whiteleg shrimp), one of the most cultured shrimp worldwide. Despite efforts to study the shrimp microbiota, little is known about it from shrimp obtained from the open sea and the role that aquaculture plays in microbiota remodeling. Here, the microbiota from the hepatopancreas and intestine of wild type (wt) and aquacultured whiteleg shrimp and pond sediment from hatcheries were characterized using sequencing of seven hypervariable regions of the 16S rRNA gene. Cultured shrimp with AHPND/EMS disease symptoms were also included. We found that (i) microbiota and their predicted metagenomic functions were different between wt and cultured shrimp; (ii) independent of the shrimp source, the microbiota of the hepatopancreas and intestine was different; (iii) the microbial diversity between the sediment and intestines of cultured shrimp was similar; and (iv) associated to an early development of AHPND/EMS disease, we found changes in the microbiome and the appearance of disease-specific bacteria. Notably, under cultured conditions, we identified bacterial taxa enriched in healthy shrimp, such as Faecalibacterium prausnitzii and Pantoea agglomerans, and communities enriched in diseased shrimp, such as Aeromonas taiwanensis, Simiduia agarivorans and Photobacterium angustum.
Overview
The claims and statistics of this paper haven’t been checked yet.
Run the check — free, no account needed. It reads the open-access text and checks the sources it cites.
Integrity signals
Registry
Cites
Statistics
Figures
Verification
Claims the paper makes
The claims and statistics of this paper haven’t been checked yet.
Run the check — free, no account needed. It reads the open-access text and checks the sources it cites.
Claims other papers make about this one
Each is checked against this paper’s own text: does it say what the citing paper says it does?
In the citing paper
“Even though Vibrio sp. can be associated with diseases, they have been identified in adults and nauplii of L. vannamei shrimps regardless of their health status (Vandenberghe et al., 1999; Cornejo-Granados et al., 2017).”
From Potential lineage transmission within the active microbiota of the eggs and the nauplii of the shrimp Litopenaeus stylirostris : possible influence of the rearing water and more (2021) · cites this paper as Cornejo-Granados et al., 2017
Self-check
Percentages, sums and reported differences re-computed from the paper’s own numbers.
The self-check needs the paper’s full text.
Citations
Cites
1 retracted
RETRACTED ARTICLE: Probiotics in shrimp aquaculture: Avenues and challenges
Ninawe, A. S., & Selvin, J. (2009) · Critical Reviews in Microbiology · doi:10.1080/10408410802667202 · Cited by 227
RetractedQIIME allows analysis of high-throughput community sequencing data
Caporaso, J. G., Kuczynski, J., Stombaugh, J., Bittinger, K., Bushman, F. D., Costello, E. K., Fierer, N., Peña, A. G., Goodrich, J. K., Gordon, J. I., et al. (2010) · Nature Methods · doi:10.1038/nmeth.f.303 · Cited by 34,887
Metagenomic biomarker discovery and explanation
Segata, N., Izard, J., Waldron, L., Gevers, D., Miropolsky, L., Garrett, W. S., & Huttenhower, C. (2011) · Genome Biology · doi:10.1186/gb-2011-12-6-r60 · Cited by 16,192
Predictive functional profiling of microbial communities using 16S rRNA marker gene sequences
Langille, M. G. I., Zaneveld, J., Caporaso, J. G., McDonald, D., Knights, D., Reyes, J. A., Clemente, J. C., Burkepile, D. E., Vega Thurber, R. L., Knight, R., et al. (2013) · Nature Biotechnology · doi:10.1038/nbt.2676 · Cited by 9,116
Quality-filtering vastly improves diversity estimates from Illumina amplicon sequencing
Bokulich, N. A., Subramanian, S., Faith, J. J., Gevers, D., Gordon, J. I., Knight, R. D., Mills, D. A., & Caporaso, J. G. (2012) · Nature Methods · doi:10.1038/nmeth.2276 · Cited by 4,525
Quail, M., Smith, M. E., Coupland, P., Otto, T. D., Harris, S. R., Connor, T. R., Bertoni, A., Swerdlow, H. P., & Gu, Y. (2012) · BMC Genomics · doi:10.1186/1471-2164-13-341 · Cited by 2,031
The Genus Aeromonas : Taxonomy, Pathogenicity, and Infection
Janda, J. M., & Abbott, S. L. (2010) · Clinical Microbiology Reviews · doi:10.1128/cmr.00039-09 · Cited by 1,766
How glycan metabolism shapes the human gut microbiota
Koropatkin, N. M., Cameron, E. A., & Martens, E. C. (2012) · Nature Reviews Microbiology · doi:10.1038/nrmicro2746 · Cited by 1,419
Performance comparison of benchtop high-throughput sequencing platforms
Loman, N. J., Misra, R., Dallman, T. J., Constantinidou, C., Gharbia, S. E., Wain, J. R., & Pallen, M. J. (2012) · Nature Biotechnology · doi:10.1038/nbt.2198 · Cited by 1,383
Regulation of immune cell function by short‐chain fatty acids
Corrêa‐Oliveira, R., Fachi, J. L., Vieira, A., Sato, F. T., & Vinolo, M. A. R. (2016) · Clinical & Translational Immunology · doi:10.1038/cti.2016.17 · Cited by 1,346
Cited by
Sorted by citations
Items 301–302 of 302
Synbiotic-based aquaculture: Insights on water quality management and animal health
Brito, L. O., Pimentel, O. A. L. F., Krummenauer, D., Gálvez, A. O., Khanjani, M. H., & Emerenciano, M. G. C. (2026) · Elsevier eBooks · doi:10.1016/b978-0-443-34689-7.00017-3
Andrade, B., Ramírez, M., & Reyes, G. (2026) · PLoS ONE · doi:10.1371/journal.pone.0361576
Metadata
- Authors
- Cornejo-Granados, F., Lopez-Zavala, A. A., Gallardo-Becerra, L., Mendoza-Vargas, A., Sánchez, F., Vichido, R., Brieba, L. G., Viana, M. T., Sotelo-Mundo, R. R., & Ochoa-Leyva, A.
- Affiliations
- Universidad Nacional Autónoma de México (MX)
- Secretaria de Salud (MX)
- Centro de Investigación y de Estudios Avanzados del Instituto Politécnico Nacional (MX)
- ORCID
- Venue
- Scientific Reports
- Published
- 2017-09-18
- Volume
- 7
- Issue
- 1
- Pages
- 11783-11783
- ISSN
- 2045-2322 (ISSN-L)
- PMC
- PMC5603525
- OpenAlex
- W2754347595
- Cited by
- 302
- References
- 78
- Citations by year
- 2026: 13 · 2025: 28 · 2024: 39 · 2023: 43 · 2022: 44 · 2021: 45 · 2020: 39 · 2019: 23 · 2018: 26
- FWCI
- 10.89
- Type
- journal article
- Language
- en
- Open access
- gold
- doi.org
- Locations
- Scientific Reports (publishedVersion, cc-by)
- Europe PMC (PubMed Central) (publishedVersion, cc-by)
- PubMed Central (publishedVersion, cc-by)
- PubMed (publishedVersion)
- DOAJ (DOAJ: Directory of Open Access Journals) (submittedVersion)
- Funders
- Instituto Nacional de Pesca y Acuacultura
- Instituto Nacional de Medicina Genómica
- Dirección General de Asuntos del Personal Académico, Universidad Nacional Autónoma de México (IA203516)
- Topics
- Life Sciences › Immunology and Microbiology › Immunology › Aquaculture disease management and microbiota
- Life Sciences › Biochemistry, Genetics and Molecular Biology › Molecular Biology › Gut microbiota and health
- Physical Sciences › Environmental Science › Ecology › Microbial Community Ecology and Physiology
- Keywords
- Litopenaeus vannamei, aquaculture, wild shrimp, hepatopancreas, intestine, pond sediments, bacterial community composition, 16S rRNA gene, Faecalibacterium prausnitzii, Pantoea agglomerans
- MeSH terms
- Gastrointestinal Microbiome, Animals, Bacteria, Aquaculture, Penaeidae, Metagenomics
About these checks
Registry, retraction, Cites and statistics results are computed, not judged, with one exception: a printed reference that no index lists is read once by a model before it counts as a citation error. Claims are extracted by a model and kept only when their quote appears verbatim in the text; each cited source is then checked, with a model’s help, for whether it says what the claim relies on. Those verdicts can be wrong — read the claim’s quote and the cited source before relying on one.
Statistics and arithmetic are recomputed, not judged.
Confidence bands are shown only for fields calibrated on our annotated test set. None is calibrated yet, so no band is shown.
What counts as a claim ›How we measure confidence ›How we check this ›
Are you an author, or do you see a problem with this page? Request a review
