

The DOI matches its Crossref record; 95 of the 95 references it cites were found in a registry or an index; 13 of the 41 sources its claims cite were checked for support.
Trisomy 21 causes changes in the circulating proteome indicative of chronic autoinflammation
Open accessAbstract
Trisomy 21 (T21) causes Down syndrome (DS), but the mechanisms by which T21 produces the different disease spectrum observed in people with DS are unknown. We recently identified an activated interferon response associated with T21 in human cells of different origins, consistent with overexpression of the four interferon receptors encoded on chromosome 21, and proposed that DS could be understood partially as an interferonopathy. However, the impact of T21 on systemic signaling cascades in living individuals with DS is undefined. To address this knowledge gap, we employed proteomics approaches to analyze blood samples from 263 individuals, 165 of them with DS, leading to the identification of dozens of proteins that are consistently deregulated by T21. Most prominent among these proteins are numerous factors involved in immune control, the complement cascade, and growth factor signaling. Importantly, people with DS display higher levels of many pro-inflammatory cytokines (e.g. IL-6, MCP-1, IL-22, TNF-α) and pronounced complement consumption, resembling changes seen in type I interferonopathies and other autoinflammatory conditions. Therefore, these results are consistent with the hypothesis that increased interferon signaling caused by T21 leads to chronic immune dysregulation, and justify investigations to define the therapeutic value of immune-modulatory strategies in DS.
Overview
AI snapshot
Written from the paper’s full text.
TL;DR
Trisomy 21 is associated with widespread changes in the circulating proteome, including immune-control, complement/coagulation, growth-factor, and neurogenesis-related proteins. The pattern includes elevated pro-inflammatory cytokines and complement consumption, resembling type I interferonopathies and supporting chronic autoinflammation in Down syndrome.
Key findings
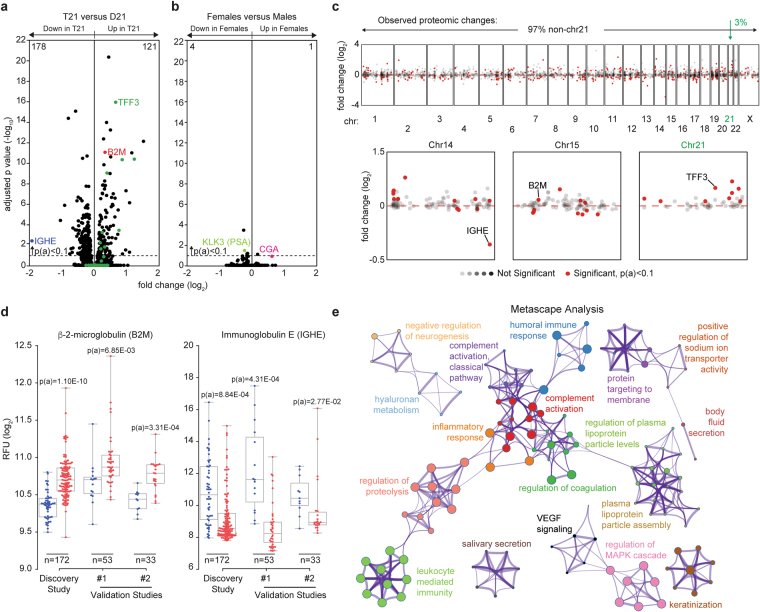
- In the Discovery Study (120 T21, 52 D21; 3,585 epitopes), 299 proteins were differentially detected at Bonferroni-adjusted p < 0.1: 178 downregulated and 121 upregulated in T21. Among 50 chr21-encoded proteins with aptamers, 9 were significantly upregulated and none significantly downregulated.
- Validation was reproducible: ~72% of Discovery differential proteins measured in all three studies validated in at least one Validation Study (FDR < 10%). B2M was consistently elevated and IGHE consistently downregulated; lower IgE was confirmed by ELISA.
- In a separate MSD assay of 40 adults (20 T21, 20 D21), individuals with DS had significantly increased IL-6, IL-22, MCP-1/CCL2, TNF-α, and VEGF-A. CCL17 was elevated in all three SOMAscan studies but fell below the MSD significance cutoff.
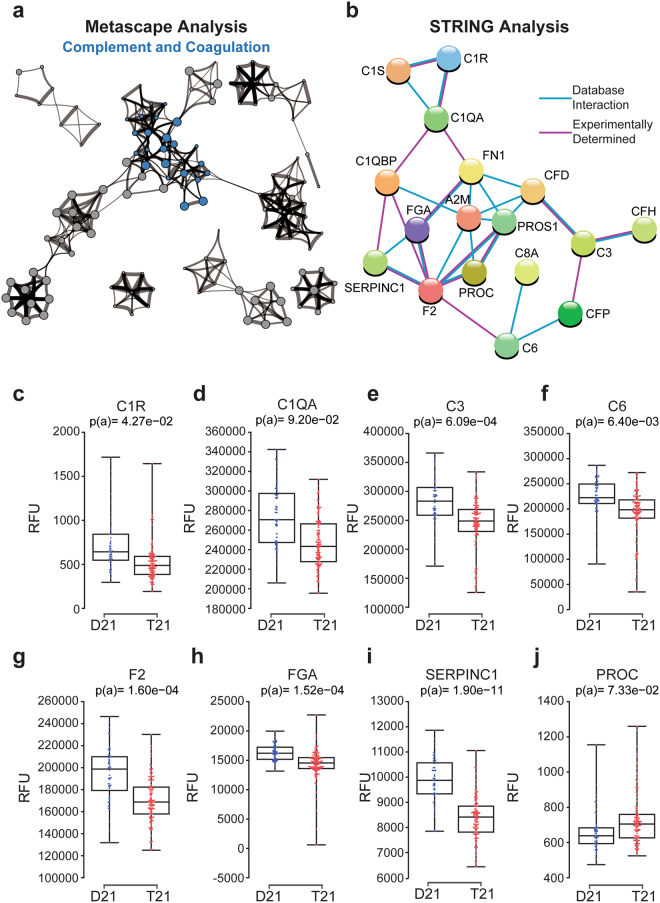
- Complement/coagulation proteins showed a consumption pattern: 21 proteins in the category, 18 downregulated in DS, including C1R, C1QA, C3, and C6; C1S was consistently depleted in all three studies. Interferome mining found significant enrichment of interferon-related proteins among differential proteins (p = 1.91E-03, hypergeometric test).
Methods
- SOMAscan aptamer proteomics was performed on plasma/serum: Discovery Study (172 individuals: 120 T21, 52 D21; 3,585 epitopes), Validation Study #1 (53: 38 T21, 15 D21; plasma; 1,047 epitopes), and Validation Study #2 (33: 22 T21, 11 D21; serum; 1,047 epitopes). The abstract reports 263 individuals total, 165 with DS.
- A Mesoscale Discovery assay measured 38 cytokines in plasma from 40 adults (20 T21, 20 D21; ages 20–65), and IgE ELISA was used for confirmation.
- Differential detection used the non-parametric Kolmogorov-Smirnov test with Bonferroni correction for the Discovery Study and Benjamini-Hochberg correction for smaller Validation/MSD studies; functional analyses used Metascape, STRING, and Interferome.
Limitations
- The paper does not state a formal limitations section; it describes the proteomics datasets as “hypothesis-generating” and calls for future mechanistic investigations.
- Evident from the text: the SOMAscan cohorts are largely pediatric (Discovery ages six months to 21 years), while the MSD cohort is only 40 adults (20–65), so age coverage is limited and the design is cross-sectional.
- Evident from the text: no direct measurement of interferon signaling or functional validation is reported, and the findings are associations in the circulating proteome; causality and therapeutic benefit of immune modulation are not tested.
Model-written summary. Check it against the paper before relying on it.
Integrity signals
Registry
Cites
Statistics
Figures
Verification
Claims the paper makes
44 Own result · 13 Own interpretation · 12 No full text of the sources · 8 Own method · 6 Partly supported · 4 Supported · 1 Supported so far · 1 Not checked yet · accuracy not yet measured
Every source the paper cites for this claim was checked and supports it.
In the paper
“including, most prominently, consistent activation of the interferon transcriptional response17”
§ Trisomy 21 causes changes in the circulating proteome indicative of chronic autoinflammation > Introduction
What the sources say
- Supportedcites [17] Sullivan, K. D. et al. Trisomy 21 consistently activates the interferon response. Elife 5, e16220 (2016). source
The Results section, “Trisomy 21 leads to constitutive activation of the interferon transcriptional response,” identifies canonical interferon pathways as activated in trisomy 21 cells and reports increased expression of interferon-stimulated genes. This supports the attributed claim; the supplied passage does not give a page number. (LLM, conf=0.94)
boosteddirect- Asserted: passes — The authors put it forward as true.
- Checkable: passes — It can be checked against evidence.
- Load-bearing: passes — The paper’s conclusions depend on it.
- Based: passes — The paper gives a reason why it holds.
- Supported
Every source the paper cites for this claim was checked and supports it.
In the paper
“We next queried the STRING database of protein-protein interactions27, which revealed numerous groups of physically interacting proteins within this functional category”
§ Trisomy 21 causes changes in the circulating proteome indicative of chronic autoinflammation > Results and Discussion > People with Down syndrome display proteome changes indicative of chronic autoinflammation
What the sources say
- Supportedcites [27] Szklarczyk, D. et al. STRINGv10: protein-protein interaction networks, integrated over the tree of life. Nucleic Acids Res. 43, D447–D452 (2015). source
The Introduction identifies STRING as a database of protein associations and says it integrates known and predicted interactions, including physical associations. The groups found within the citing authors’ Immune Control category are their own analysis, not a finding attributed to this source. (LLM, conf=0.94)
plain- Asserted: passes — The authors put it forward as true.
- Checkable: passes — It can be checked against evidence.
- Load-bearing: unclear — It is unclear whether the paper’s conclusions depend on it.
- Based: passes — The paper gives a reason why it holds.
- Supported
The cited sources support only part of this claim — read each source’s verdict below.
In the paper
“Our study of the circulating proteome in people with DS, the largest and most comprehensive study of this kind reported to date, reveals that T21 causes profound immune dysregulation, with many of the changes being highly reminiscent of those observed in type I interferonopathies and other autoinflammatory conditions54,58–60,88 (Table 1).”
§ Trisomy 21 causes changes in the circulating proteome indicative of chronic autoinflammation > Results and Discussion > Final Remarks
What the sources say
- Partly supportedcites [54] Obermoser, G. & Pascual, V. The interferon-alpha signature of systemic lupus erythematosus. Lupus 19, 1012–9 (2010). sourceExperimental — accuracy not yet measured
The section “The IFN-α signature of SLE” reports elevated interferon and upregulated interferon-regulated transcripts in the blood of people with lupus, supporting an analogy to interferon-associated immune changes. It does not examine the circulating proteome in Down syndrome or establish that its protein changes resemble those in lupus or other conditions. (LLM, conf=0.82)
- Not checked — no full text of the sourcecites [58] Szodoray, P., Alex, P., Brun, J. G., Centola, M. & Jonsson, R. Circulating Cytokines in Primary Sjogren’s Syndrome Determined by a Multiplex Cytokine Array System. Scand. J. Immunol. 59, 592–599 (2004). source
- Partly supportedcites [59] Meyer, P. W. A. et al. Circulating cytokine profiles and their relationships with autoantibodies, acute phase reactants, and disease activity in patients with rheumatoid arthritis. Mediators Inflamm. 2010, 158514 (2010). sourceExperimental — accuracy not yet measured
The Results (§3.2; page unavailable) report broadly elevated circulating cytokines, chemokines, and growth factors in patients with rheumatoid arthritis, supporting an inflammatory-condition example. The paper does not study Down syndrome or type I interferonopathies, or establish that many of their proteomic changes resemble those in rheumatoid arthritis. (LLM, conf=0.82)
- Supportedcites [60] Takanohashi, A. et al. Elevation of proinflammatory cytokines in patients with Aicardi-Goutieres syndrome. Neurology 80, 997–1002 (2013). source
The Abstract reports elevated proinflammatory cytokines in the plasma and CSF of patients with Aicardi-Goutières syndrome, a disorder the paper characterizes by elevated interferon-α. The Discussion (labelled RESULTS in our copy) identifies a broader cytokine signature, including plasma elevations of IP-10/CXCL10. This supports the citation as an example of the immune changes to which the Down syndrome findings are compared; the comparison itself is the citing authors’ conclusion. (LLM, conf=0.87)
- Not checked — no full text of the sourcecites [88] Antonelli, A. et al. Chemokine (C-X-C motif) ligand (CXCL)10 in autoimmune diseases. Autoimmun. Rev. 13, 272–80 (2014). source
plaincorrelational- Asserted: passes — The authors put it forward as true.
- Checkable: passes — It can be checked against evidence.
- Load-bearing: passes — The paper’s conclusions depend on it.
- Based: passes — The paper gives a reason why it holds.
- Partly supported
A result the paper reports from its own data — it cites no other source for it, so there is none to check. The quote shows it is in the paper.
In the paper
“changes associated with T21 are far more profound, both in number of proteins affected and fold changes, than those associated with the sex-specific karyotypes”
§ Trisomy 21 causes changes in the circulating proteome indicative of chronic autoinflammation > Results and Discussion > Trisomy 21 causes consistent global changes in the circulating proteome
plaincorrelationaln = 172- Asserted: passes — The authors put it forward as true.
- Checkable: passes — It can be checked against evidence.
- Load-bearing: unclear — It is unclear whether the paper’s conclusions depend on it.
- Based: passes — The paper gives a reason why it holds.
A result the paper reports from its own data — it cites no other source for it, so there is none to check. The quote shows it is in the paper.
In the paper
“people with DS display higher levels of many pro-inflammatory cytokines (e.g. IL-6, MCP-1, IL-22, TNF-α)”
§ Trisomy 21 causes changes in the circulating proteome indicative of chronic autoinflammation > Abstract
plaincorrelationaln = 263- Asserted: passes — The authors put it forward as true.
- Checkable: passes — It can be checked against evidence.
- Load-bearing: passes — The paper’s conclusions depend on it.
- Based: passes — The paper gives a reason why it holds.
- Rests on an assumption: Trisomy 21 causes Down syndrome.
A result the paper reports from its own data — it cites no other source for it, so there is none to check. The quote shows it is in the paper.
In the paper
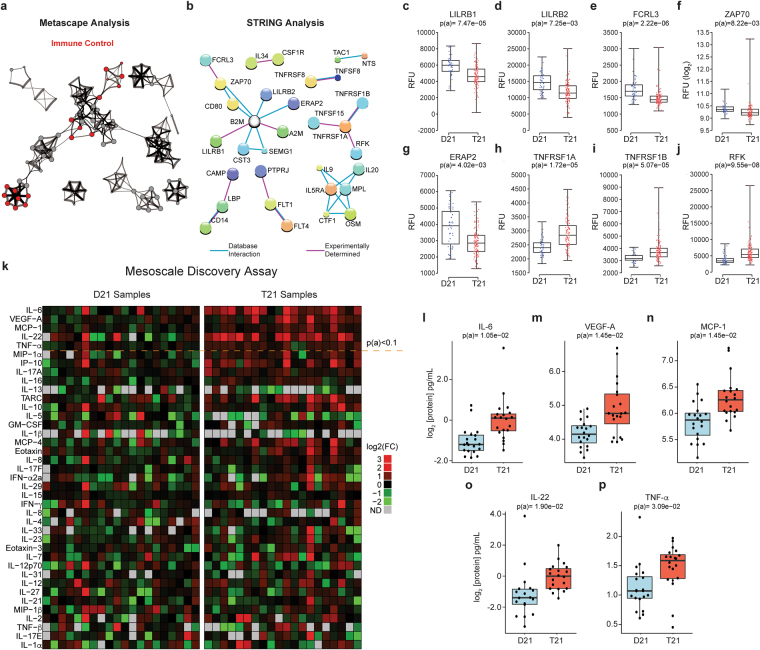
“ERAP2, also downregulated in people with DS”
§ Trisomy 21 causes changes in the circulating proteome indicative of chronic autoinflammation > Results and Discussion > People with Down syndrome display proteome changes indicative of chronic autoinflammation
plaincorrelational- Asserted: passes — The authors put it forward as true.
- Checkable: passes — It can be checked against evidence.
- Load-bearing: passes — The paper’s conclusions depend on it.
- Based: passes — The paper gives a reason why it holds.
A result the paper reports from its own data — it cites no other source for it, so there is none to check. The quote shows it is in the paper.
In the paper
“leading to the identification of dozens of proteins that are consistently deregulated by T21”
- Also stated in: § Introduction · plain
“Collectively, these efforts identified dozens of proteins consistently deregulated in the circulating proteome of people with T21.”
§ Trisomy 21 causes changes in the circulating proteome indicative of chronic autoinflammation > Abstract
plaindirectn = 263- Asserted: passes — The authors put it forward as true.
- Checkable: passes — It can be checked against evidence.
- Load-bearing: passes — The paper’s conclusions depend on it.
- Based: passes — The paper gives a reason why it holds.
- Rests on an assumption: Trisomy 21 causes Down syndrome.
- Also stated in: § Introduction · plain
A result the paper reports from its own data — it cites no other source for it, so there is none to check. The quote shows it is in the paper.
In the paper
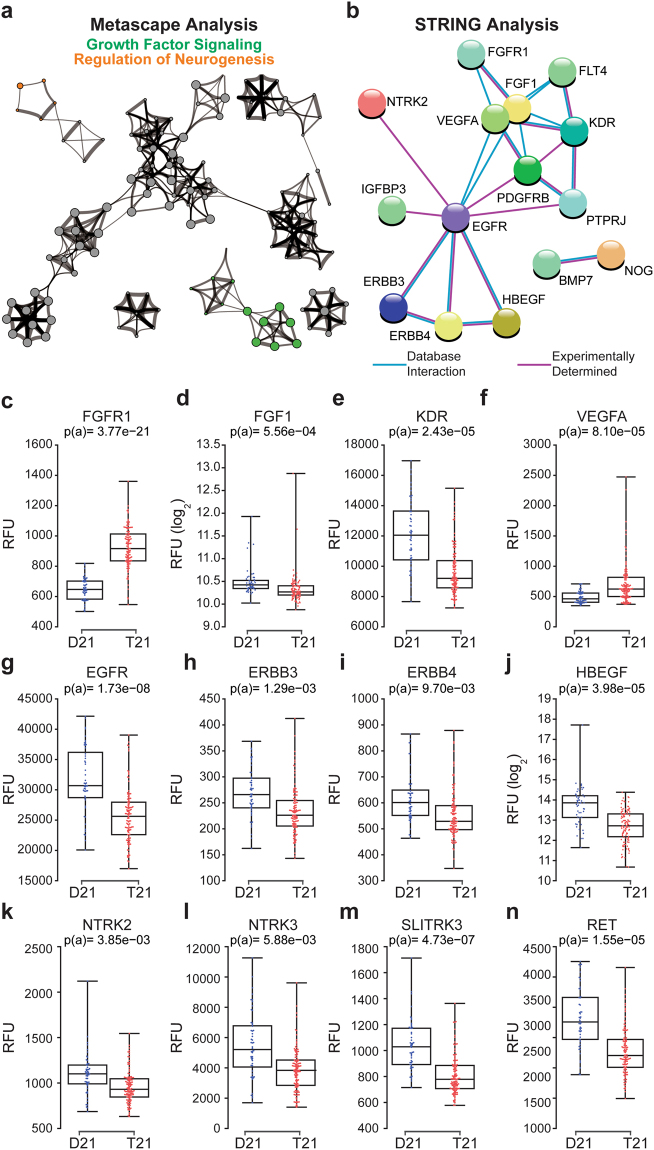
“For example, FGFR1 is upregulated in individuals with T21, while its ligand FGF1, is down (Fig. 4c,d).”
§ Trisomy 21 causes changes in the circulating proteome indicative of chronic autoinflammation > Results and Discussion > Trisomy 21 causes changes in circulating levels of growth factor receptors and proteins involved in neurogenesis
plaindirect- Asserted: passes — The authors put it forward as true.
- Checkable: passes — It can be checked against evidence.
- Load-bearing: unclear — It is unclear whether the paper’s conclusions depend on it.
- Based: passes — The paper gives a reason why it holds.
A result the paper reports from its own data — it cites no other source for it, so there is none to check. The quote shows it is in the paper.
In the paper
“Immune Control constituted the largest functional category, consisting of 150 differential proteins”
§ Trisomy 21 causes changes in the circulating proteome indicative of chronic autoinflammation > Results and Discussion > People with Down syndrome display proteome changes indicative of chronic autoinflammation
plain- Asserted: passes — The authors put it forward as true.
- Checkable: passes — It can be checked against evidence.
- Load-bearing: unclear — It is unclear whether the paper’s conclusions depend on it.
- Based: passes — The paper gives a reason why it holds.
A result the paper reports from its own data — it cites no other source for it, so there is none to check. The quote shows it is in the paper.
In the paper
“For example, FGFR1 is upregulated in individuals with T21, while its ligand FGF1, is down (Fig. 4c,d).”
§ Trisomy 21 causes changes in the circulating proteome indicative of chronic autoinflammation > Results and Discussion > Trisomy 21 causes changes in circulating levels of growth factor receptors and proteins involved in neurogenesis
plaindirect- Asserted: passes — The authors put it forward as true.
- Checkable: passes — It can be checked against evidence.
- Load-bearing: unclear — It is unclear whether the paper’s conclusions depend on it.
- Based: passes — The paper gives a reason why it holds.
- Probably not a substantial claim. 25
- It may state two separate claims as one. 18
The cited sources support only part of this claim — read each source’s verdict below.
In the paper
“have all been used to monitor kidney function, as their plasma levels increase upon kidney injury71”
§ Trisomy 21 causes changes in the circulating proteome indicative of chronic autoinflammation > Results and Discussion > Trisomy 21 causes hypocomplementia
What the sources say
- Partly supportedcites [71] Du, T. et al. Circulating serum trefoil factor 3 (TFF3) is dramatically increased in chronic kidney disease. PLoS One 8, e80271 (2013). sourceExperimental — accuracy not yet measured
The Discussion reports that serum TFF3 is higher in patients with chronic kidney disease and rises with CKD severity. It does not establish that TFF3 has been used to monitor kidney function; it describes clinical diagnostic development as a future possibility. The passages also provide no support for the claims about CST3 or B2M. (LLM, conf=0.88)
plaindirect- Asserted: passes — The authors put it forward as true.
- Checkable: passes — It can be checked against evidence.
- Load-bearing: passes — The paper’s conclusions depend on it.
- Based: passes — The paper gives a reason why it holds.
Probably not a substantial claim. It may state two separate claims as one.
- Partly supported
The cited sources support only part of this claim — read each source’s verdict below.
In the paper
“However, several complement subunits also play key roles in microglia-mediated synapse destruction during AD progression74–76”
§ Trisomy 21 causes changes in the circulating proteome indicative of chronic autoinflammation > Results and Discussion > Trisomy 21 causes hypocomplementia
What the sources say
- Not checked — no full text of the sourcecites [74] Jiang, H., Burdick, D., Glabe, C. G., Cotman, C. W. & Tenner, A. J. beta-Amyloid activates complement by binding to a specific region of the collagen-like domain of the C1q A chain. J. Immunol. 152, 5050–9 (1994). source
- Not checked — no full text of the sourcecites [75] Veerhuis, R., Janssen, I., Hack, C. E. & Eikelenboom, P. Early complement components in Alzheimer’s disease brains. Acta Neuropathol. 91, 53–60 (1996). source
- Partly supportedcites [76] Hong, S. et al. Complement and microglia mediate early synapse loss in Alzheimer mouse models. Science 352, 712–6 (2016). sourceExperimental — accuracy not yet measured
The paper reports that inhibiting C1q, C3, or the microglial complement receptor CR3 reduces early synapse loss in Alzheimer mouse models. The claim’s broader wording about AD progression is not established: the discussion says the findings concern pre-plaque models and leaves a role in plaque-associated synapse loss for future study. (LLM, conf=0.85)
plaindirect- Asserted: passes — The authors put it forward as true.
- Checkable: passes — It can be checked against evidence.
- Load-bearing: passes — The paper’s conclusions depend on it.
- Based: passes — The paper gives a reason why it holds.
Probably not a substantial claim.
The cited sources support only part of this claim — read each source’s verdict below.
In the paper
“People with DS are the largest human population with a genetic predisposition to early-onset AD, which is largely explained by the presence of the APP gene on chr2173.”
§ Trisomy 21 causes changes in the circulating proteome indicative of chronic autoinflammation > Results and Discussion > Trisomy 21 causes hypocomplementia
What the sources say
- Partly supportedcites [73] Schupf, N. & Sergievsky, G. H. Genetic and host factors for dementia in Down’s syndrome. Br. J. Psychiatry 180, 405–10 (2002). sourceExperimental — accuracy not yet measured
The paper’s Background and Amyloid Cascade Hypothesis sections link the high risk of Alzheimer’s-related dementia in Down syndrome to triplication and overexpression of APP on chromosome 21, while noting that other factors affect the age of onset. Our copy does not establish that people with Down syndrome are the largest human population with this genetic predisposition. (LLM, conf=0.86)
plaindirect- Asserted: passes — The authors put it forward as true.
- Checkable: passes — It can be checked against evidence.
- Load-bearing: fails — The paper’s conclusions may not depend on it.
- Based: passes — The paper gives a reason why it holds.
Probably not a substantial claim. The paper’s conclusions may not depend on it. It may state two separate claims as one.
- Partly supported
The sources with a verdict support this claim; the rest weren’t checked yet, have no full text we could read, or their verdicts aren’t rated yet.
In the paper
“Hypocomplementia could clearly contribute to the observed increased risk of bacterial lung pneumonia and otitis media in the population with DS68, as complement depletion prevents proper clearance of Streptococcus pneumoniae 69.”
§ Trisomy 21 causes changes in the circulating proteome indicative of chronic autoinflammation > Results and Discussion > Trisomy 21 causes hypocomplementia
What the sources say
- Not checked — no full text of the sourcecites [68] Ram, G. & Chinen, J. Infections and immunodeficiency in Down syndrome. Clin. Exp. Immunol. 164, 9–16 (2011). source
- Supportedcites [69] Gross, G. N., Rehm, S. R. & Pierce, A. K. The effect of complement depletion on lung clearance of bacteria. J. Clin. Invest. 62, 373–8 (1978). source
The Abstract reports that complement-depleted animals cleared less Streptococcus pneumoniae from their lungs after four hours than controls (75% versus 91%). This supports the clearance claim attached to citation 69. The Down syndrome and otitis media context is attached to citation 68, not this source. (LLM, conf=0.93)
boostedconditional- Asserted: passes — The authors put it forward as true.
- Checkable: passes — It can be checked against evidence.
- Load-bearing: passes — The paper’s conclusions depend on it.
- Based: passes — The paper gives a reason why it holds.
It may state two separate claims as one.
Every source the paper cites for this claim was checked and supports it.
In the paper
“we reported the results of transcriptome analyses of four different cell types obtained from people with and without T21, which demonstrated that T21 causes widespread alterations in gene expression across the genome”
§ Trisomy 21 causes changes in the circulating proteome indicative of chronic autoinflammation > Introduction
What the sources say
- Supportedcites [17] Sullivan, K. D. et al. Trisomy 21 consistently activates the interferon response. Elife 5, e16220 (2016). source
The Results sections report transcriptome analyses of four human cell types—fibroblasts, lymphoblastoids, monocytes, and T cells—from people with and without T21. They describe widespread gene-expression changes associated with T21, including differentially expressed genes distributed across the genome rather than confined to chromosome 21. (LLM, conf=0.94)
boosteddirect- Asserted: passes — The authors put it forward as true.
- Checkable: passes — It can be checked against evidence.
- Load-bearing: passes — The paper’s conclusions depend on it.
- Based: passes — The paper gives a reason why it holds.
Probably not a substantial claim.
- Supported
The cited sources support only part of this claim — read each source’s verdict below.
In the paper
“A third neurotrophin receptor required for normal GABAergic synapse development, SLITRK383, is also downregulated (Fig. 4m).”
§ Trisomy 21 causes changes in the circulating proteome indicative of chronic autoinflammation > Results and Discussion > Trisomy 21 causes changes in circulating levels of growth factor receptors and proteins involved in neurogenesis
What the sources say
- Partly supportedcites [83] Takahashi, H. et al. Selective control of inhibitory synapse development by Slitrk3-PTPδ trans-synaptic interaction. Nat. Neurosci. 15, 389–98, S1-2 (2012). sourceExperimental — accuracy not yet measured
The Abstract and Discussion identify Slitrk3 as required for normal functional GABAergic synapse development. They describe it as a postsynaptic adhesion molecule, however, not a neurotrophin receptor; the receptor identified for its trans-synaptic interaction is PTPδ. No page numbers are available in our copy. (LLM, conf=0.88)
plaindirect- Asserted: passes — The authors put it forward as true.
- Checkable: passes — It can be checked against evidence.
- Load-bearing: fails — The paper’s conclusions may not depend on it.
- Based: passes — The paper gives a reason why it holds.
Probably not a substantial claim. The paper’s conclusions may not depend on it. It may state two separate claims as one.
- Partly supported
The cited sources support only part of this claim — read each source’s verdict below.
In the paper
“Of note, VEGFA induction is a hallmark of inflammatory processes leading to wound healing81.”
§ Trisomy 21 causes changes in the circulating proteome indicative of chronic autoinflammation > Results and Discussion > Trisomy 21 causes changes in circulating levels of growth factor receptors and proteins involved in neurogenesis
What the sources say
- Partly supportedcites [81] Roth, D. et al. Plasmin modulates vascular endothelial growth factor-A-mediated angiogenesis during wound repair. Am. J. Pathol. 168, 670–84 (2006). sourceExperimental — accuracy not yet measured
The wound-healing results report increased cellular infiltration and vascularized granulation tissue after VEGF165 treatment, and the Discussion links VEGF165 treatment to improved re-epithelialization (pages unavailable). These passages support a role for VEGF-A in wound repair, but they do not establish that endogenous VEGF-A induction is a hallmark of inflammatory processes leading to healing. (LLM, conf=0.84)
plaindirect- Asserted: passes — The authors put it forward as true.
- Checkable: passes — It can be checked against evidence.
- Load-bearing: fails — The paper’s conclusions may not depend on it.
- Based: passes — The paper gives a reason why it holds.
Probably not a substantial claim. The paper’s conclusions may not depend on it.
- Partly supported
Every source the paper cites for this claim was checked and supports it.
In the paper
“Of note, altered GABAergic signaling has been linked to the cognitive deficits caused by T21 in myriad studies (reviewed in84).”
§ Trisomy 21 causes changes in the circulating proteome indicative of chronic autoinflammation > Results and Discussion > Trisomy 21 causes changes in circulating levels of growth factor receptors and proteins involved in neurogenesis
What the sources say
- Supportedcites [84] Contestabile, A., Magara, S. & Cancedda, L. The GABAergic Hypothesis for Cognitive Disabilities in Down Syndrome. Front. Cell. Neurosci. 11, 54 (2017). source
The review’s section on pharmacological interventions to rescue cognitive deficits in Down syndrome mouse models reports that blocking GABAB signaling restored cognitive performance in Ts65Dn mice and links that signaling to cognitive impairment. Its discussion of GABA signaling in DS mouse models also describes altered GABAergic activity. This supports the citing sentence’s broad, hedged claim of a link. (LLM, conf=0.92)
plaincorrelational- Asserted: passes — The authors put it forward as true.
- Checkable: passes — It can be checked against evidence.
- Load-bearing: fails — The paper’s conclusions may not depend on it.
- Based: passes — The paper gives a reason why it holds.
Probably not a substantial claim. The paper’s conclusions may not depend on it.
- Supported
A result the paper reports from its own data — it cites no other source for it, so there is none to check. The quote shows it is in the paper.
In the paper
“only five proteins in total were differentially detected in females versus males.”
§ Trisomy 21 causes changes in the circulating proteome indicative of chronic autoinflammation > Results and Discussion > Trisomy 21 causes consistent global changes in the circulating proteome
plain- Asserted: passes — The authors put it forward as true.
- Checkable: passes — It can be checked against evidence.
- Load-bearing: fails — The paper’s conclusions may not depend on it.
- Based: passes — The paper gives a reason why it holds.
Probably not a substantial claim. The paper’s conclusions may not depend on it.
A result the paper reports from its own data — it cites no other source for it, so there is none to check. The quote shows it is in the paper.
In the paper
“This group consists of 21 proteins, 18 of which are downregulated in the circulating proteome of people with DS”
§ Trisomy 21 causes changes in the circulating proteome indicative of chronic autoinflammation > Results and Discussion > Trisomy 21 causes hypocomplementia
plaincorrelational- Asserted: passes — The authors put it forward as true.
- Checkable: passes — It can be checked against evidence.
- Load-bearing: passes — The paper’s conclusions depend on it.
- Based: passes — The paper gives a reason why it holds.
It may state two separate claims as one.
A result the paper reports from its own data — it cites no other source for it, so there is none to check. The quote shows it is in the paper.
In the paper
“The largest group of physically interacting proteins included factors with key roles in antigen presentation, autoimmunity, and T cell regulation, including B2M, LILRB1, LILRB2, FCRL3, ZAP70, and ERAP2, many of which have been linked to autoimmune disorders”
§ Trisomy 21 causes changes in the circulating proteome indicative of chronic autoinflammation > Results and Discussion > People with Down syndrome display proteome changes indicative of chronic autoinflammation
plaincorrelational- Asserted: passes — The authors put it forward as true.
- Checkable: passes — It can be checked against evidence.
- Load-bearing: passes — The paper’s conclusions depend on it.
- Based: passes — The paper gives a reason why it holds.
It may state two separate claims as one.
A result the paper reports from its own data — it cites no other source for it, so there is none to check. The quote shows it is in the paper.
In the paper
“Another inflammatory cytokine that was also significantly elevated in people with DS in each of the three SOMAscan® studies, but which fell below the statistical significance cut-off in the MSD assay was CCL17 (TARC)”
§ Trisomy 21 causes changes in the circulating proteome indicative of chronic autoinflammation > Results and Discussion > People with Down syndrome display proteome changes indicative of chronic autoinflammation
plaincorrelational- Asserted: passes — The authors put it forward as true.
- Checkable: passes — It can be checked against evidence.
- Load-bearing: unclear — It is unclear whether the paper’s conclusions depend on it.
- Based: passes — The paper gives a reason why it holds.
It may state two separate claims as one.
A result the paper reports from its own data — it cites no other source for it, so there is none to check. The quote shows it is in the paper.
In the paper
“individuals with DS have significantly increased levels of potent inflammatory cytokines and chemokines known to act downstream of IFN signaling, including IL-6, IL-22, MCP-1 (CCL2), TNF-α, and VEGF-A”
§ Trisomy 21 causes changes in the circulating proteome indicative of chronic autoinflammation > Results and Discussion > People with Down syndrome display proteome changes indicative of chronic autoinflammation
plaincorrelationaln = 40- Asserted: passes — The authors put it forward as true.
- Checkable: passes — It can be checked against evidence.
- Load-bearing: passes — The paper’s conclusions depend on it.
- Based: passes — The paper gives a reason why it holds.
It may state two separate claims as one.
A result the paper reports from its own data — it cites no other source for it, so there is none to check. The quote shows it is in the paper.
In the paper
“Among the 50 proteins encoded on chr21 for which aptamers were available, 9 were significantly upregulated, and none significantly downregulated”
§ Trisomy 21 causes changes in the circulating proteome indicative of chronic autoinflammation > Results and Discussion > Trisomy 21 causes consistent global changes in the circulating proteome
plaincorrelational- Asserted: passes — The authors put it forward as true.
- Checkable: passes — It can be checked against evidence.
- Load-bearing: passes — The paper’s conclusions depend on it.
- Based: passes — The paper gives a reason why it holds.
It may state two separate claims as one.
A result the paper reports from its own data — it cites no other source for it, so there is none to check. The quote shows it is in the paper.
In the paper
“CST3, B2M, and TFF3, which are among the most significantly upregulated proteins in DS”
§ Trisomy 21 causes changes in the circulating proteome indicative of chronic autoinflammation > Results and Discussion > Trisomy 21 causes hypocomplementia
plaincorrelational- Asserted: passes — The authors put it forward as true.
- Checkable: passes — It can be checked against evidence.
- Load-bearing: passes — The paper’s conclusions depend on it.
- Based: passes — The paper gives a reason why it holds.
It may state two separate claims as one.
A result the paper reports from its own data — it cites no other source for it, so there is none to check. The quote shows it is in the paper.
In the paper
“Examination of individual chromosomes did not reveal any obvious spatial relationships among deregulated proteins, with the notable exception of proteins encoded on chr21, which display a consistent trend toward upregulation”
§ Trisomy 21 causes changes in the circulating proteome indicative of chronic autoinflammation > Results and Discussion > Trisomy 21 causes consistent global changes in the circulating proteome
plain- Asserted: passes — The authors put it forward as true.
- Checkable: passes — It can be checked against evidence.
- Load-bearing: passes — The paper’s conclusions depend on it.
- Based: passes — The paper gives a reason why it holds.
It may state two separate claims as one.
A result the paper reports from its own data — it cites no other source for it, so there is none to check. The quote shows it is in the paper.
In the paper
“The SOMAscan® proteomics platform revealed elevated circulating levels of the two TNF-α receptors, TNFRSF1A and TNFRSF1B, as well as the protein kinase RFK which is required for ROS production downstream of TNF-α receptor engagement”
§ Trisomy 21 causes changes in the circulating proteome indicative of chronic autoinflammation > Results and Discussion > People with Down syndrome display proteome changes indicative of chronic autoinflammation
plaincorrelational- Asserted: passes — The authors put it forward as true.
- Checkable: passes — It can be checked against evidence.
- Load-bearing: passes — The paper’s conclusions depend on it.
- Based: passes — The paper gives a reason why it holds.
It may state two separate claims as one.
A result the paper reports from its own data — it cites no other source for it, so there is none to check. The quote shows it is in the paper.
In the paper
“Overall, 299 proteins were differentially detected between the plasma of individuals with T21 versus euploid controls, as defined by the Kolmogorov-Smirnov (KS) test with Bonferroni-adjusted p-values [p(a)] < 0.1 (Fig. 1a, 178 proteins downregulated in individuals with T21, 121 upregulated, Supplementary File 1).”
§ Trisomy 21 causes changes in the circulating proteome indicative of chronic autoinflammation > Results and Discussion > Trisomy 21 causes consistent global changes in the circulating proteome
plaincorrelationaln = 172- Asserted: passes — The authors put it forward as true.
- Checkable: passes — It can be checked against evidence.
- Load-bearing: passes — The paper’s conclusions depend on it.
- Based: passes — The paper gives a reason why it holds.
It may state two separate claims as one.
A result the paper reports from its own data — it cites no other source for it, so there is none to check. The quote shows it is in the paper.
In the paper
“Interestingly, numerous components of the EGF signaling cascade are downregulated in DS, including the receptors EGFR, ERBB3, and ERBB4, and the ligand itself (HBEGF) (Fig. 4g–j).”
§ Trisomy 21 causes changes in the circulating proteome indicative of chronic autoinflammation > Results and Discussion > Trisomy 21 causes changes in circulating levels of growth factor receptors and proteins involved in neurogenesis
plaindirect- Asserted: passes — The authors put it forward as true.
- Checkable: passes — It can be checked against evidence.
- Load-bearing: unclear — It is unclear whether the paper’s conclusions depend on it.
- Based: passes — The paper gives a reason why it holds.
It may state two separate claims as one.
A conclusion the paper draws from its own results — it cites no other source for it, so there is none to check. The quote shows it is in the paper.
In the paper
“suggesting that chronic activation of interferon signaling could cause complement consumption”
§ Trisomy 21 causes changes in the circulating proteome indicative of chronic autoinflammation > Results and Discussion > Trisomy 21 causes hypocomplementia
hedgedconditional- Asserted: passes — The authors put it forward as true.
- Checkable: passes — It can be checked against evidence.
- Load-bearing: passes — The paper’s conclusions depend on it.
- Based: passes — The paper gives a reason why it holds.
Probably not a substantial claim.
A claim is checked only against the cited paper’s full text, never its abstract, and none is available for its sources.
In the paper
“In fact, hypocomplementia is a common feature of type I interferonopathies66,67”
§ Trisomy 21 causes changes in the circulating proteome indicative of chronic autoinflammation > Results and Discussion > Trisomy 21 causes hypocomplementia
What the sources say
- Not checked — no full text of the sourcecites [66] Crow, Y. J. & Manel, N. Aicardi-Goutières syndrome and the type I interferonopathies. Nat. Rev. Immunol. 15, 429–40 (2015). source
- Not checked — no full text of the sourcecites [67] Pickering, M. C. & Walport, M. J. Links between complement abnormalities and systemic lupus erythematosus. Rheumatology (Oxford). 39, 133–41 (2000). source
plaincorrelational- Asserted: passes — The authors put it forward as true.
- Checkable: passes — It can be checked against evidence.
- Load-bearing: passes — The paper’s conclusions depend on it.
- Based: passes — The paper gives a reason why it holds.
Probably not a substantial claim.
A conclusion the paper draws from its own results — it cites no other source for it, so there is none to check. The quote shows it is in the paper.
In the paper
“In sum, these results reveal a clear pro-inflammatory signature in the circulating proteome of people with DS, with multiple ties to interferon signaling.”
§ Trisomy 21 causes changes in the circulating proteome indicative of chronic autoinflammation > Results and Discussion > People with Down syndrome display proteome changes indicative of chronic autoinflammation
boostedcorrelational- Asserted: passes — The authors put it forward as true.
- Checkable: passes — It can be checked against evidence.
- Load-bearing: passes — The paper’s conclusions depend on it.
- Based: passes — The paper gives a reason why it holds.
It may state two separate claims as one.
A conclusion the paper draws from its own results — it cites no other source for it, so there is none to check. The quote shows it is in the paper.
In the paper
“Thus, we posit that hypocomplementia could modulate AD progression in these individuals.”
§ Trisomy 21 causes changes in the circulating proteome indicative of chronic autoinflammation > Results and Discussion > Trisomy 21 causes hypocomplementia
hedgedconditional- Asserted: passes — The authors put it forward as true.
- Checkable: passes — It can be checked against evidence.
- Load-bearing: passes — The paper’s conclusions depend on it.
- Based: passes — The paper gives a reason why it holds.
Probably not a substantial claim.
A claim is checked only against the cited paper’s full text, never its abstract, and none is available for its sources.
In the paper
“Gain-of-function mutations in FGFR1 are associated with myeloproliferative disorders leading to leukemia, as well as hereditary conditions leading to skeletal and craniofacial abnormalities, both of which are common in DS78–80.”
§ Trisomy 21 causes changes in the circulating proteome indicative of chronic autoinflammation > Results and Discussion > Trisomy 21 causes changes in circulating levels of growth factor receptors and proteins involved in neurogenesis
What the sources say
- Not checked — no full text of the sourcecites [78] Ibrahimi, O. A., Zhang, F., Eliseenkova, A. V., Linhardt, R. J. & Mohammadi, M. Proline to arginine mutations in FGF receptors 1 and 3 result in Pfeiffer and Muenke craniosynostosis syndromes through enhancement of FGF binding affinity. Hum. Mol. Genet. 13, 69–78 (2004). source
- Not checked — no full text of the sourcecites [79] Muenke, M. et al. A common mutation in the fibroblast growth factor receptor 1 gene in Pfeiffer syndrome. Nat. Genet. 8, 269–274 (1994). source
- Not checked — no full text of the sourcecites [80] Jackson, C. C., Medeiros, L. J. & Miranda, R. N. 8p11 myeloproliferative syndrome: a review. Hum. Pathol. 41, 461–76 (2010). source
plaincorrelational- Asserted: passes — The authors put it forward as true.
- Checkable: passes — It can be checked against evidence.
- Load-bearing: fails — The paper’s conclusions may not depend on it.
- Based: passes — The paper gives a reason why it holds.
Probably not a substantial claim. The paper’s conclusions may not depend on it.
In the paper
“both beta amyloid deposits and soluble B2M are known to activate the classic complement cascade77”
§ Trisomy 21 causes changes in the circulating proteome indicative of chronic autoinflammation > Results and Discussion > Trisomy 21 causes hypocomplementia
What the sources say
- Not checked — no full text of the sourcecites [77] Nybo, M., Nielsen, E. H. & Svehag, S. E. Complement activation by the amyloid proteins A beta peptide and beta 2-microglobulin. Amyloid 6, 265–72 (1999). source
boosteddirect- Asserted: passes — The authors put it forward as true.
- Checkable: passes — It can be checked against evidence.
- Load-bearing: passes — The paper’s conclusions depend on it.
- Based: passes — The paper gives a reason why it holds.
It may state two separate claims as one.
What the paper did — it cites no source for this, so there is none to check. The quote shows it is in the paper.
In the paper
“Select proteins of interest, such as B2M and CST3 (cystatin C) were confirmed by Western blot using samples from the low and high SOMAmer® detection range (Fig. 1 S2).”
§ Trisomy 21 causes changes in the circulating proteome indicative of chronic autoinflammation > Results and Discussion > Trisomy 21 causes consistent global changes in the circulating proteome
plain- Asserted: passes — The authors put it forward as true.
- Checkable: passes — It can be checked against evidence.
- Load-bearing: fails — The paper’s conclusions may not depend on it.
- Based: passes — The paper gives a reason why it holds.
Probably not a substantial claim. The paper’s conclusions may not depend on it.
A claim is checked only against the cited paper’s full text, never its abstract, and none is available for its sources.
In the paper
“Hypocomplementia is a hallmark of immune complex diseases, a diverse group of inflammatory conditions characterized by antigen–antibody deposition and consequent complement activation64, including interferon-driven conditions such as SLE65.”
§ Trisomy 21 causes changes in the circulating proteome indicative of chronic autoinflammation > Results and Discussion > Trisomy 21 causes hypocomplementia
What the sources say
- Not checked — no full text of the sourcecites [64] Nydegger, U. E. Immune complex pathophysiology. Ann. N. Y. Acad. Sci. 1109, 66–83 (2007). source
- Not checked — no full text of the sourcecites [65] Ramos-Casals, M. et al. Hypocomplementemia in systemic lupus erythematosus and primary antiphospholipid syndrome: prevalence and clinical significance in 667 patients. Lupus 13, 777–83 (2004). source
plaincorrelational- Asserted: passes — The authors put it forward as true.
- Checkable: passes — It can be checked against evidence.
- Load-bearing: fails — The paper’s conclusions may not depend on it.
- Based: passes — The paper gives a reason why it holds.
Probably not a substantial claim. The paper’s conclusions may not depend on it.
In the paper
“For example, NTRK2 and NTRK3, the transmembrane receptors for the Brain Derived Neurotrophic Factor (BDNF) and Neurotrophin 3, respectively82, are clearly downregulated in the plasma of people with DS (Fig. 4k,l).”
§ Trisomy 21 causes changes in the circulating proteome indicative of chronic autoinflammation > Results and Discussion > Trisomy 21 causes changes in circulating levels of growth factor receptors and proteins involved in neurogenesis
What the sources say
- Not checked — no full text of the sourcecites [82] Meldolesi, J. Neurotrophin Receptors in the Pathogenesis, Diagnosis and Therapy of Neurodegenerative Diseases. Pharmacol. Res. https://doi.org/10.1016/j.phrs.2017.04.024 (2017). source
plain- Asserted: passes — The authors put it forward as true.
- Checkable: passes — It can be checked against evidence.
- Load-bearing: fails — The paper’s conclusions may not depend on it.
- Based: passes — The paper gives a reason why it holds.
Probably not a substantial claim. The paper’s conclusions may not depend on it.
What the paper did — it cites no source for this, so there is none to check. The quote shows it is in the paper.
In the paper
“Multiple hypothesis correction was performed using the Benjamini-Hochberg method.”
§ Trisomy 21 causes changes in the circulating proteome indicative of chronic autoinflammation > Materials and Methods > MSD assay
plainn = 40- Asserted: passes — The authors put it forward as true.
- Checkable: passes — It can be checked against evidence.
- Load-bearing: passes — The paper’s conclusions depend on it.
- Based: passes — The paper gives a reason why it holds.
Probably not a substantial claim.
In the paper
“Finally, RET, a receptor tyrosine kinase of the cadherin superfamily with key roles in neural crest development85, also displays lower circulating levels in people with DS (Fig. 4n).”
§ Trisomy 21 causes changes in the circulating proteome indicative of chronic autoinflammation > Results and Discussion > Trisomy 21 causes changes in circulating levels of growth factor receptors and proteins involved in neurogenesis
What the sources say
- Not checked — no full text of the sourcecites [85] Delalande, J.-M. et al. The receptor tyrosine kinase RET regulates hindgut colonization by sacral neural crest cells. Dev. Biol. 313, 279–92 (2008). source
plain- Asserted: passes — The authors put it forward as true.
- Checkable: passes — It can be checked against evidence.
- Load-bearing: fails — The paper’s conclusions may not depend on it.
- Based: passes — The paper gives a reason why it holds.
Probably not a substantial claim. The paper’s conclusions may not depend on it. It may state two separate claims as one.
In the paper
“Interestingly, loss-of-function mutations in RET cause Hirschsprung’s disease86, which is significantly more prevalent in people with DS87.”
§ Trisomy 21 causes changes in the circulating proteome indicative of chronic autoinflammation > Results and Discussion > Trisomy 21 causes changes in circulating levels of growth factor receptors and proteins involved in neurogenesis
What the sources say
- Not checked — no full text of the sourcecites [87] Friedmacher, F. & Puri, P. Hirschsprung’s disease associated with Down syndrome: a meta-analysis of incidence, functional outcomes and mortality. Pediatr. Surg. Int. 29, 937–46 (2013). source
plaincorrelational- Asserted: passes — The authors put it forward as true.
- Checkable: passes — It can be checked against evidence.
- Load-bearing: fails — The paper’s conclusions may not depend on it.
- Based: passes — The paper gives a reason why it holds.
Probably not a substantial claim. The paper’s conclusions may not depend on it.
A claim is checked only against the cited paper’s full text, never its abstract, and none is available for its sources.
In the paper
“Gain-of-function mutations in FGFR1 are associated with myeloproliferative disorders leading to leukemia, as well as hereditary conditions leading to skeletal and craniofacial abnormalities, both of which are common in DS78–80.”
§ Trisomy 21 causes changes in the circulating proteome indicative of chronic autoinflammation > Results and Discussion > Trisomy 21 causes changes in circulating levels of growth factor receptors and proteins involved in neurogenesis
What the sources say
- Not checked — no full text of the sourcecites [78] Ibrahimi, O. A., Zhang, F., Eliseenkova, A. V., Linhardt, R. J. & Mohammadi, M. Proline to arginine mutations in FGF receptors 1 and 3 result in Pfeiffer and Muenke craniosynostosis syndromes through enhancement of FGF binding affinity. Hum. Mol. Genet. 13, 69–78 (2004). source
- Not checked — no full text of the sourcecites [79] Muenke, M. et al. A common mutation in the fibroblast growth factor receptor 1 gene in Pfeiffer syndrome. Nat. Genet. 8, 269–274 (1994). source
- Not checked — no full text of the sourcecites [80] Jackson, C. C., Medeiros, L. J. & Miranda, R. N. 8p11 myeloproliferative syndrome: a review. Hum. Pathol. 41, 461–76 (2010). source
plaincorrelational- Asserted: passes — The authors put it forward as true.
- Checkable: passes — It can be checked against evidence.
- Load-bearing: fails — The paper’s conclusions may not depend on it.
- Based: passes — The paper gives a reason why it holds.
Probably not a substantial claim. The paper’s conclusions may not depend on it. It may state two separate claims as one.
What the paper did — it cites no source for this, so there is none to check. The quote shows it is in the paper.
In the paper
“Each sample was assayed in duplicate and absolute values determined using linear regression analysis with standard curves.”
§ Trisomy 21 causes changes in the circulating proteome indicative of chronic autoinflammation > Materials and Methods > IgE ELISA
plain- Asserted: passes — The authors put it forward as true.
- Checkable: passes — It can be checked against evidence.
- Load-bearing: fails — The paper’s conclusions may not depend on it.
- Based: passes — The paper gives a reason why it holds.
Probably not a substantial claim. The paper’s conclusions may not depend on it.
In the paper
“For example, NTRK2 and NTRK3, the transmembrane receptors for the Brain Derived Neurotrophic Factor (BDNF) and Neurotrophin 3, respectively82, are clearly downregulated in the plasma of people with DS (Fig. 4k,l).”
§ Trisomy 21 causes changes in the circulating proteome indicative of chronic autoinflammation > Results and Discussion > Trisomy 21 causes changes in circulating levels of growth factor receptors and proteins involved in neurogenesis
What the sources say
- Not checked — no full text of the sourcecites [82] Meldolesi, J. Neurotrophin Receptors in the Pathogenesis, Diagnosis and Therapy of Neurodegenerative Diseases. Pharmacol. Res. https://doi.org/10.1016/j.phrs.2017.04.024 (2017). source
plain- Asserted: passes — The authors put it forward as true.
- Checkable: passes — It can be checked against evidence.
- Load-bearing: fails — The paper’s conclusions may not depend on it.
- Based: passes — The paper gives a reason why it holds.
Probably not a substantial claim. The paper’s conclusions may not depend on it.
A claim is checked only against the cited paper’s full text, never its abstract, and none is available for its sources.
In the paper
“Gain-of-function mutations in FGFR1 are associated with myeloproliferative disorders leading to leukemia, as well as hereditary conditions leading to skeletal and craniofacial abnormalities, both of which are common in DS78–80.”
§ Trisomy 21 causes changes in the circulating proteome indicative of chronic autoinflammation > Results and Discussion > Trisomy 21 causes changes in circulating levels of growth factor receptors and proteins involved in neurogenesis
What the sources say
- Not checked — no full text of the sourcecites [78] Ibrahimi, O. A., Zhang, F., Eliseenkova, A. V., Linhardt, R. J. & Mohammadi, M. Proline to arginine mutations in FGF receptors 1 and 3 result in Pfeiffer and Muenke craniosynostosis syndromes through enhancement of FGF binding affinity. Hum. Mol. Genet. 13, 69–78 (2004). source
- Not checked — no full text of the sourcecites [79] Muenke, M. et al. A common mutation in the fibroblast growth factor receptor 1 gene in Pfeiffer syndrome. Nat. Genet. 8, 269–274 (1994). source
- Not checked — no full text of the sourcecites [80] Jackson, C. C., Medeiros, L. J. & Miranda, R. N. 8p11 myeloproliferative syndrome: a review. Hum. Pathol. 41, 461–76 (2010). source
plaincorrelational- Asserted: passes — The authors put it forward as true.
- Checkable: passes — It can be checked against evidence.
- Load-bearing: fails — The paper’s conclusions may not depend on it.
- Based: passes — The paper gives a reason why it holds.
Probably not a substantial claim. The paper’s conclusions may not depend on it.
What the paper did — it cites no source for this, so there is none to check. The quote shows it is in the paper.
In the paper
“Multiple hypothesis correction was performed using the Bonferroni method for the larger discovery study or the Benjamini-Hochberg method for the smaller Validation Studies.”
§ Trisomy 21 causes changes in the circulating proteome indicative of chronic autoinflammation > Materials and Methods > SOMAscan® assay
plain- Asserted: passes — The authors put it forward as true.
- Checkable: passes — It can be checked against evidence.
- Load-bearing: fails — The paper’s conclusions may not depend on it.
- Based: passes — The paper gives a reason why it holds.
Probably not a substantial claim. The paper’s conclusions may not depend on it.
In the paper
“Interestingly, loss-of-function mutations in RET cause Hirschsprung’s disease86, which is significantly more prevalent in people with DS87.”
§ Trisomy 21 causes changes in the circulating proteome indicative of chronic autoinflammation > Results and Discussion > Trisomy 21 causes changes in circulating levels of growth factor receptors and proteins involved in neurogenesis
What the sources say
- Not checked — no full text of the sourcecites [86] Tomuschat, C. & Puri, P. RET gene is a major risk factor for Hirschsprung’s disease: a meta-analysis. Pediatr. Surg. Int. 31, 701–10 (2015). source
plaindirect- Asserted: passes — The authors put it forward as true.
- Checkable: passes — It can be checked against evidence.
- Load-bearing: fails — The paper’s conclusions may not depend on it.
- Based: passes — The paper gives a reason why it holds.
Probably not a substantial claim. The paper’s conclusions may not depend on it.
What the paper did — it cites no source for this, so there is none to check. The quote shows it is in the paper.
In the paper
“Multiple hypothesis correction was performed using the Bonferroni method for the larger discovery study or the Benjamini-Hochberg method for the smaller Validation Studies.”
§ Trisomy 21 causes changes in the circulating proteome indicative of chronic autoinflammation > Materials and Methods > SOMAscan® assay
plain- Asserted: passes — The authors put it forward as true.
- Checkable: passes — It can be checked against evidence.
- Load-bearing: passes — The paper’s conclusions depend on it.
- Based: passes — The paper gives a reason why it holds.
Probably not a substantial claim.
The paper relies on this without support.
Trisomy 21 causes Down syndrome.
“Trisomy 21 (T21) causes Down syndrome (DS)”
The paper relies on this without support.
The mechanisms by which trisomy 21 produces the different disease spectrum observed in people with Down syndrome are unknown.
“the mechanisms by which T21 produces the different disease spectrum observed in people with DS are unknown”
The paper relies on this without support.
The impact of trisomy 21 on systemic signaling cascades in living individuals with Down syndrome is undefined.
“the impact of T21 on systemic signaling cascades in living individuals with DS is undefined”
The paper relies on this without support.
The four interferon receptors encoded on chromosome 21 are overexpressed in trisomy 21.
“consistent with overexpression of the four interferon receptors encoded on chromosome 21”
Claims other papers make about this one
Each is checked against this paper’s own text: does it say what the citing paper says it does?
The source backs part of the claim, not all of it — or backs it for a different population, condition or comparison.
In the citing paper
“Notably, both individuals with DS and mouse models of DS experience constitutive hyperactivation of interferon (IFN) signaling with signs of chronic inflammation and immune dysregulation,30,31,32,33,34,35,36,37,38,39,40 that could exacerbate the neuroinflammatory response.”
From Interferon signaling modulates Down syndrome-associated Alzheimer’s disease pathology in a mouse model (2025) · cites this paper as [31]
Experimental — accuracy not yet measuredThe source backs part of the claim, not all of it — or backs it for a different population, condition or comparison.
In the citing paper
“people with DS present an increased IFN signaling likely driven by triplication of four of the six IFN receptors encoded on HSA21,36 rather than by massive elevation of the IFN ligands themselves as seen in interferonopathies,80 and this has been associated with chronic immune dysregulation.”
From Interferon signaling modulates Down syndrome-associated Alzheimer’s disease pathology in a mouse model (2025) · cites this paper as [31]
Experimental — accuracy not yet measuredThe cited source says what the claim attributes to it.
In the citing paper
“A study of the circulating proteome did not test for differences in DYRK1A protein expression specifically but did find differences in protein expression in general between males and females (Sullivan et al., 2017).”
From Sex-specific developmental alterations in DYRK1A expression in the brain of a Down syndrome mouse model (2024) · cites this paper as Sullivan et al., 2017
Citations
Cites
STRING v10: protein–protein interaction networks, integrated over the tree of life
Szklarczyk, D., Franceschini, A., Wyder, S., Forslund, K., Heller, D., Huerta-Cepas, J., Simonovic, M., Roth, A., Santos, A., Tsafou, K. P., et al. (2015) · Nucleic Acids Research · doi:10.1093/nar/gku1003 · Cited by 10,436
Differential Diagnosis of Glomerular Disease: A Systematic and Inclusive Approach
Hebert, L. A., Parikh, S. M., Prosek, J. M., Nádasdy, T., & Rovin, B. H. (2013) · American Journal of Nephrology · doi:10.1159/000354390 · Cited by 4,392
Complement and microglia mediate early synapse loss in Alzheimer mouse models
Hong, S., Beja-Glasser, V. F., Nfonoyim, B. M., Frouin, A., Li, S., Ramakrishnan, S., Merry, K. M., Shi, Q., Rosenthal, A., Barres, B. A., et al. (2016) · Science · doi:10.1126/science.aad8373 · Cited by 3,343
Parker, S. E., Mai, C. T., Canfield, M. A., Rickard, R., Wang, Y., Meyer, R. E., Anderson, P., Mason, C. A., Collins, J. S., Kirby, R. S., et al. (2010) · Birth Defects Research Part A Clinical and Molecular Teratology · doi:10.1002/bdra.20735 · Cited by 1,887
Aptamer-Based Multiplexed Proteomic Technology for Biomarker Discovery
Gold, L., Ayers, D., Bertino, J., Bock, C., Bock, A., Brody, E. N., Carter, J., Dalby, A. B., Eaton, B. E., Fitzwater, T., et al. (2010) · PLoS ONE · doi:10.1371/journal.pone.0015004 · Cited by 1,754
Association scan of 14,500 nonsynonymous SNPs in four diseases identifies autoimmunity variants
Wellcome Trust Case Control Consortium, & The Australo-Anglo-American Spondylitis Consortium (TASC) (2007) · Nature Genetics · doi:10.1038/ng.2007.17 · Cited by 1,374
Renal-Limited “Lupus-Like” Nephritis: How Much of a Lupus
AbuMaziad, A. S., Torrealba, J. R., Seikaly, M. G., Hassler, J. R., & Hendricks, A. R. (2017) · Case Reports in Nephrology and Dialysis · doi:10.1159/000475493 · Cited by 1,299
Health Supervision for Children With Down Syndrome
Bull, M. J. (2011) · PEDIATRICS · doi:10.1542/peds.2011-1605 · Cited by 1,298
Strange, A., Spencer, C. C. A., Band, G., Bellenguez, C., Freeman, C., Pirinen, M., Rautanen, A., Su, Z., Donnelly, P., Capon, F., et al. (2010) · Nature Genetics · doi:10.1038/ng.694 · Cited by 1,056
Self-citationAicardi–Goutières syndrome and the type I interferonopathies
Crow, Y. J., & Manel, N. (2015) · Nature Reviews Immunology · doi:10.1038/nri3850 · Cited by 925
Cited by
Sorted by citations
Undulating changes in human plasma proteome profiles across the lifespan
Lehallier, B., Gate, D., Schaum, N., Nanasi, T., Lee, S. E., Yousef, H., Moran Losada, P., Berdnik, D., Keller, A., Verghese, J., et al. (2019) · Nature Medicine · doi:10.1038/s41591-019-0673-2 · Cited by 981
Alzheimer's disease associated with Down syndrome: a genetic form of dementia
Fortea, J., Zaman, S. H., Hartley, S., Rafii, M. S., Head, E., & Carmona-Iragui, M. (2021) · The Lancet Neurology · doi:10.1016/s1474-4422(21)00245-3 · Cited by 357
Bradley, K. C., Finsterbusch, K., Schnepf, D., Crotta, S., Llorian, M., Davidson, S., Fuchs, S. Y., Staeheli, P., & Wack, A. (2019) · Cell Reports · doi:10.1016/j.celrep.2019.05.105 · Cited by 313
“Changes in blood proteomics of Down syndrome individuals resemble those found in type I interferonopathies and other autoinflammatory conditions (Sullivan et al., 2017).”
BackgroundEmergent high fatality lung disease in systemic juvenile arthritis
Saper, V. E., Chen, G., Deutsch, G. H., Guillerman, R. P., Birgmeier, J. A., Jagadeesh, K. A., Canna, S., Schulert, G. S., Deterding, R. R., Xu, J., et al. (2019) · Annals of the Rheumatic Diseases · doi:10.1136/annrheumdis-2019-216040 · Cited by 228
“64 An association of T21 and PAP in the context of haematological malignancy also has been reported.”
Non-IgE-Mediated Gastrointestinal Food Allergies in Children: An Update
Labrosse, R., Graham, F. J., & Caubet, J. (2020) · Nutrients · doi:10.3390/nu12072086 · Cited by 179
“Conversely, regulatory T cells (Tregs) and IL-10 secretion may play a role in the acquisition of tolerance [37,49,51].”
Background
Metadata
- Authors
- Sullivan, K. D., Evans, D., Pandey, A., Hraha, T. H., Smith, K. P., Markham, N., Rachubinski, A. L., Wolter-Warmerdam, K., Hickey, F., Espinosa, J. M., & Blumenthal, T.
- Affiliations
- University of Colorado Anschutz (US)
- SomaLogic (United States) (US)
- Children's Hospital Colorado (US)
- University of Colorado Boulder (US)
- Corresponding author
- Espinosa, Joaquin M.
- Blumenthal, Thomas
- ORCID
- Venue
- Scientific Reports
- Published
- 2017-11-01
- Volume
- 7
- Issue
- 1
- Pages
- 14818-14818
- ISSN
- 2045-2322 (ISSN-L)
- PMC
- PMC5665944
- OpenAlex
- W2766826848
- Cited by
- 228
- References
- 95
- Citations by year
- 2026: 23 · 2025: 21 · 2024: 33 · 2023: 29 · 2022: 34 · 2021: 29 · 2020: 31 · 2019: 19 · 2018: 9
- FWCI
- 13.90
- Type
- journal article
- Language
- en
- Open access
- gold
- doi.org
- Locations
- Scientific Reports (publishedVersion, cc-by)
- PubMed (publishedVersion)
- PubMed Central (submittedVersion, cc-by)
- DOAJ (DOAJ: Directory of Open Access Journals) (submittedVersion)
- Funders
- Global Down Syndrome Foundation
- Anna and John J. Sie Foundation
- Linda Crnic Institute for Down Syndrome, University of Colorado School of Medicine, Anschutz Medical Campus
- Topics
- Health Sciences › Medicine › Public Health, Environmental and Occupational Health › Down syndrome and intellectual disability research
- Life Sciences › Immunology and Microbiology › Immunology › interferon and immune responses
- Life Sciences › Immunology and Microbiology › Immunology › Immunodeficiency and Autoimmune Disorders
- Keywords
- Down syndrome, circulating proteome, interferonopathies, type I interferon signaling, interferon receptor, complement system, inflammatory cytokines, immune dysregulation, growth factor signaling, immunomodulatory therapy
- MeSH terms
- Adolescent, Adult, Child, Child, Preschool, Chronic Disease, Complement System Proteins, Down Syndrome, Female, Humans, Infant, Inflammation, Male, Trisomy, Cytokines, Receptors, Growth Factor, Proteome, Young Adult
About these checks
Registry, retraction, Cites and statistics results are computed, not judged, with one exception: a printed reference that no index lists is read once by a model before it counts as a citation error. Claims are extracted by a model and kept only when their quote appears verbatim in the text; each cited source is then checked, with a model’s help, for whether it says what the claim relies on. Those verdicts can be wrong — read the claim’s quote and the cited source before relying on one.
A language model drew the claims from the paper on 2026-10-27, under version 3 of the claim definition (model deepseek-v4.1-flash, prompt extract-v3).
A second model labelled each claim on 2026-10-27 (model jev-1.13-20260917, definition revision gold-guideline-v0.2).
Cited sources are checked with a language model’s help (gpt-6-sol).
Statistics and arithmetic are recomputed, not judged.
Confidence bands are shown only for fields calibrated on our annotated test set. None is calibrated yet, so no band is shown.
What counts as a claim ›How we measure confidence ›How we check this ›
Are you an author, or do you see a problem with this page? Request a review
