

The DOI matches its Crossref record; 55 of the 55 references it cites were found in a registry or an index.
Global transcriptomic analysis suggests carbon dioxide as an environmental stressor in spaceflight: A systems biology GeneLab case study
Open accessAbstract
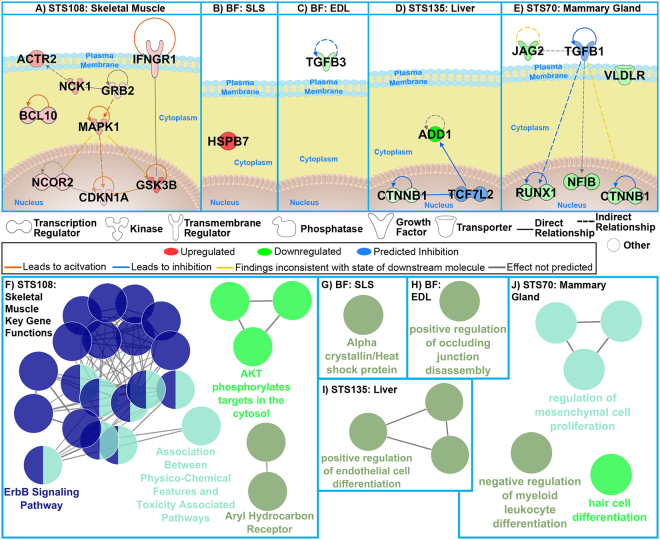
Spaceflight introduces a combination of environmental stressors, including microgravity, ionizing radiation, changes in diet and altered atmospheric gas composition. In order to understand the impact of each environmental component on astronauts it is important to investigate potential influences in isolation. Rodent spaceflight experiments involve both standard vivarium cages and animal enclosure modules (AEMs), which are cages used to house rodents in spaceflight. Ground control AEMs are engineered to match the spaceflight environment. There are limited studies examining the biological response invariably due to the configuration of AEM and vivarium housing. To investigate the innate global transcriptomic patterns of rodents housed in spaceflight-matched AEM compared to standard vivarium cages we utilized publicly available data from the NASA GeneLab repository. Using a systems biology approach, we observed that AEM housing was associated with significant transcriptomic differences, including reduced metabolism, altered immune responses, and activation of possible tumorigenic pathways. Although we did not perform any functional studies, our findings revealed a mild hypoxic phenotype in AEM, possibly due to atmospheric carbon dioxide that was increased to match conditions in spaceflight. Our investigation illustrates the process of generating new hypotheses and informing future experimental research by repurposing multiple space-flown datasets.
Overview
The claims and statistics of this paper haven’t been checked yet.
Free: it reads the open-access text and checks the first 5 claims that cite a source we can check. Create a free account to check every claim.
Integrity signals
Registry
Cites
Statistics
Figures


Verification
Claims the paper makes
The claims and statistics of this paper haven’t been checked yet.
Free: it reads the open-access text and checks the first 5 claims that cite a source we can check. Create a free account to check every claim.
Claims other papers make about this one
Each is checked against this paper’s own text: does it say what the citing paper says it does?
The source backs part of the claim, not all of it — or backs it for a different population, condition or comparison.
In the citing paper
“Our results in muscle tissue are consistent with previous findings (Beheshti et al., 2018), suggesting reduced muscle loading due to microgravity is a strong driver of gene regulation that can influence transcriptional responses to spaceflight.”
From Comprehensive Multi-omics Analysis Reveals Mitochondrial Stress as a Central Biological Hub for Spaceflight Impact (2020) · cites this paper as Beheshti et al., 2018
Experimental — accuracy not yet measured
Self-check
Percentages, sums and reported differences re-computed from the paper’s own numbers.
The self-check needs the paper’s full text.
Citations
Cites
Subramanian, A., Tamayo, P., Mootha, V. K., Mukherjee, S., Ebert, B. L., Gillette, M. A., Paulovich, A., Pomeroy, S. L., Golub, T. R., Lander, E. S., et al. (2005) · Proceedings of the National Academy of Sciences · doi:10.1073/pnas.0506580102 · Cited by 53,625
Bolstad, B. M., Irizarry, R. A., Åstrand, M., & Speed, T. P. (2003) · Bioinformatics · doi:10.1093/bioinformatics/19.2.185 · Cited by 8,266
Bindea, G., Mlecnik, B., Hackl, H., Charoentong, P., Tosolini, M., Kirilovsky, A., Fridman, W.-H., Pagès, F., Trajanoski, Z., & Galon, J. (2009) · Bioinformatics · doi:10.1093/bioinformatics/btp101 · Cited by 6,280
(1992) · Applied Ergonomics · doi:10.1016/0003-6870(92)90318-p · Cited by 5,737
[9] TM4 Microarray Software Suite
Saeed, A. I., Bhagabati, N. K., Braisted, J. C., Liang, W., Sharov, V., Howe, E. A., Li, J., Thiagarajan, M., White, J. A., & Quackenbush, J. (2006) · Methods in Enzymology · doi:10.1016/s0076-6879(06)11009-5 · Cited by 1,983
TGF-β and epithelial-to-mesenchymal transitions
Zavadil, J., & Böttinger, E. P. (2005) · Oncogene · doi:10.1038/sj.onc.1208927 · Cited by 1,578
Allen, J. G., MacNaughton, P., Satish, U., Santanam, S., Vallarino, J., & Spengler, J. D. (2016) · Environmental Health Perspectives · doi:10.1289/ehp.1510037 · Cited by 977
Census and evaluation of p53 target genes
Fischer, M. (2017) · Oncogene · doi:10.1038/onc.2016.502 · Cited by 971
p21: a two-faced genome guardian.
Georgakilas, A. G., Martin, O. A., & Bonner, W. M. (2017) · Trends in Molecular Medicine · doi:10.1016/j.molmed.2017.02.001 · Cited by 489
Jaisser, F., & Farman, N. (2016) · Pharmacological Reviews · doi:10.1124/pr.115.011106 · Cited by 327
Cited by
The NASA Twins Study: A multidimensional analysis of a year-long human spaceflight
Garrett-Bakelman, F. E., Darshi, M., Green, S. J., Gur, R. C., Lin, L., Macias, B. R., McKenna, M. J., Meydan, C., Mishra, T., Nasrini, J., et al. (2019) · Science · doi:10.1126/science.aau8650 · Cited by 1,128
Direct human health risks of increased atmospheric carbon dioxide
Jacobson, T. A., Kler, J. S., Hernke, M. T., Braun, R. K., Meyer, K. C., & Funk, W. E. (2019) · Nature Sustainability · doi:10.1038/s41893-019-0323-1 · Cited by 609
Fundamental Biological Features of Spaceflight: Advancing the Field to Enable Deep-Space Exploration
Afshinnekoo, E., Scott, R. T., MacKay, M. J., Pariset, E., Cekanaviciute, E., Barker, R., Gilroy, S., Hassane, D., Smith, S. M., Zwart, S. R., et al. (2020) · Cell · doi:10.1016/j.cell.2020.10.050 · Cited by 478
Self-citationda Silveira, W. A., Fazelinia, H., Rosenthal, S. B., Laiakis, E. C., Kim, M. S., Meydan, C., Kidane, Y., Rathi, K. S., Smith, S. M., Stear, B., et al. (2020) · Cell · doi:10.1016/j.cell.2020.11.002 · Cited by 402
“Our results in muscle tissue are consistent with previous findings (Beheshti et al., 2018), suggesting reduced muscle loading due to microgravity is a strong driver of gene regulation that can influence transcriptional responses to spaceflight.”
Self-citation
Metadata
- Authors
- Beheshti, A., Cekanaviciute, E., Smith, D. J., & Costes, S. V.
- Affiliations
- Ames Research Center (US)
- Corresponding author
- Beheshti, Afshin
- Costes, Sylvain V.
- Venue
- Scientific Reports
- Published
- 2018-03-08
- Volume
- 8
- Issue
- 1
- Pages
- 4191-4191
- ISSN
- 2045-2322 (ISSN-L)
- PMC
- PMC5843582
- OpenAlex
- W2806335872
- Cited by
- 59
- References
- 55
- Citations by year
- 2026: 8 · 2025: 5 · 2024: 7 · 2023: 8 · 2022: 9 · 2021: 1 · 2020: 8 · 2019: 8 · 2018: 5
- FWCI
- 3.95
- Type
- journal article
- Language
- en
- Open access
- gold
- doi.org
- Licence
- cc-by
- creativecommons.org/licenses/by/4.0 (tdm)
- creativecommons.org/licenses/by/4.0 (vor)
- Locations
- Scientific Reports (publishedVersion, cc-by)
- PubMed Central (publishedVersion, cc-by)
- PubMed (publishedVersion)
- DOAJ (DOAJ: Directory of Open Access Journals) (submittedVersion)
- Funders
- National Aeronautics and Space Administration
- Ames Research Center
- Topics
- Health Sciences › Medicine › Physiology (medical) › Spaceflight effects on biology
- Social Sciences › Political Science and International Relations › Space exploration and regulation
- Life Sciences › Biochemistry, Genetics and Molecular Biology › Molecular Biology › Gene expression and cancer classification
- Keywords
- carbon dioxide, spaceflight, rodent housing, transcriptomics, hypoxia, microgravity, immune response, metabolism, GeneLab, systems biology, data reuse
- MeSH terms
- Animals, Carbon Dioxide, Female, Male, Radiation, Ionizing, Space Flight, Stress, Physiological, Weightlessness, Gene Expression Profiling, Systems Biology, Mice, Rats, Transcriptome
About these checks
Registry, retraction, Cites and statistics results are computed, not judged, with one exception: a printed reference that no index lists is read once by a model before it counts as a citation error. Claims are extracted by a model and kept only when their quote appears verbatim in the text; each cited source is then checked, with a model’s help, for whether it says what the claim relies on. Those verdicts can be wrong — read the claim’s quote and the cited source before relying on one.
Statistics and arithmetic are recomputed, not judged.
Confidence bands are shown only for fields calibrated on our annotated test set. None is calibrated yet, so no band is shown.
What counts as a claim ›How we measure confidence ›How we check this ›
Are you an author, or do you see a problem with this page? Request a review
How to cite
Cite CoChat for the checks on this page, and the paper for its own findings.
- This page
- CoChat. (2026). Citation check: Global transcriptomic analysis suggests carbon dioxide as an environmental stressor in spaceflight: A systems biology GeneLab case study. https://app.cochat.ai/papers/10.1038/s41598-018-22613-1
- The paper
- Beheshti, A., Cekanaviciute, E., Smith, D. J., & Costes, S. V. (2018). Global transcriptomic analysis suggests carbon dioxide as an environmental stressor in spaceflight: A systems biology GeneLab case study. Scientific Reports. https://doi.org/10.1038/s41598-018-22613-1
Data sources
Bibliographic data: Semantic Scholar, OpenAlex, Crossref.
Contains information from the Semantic Scholar Academic Graph Datasets, made available under the ODC Attribution License (ODC-BY 1.0).
Semantic Scholar’s data is described in: Kinney, R., et al. (2023). The Semantic Scholar Open Data Platform. arXiv:2301.10140.
