

The DOI matches its Crossref record; 49 of the 49 references it cites were found in a registry or an index; none of the 46 sources its claims cite is checked for support yet.
Histone deacetylase (HDAC) 1 and 2 complexes regulate both histone acetylation and crotonylation in vivo
Open accessAbstract
Proteomic analysis of histones has shown that they are subject to a superabundance of acylations, which extend far beyond acetylation, to include: crotonylation, propionylation, butyrylation, malonylation, succinylation, β-hydroxybutyrylation and 2-hydroxyisobutyrylation. To date, much of the functional data has focussed on histone crotonylation which, similar to acetylation, has been associated with positive gene regulation and is added by the acyltransferase, p300. Although Sirtuins 1–3, along with HDAC3, have been shown to possess decrotonylase activity in vitro, there is relatively little known about the regulation of histone crotonylation in vivo. Here we show that Histone Deacetylase 1 and 2 (HDAC1/2), the catalytic core of numerous co-repressor complexes, are important histone decrotonylase enzymes. A ternary complex of HDAC1/CoREST1/LSD1 is able to hydrolyse both histone H3 Lys18-acetyl (H3K18ac) and H3 Lys18-crotonyl (H3K18cr) peptide substrates. Genetic deletion of HDAC1/2 in ES cells increases global levels of histone crotonylation and causes an 85% reduction in total decrotonylase activity. Furthermore, we mapped H3K18cr in cells using ChIP-seq, with and without HDAC1/2, and observed increased levels of crotonylation, which largely overlaps with H3K18ac in the vicinity of transcriptional start sites. Collectively, our data indicate that HDAC1/2 containing complexes are critical regulators of histone crotonylation in vivo.
Overview
AI snapshot
Written from the paper’s full text.
TL;DR
HDAC1/2-containing complexes act as histone decrotonylases in vitro and in mouse ES cells; deletion of HDAC1/2 increases global H3K18ac and H3K18cr and reduces total decrotonylase activity by 85%. ChIP-seq shows H3K18cr overlaps H3K18ac near transcription start sites and increases at active/bivalent genes upon HDAC1/2 loss.
Key findings
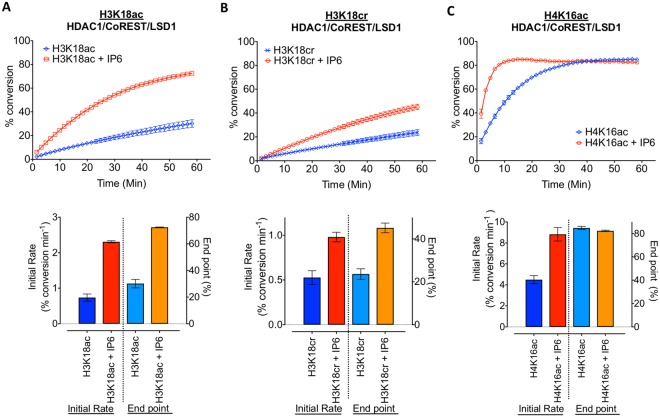
- A recombinant HDAC1/CoREST1/LSD1 ternary complex hydrolysed both H3K18ac and H3K18cr peptides, with a lower initial rate for decrotonylation than deacetylation; InsP6 increased the initial deacetylation rate 3.2-fold and decrotonylation rate 1.8-fold. HDAC3/SMRT/GPS2/TBL1 also showed decrotonylase activity, with an initial rate 2.4-fold lower for H3K18cr than H3K18ac.
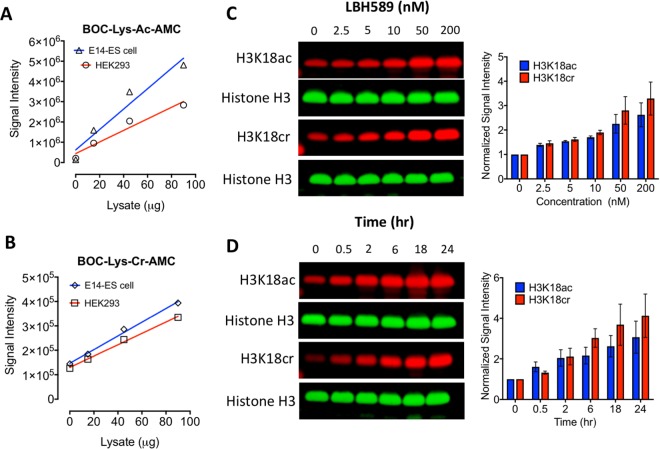
- In ES cells, LBH589 treatment increased H3K18cr 3.2-fold and H3K18ac 2.6-fold in a dose-dependent manner; both marks doubled within 2 hours.
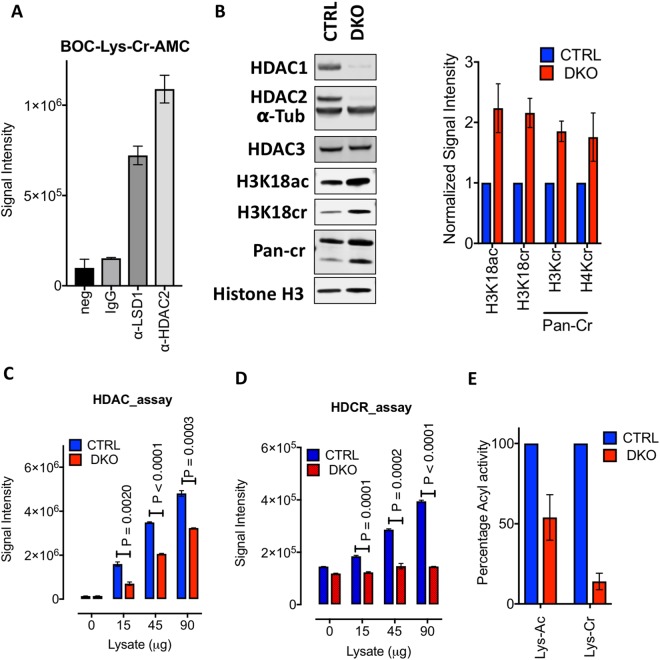
- HDAC1/2 double knockout ES cells showed 2.3-fold higher H3K18ac and 2.2-fold higher H3K18cr, plus 1.8-fold higher total H3 crotonylation and 1.7-fold higher H4 crotonylation; total decrotonylase activity was reduced by 85%, while deacetylase activity was 56% of control.
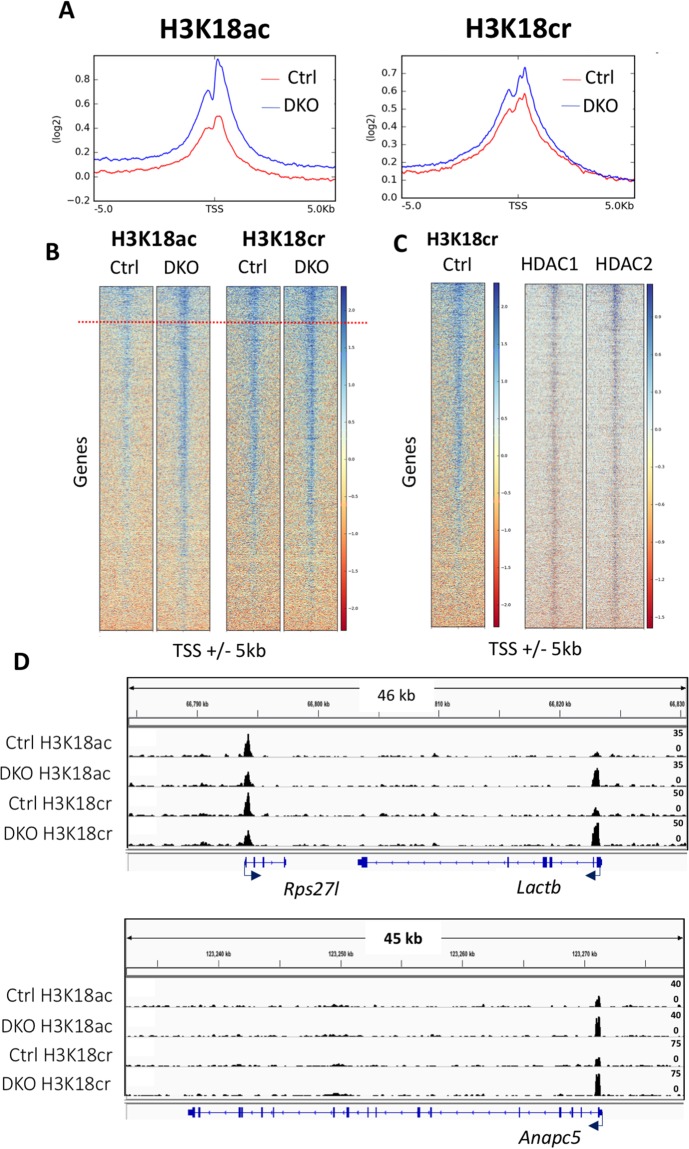
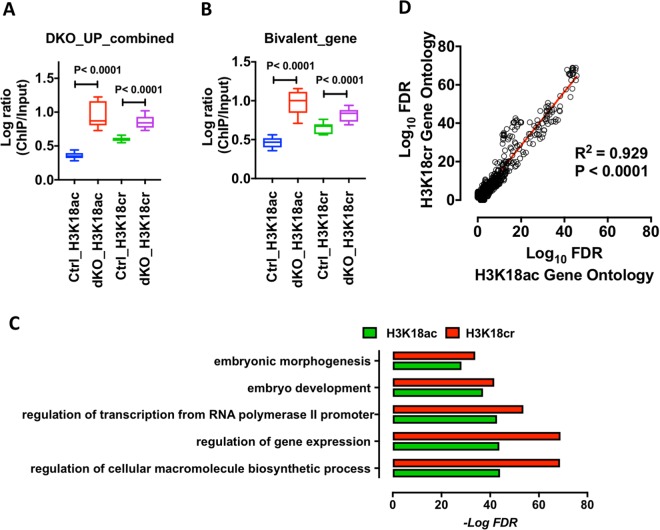
- ChIP-seq in control and HDAC1/2 DKO ES cells showed H3K18cr peaks near TSS overlapping H3K18ac; loss of HDAC1/2 increased average H3K18ac and H3K18cr around TSS, with up to 4-fold increases in H3K18cr at loci such as Lactb and Anapc5, and increased H3K18cr correlated with upregulated genes (p < 0.0001) and GO enrichment overlap (R² = 0.929, p < 0.0001).
Methods
- In vitro deacetylase/decrotonylase assays used Caliper EZ Reader II with 500 nM recombinant HDAC1/CoREST1/LSD1 or HDAC3/SMRT/GPS2/TBL1 complexes and fluorescein-labelled H3K18ac, H3K18cr, and H4K16ac peptides, with or without InsP6.
- Cell assays used mouse ES cells and HEK-293T cells; conditional Hdac1/2 deletion was induced with 1 µM tamoxifen (OHT), HDAC inhibition with LBH589, and activity measured with Boc-Lys(Ac)-AMC and Boc-Lys(Cr)-AMC substrates, plus quantitative western blotting and co-immunoprecipitation with HDAC2/LSD1 antisera.
- ChIP-seq for H3K18ac and H3K18cr was performed in control and DKO ES cells using native ChIP and Illumina HiSeq4000 75 bp sequencing; reads were mapped to mm9, peaks called with MACS, and analyses used deepTools and DAVID, with data deposited at GEO GSE116019.
Limitations
- Paper-stated: prior in vitro studies with isolated recombinant enzymes may not reflect physiological activity, and class-I HDAC activity in vivo depends on binding to complex partners; the paper also notes that in vitro decrotonylation was slower than deacetylation, whereas cellular recovery showed little difference, possibly due to isolated histone-tail peptides versus intact nucleosomes or cooperating factors.
- Evident: the in vitro assays use peptide substrates rather than intact nucleosomes, and the genetic and ChIP-seq findings are largely in mouse ES cells, so generalizability to other cell types or tissues is not established here.
- Evident: some in vitro data are from n = 2 technical replicates (Fig. 1), and although HDAC3 knockout showed no significant global change in H3K18ac/H3K18cr, the paper states this does not preclude locus-specific regulation.
Model-written summary. Check it against the paper before relying on it.
Integrity signals
Registry
Cites
Statistics
Figures
Verification
Claims the paper makes
41 Own result · 28 Not checked yet · 7 Own interpretation · 1 Own method · 1 No basis given
A result the paper reports from its own data — it cites no other source for it, so there is none to check. The quote shows it is in the paper.
In the paper
“Interestingly, both H3K18 modifications were hydrolysed at a reduced rate compared to H4K16Ac (Fig. 1C), indicating that there may be a hierarchy of acylated sites among histone tails.”
§ Histone deacetylase (HDAC) 1 and 2 complexes regulate both histone acetylation and crotonylation in vivo > Results > HDAC1 functions as a histone decrotonylase whose activity is modulated by inositol phosphates
hedgeddirect- Asserted: passes — The authors put it forward as true.
- Checkable: passes — It can be checked against evidence.
- Load-bearing: passes — The paper’s conclusions depend on it.
- Based: passes — The paper gives a reason why it holds.
A result the paper reports from its own data — it cites no other source for it, so there is none to check. The quote shows it is in the paper.
In the paper
“HDAC1 was able to deacylate both H3K18ac and H3K18cr substrates (Fig. 1A,B), although the initial rate of decrotonylation was lower than deacetylation.”
§ Histone deacetylase (HDAC) 1 and 2 complexes regulate both histone acetylation and crotonylation in vivo > Results > HDAC1 functions as a histone decrotonylase whose activity is modulated by inositol phosphates
plain- Asserted: passes — The authors put it forward as true.
- Checkable: passes — It can be checked against evidence.
- Load-bearing: passes — The paper’s conclusions depend on it.
- Based: passes — The paper gives a reason why it holds.
A result the paper reports from its own data — it cites no other source for it, so there is none to check. The quote shows it is in the paper.
In the paper
“A ternary complex of HDAC1/CoREST1/LSD1 is able to hydrolyse both histone H3 Lys18-acetyl (H3K18ac) and H3 Lys18-crotonyl (H3K18cr) peptide substrates.”
- Also stated in: § HDAC1 functions as a histone decrotonylase whose activity is modulated by inositol phosphates · plain
“HDAC1 was able to deacylate both H3K18ac and H3K18cr substrates (Fig. 1A,B), although the initial rate of decrotonylation was lower than deacetylation.”
§ Histone deacetylase (HDAC) 1 and 2 complexes regulate both histone acetylation and crotonylation in vivo > Abstract
plaindirect- Asserted: passes — The authors put it forward as true.
- Checkable: passes — It can be checked against evidence.
- Load-bearing: passes — The paper’s conclusions depend on it.
- Based: passes — The paper gives a reason why it holds.
- Also stated in: § HDAC1 functions as a histone decrotonylase whose activity is modulated by inositol phosphates · plain
A result the paper reports from its own data — it cites no other source for it, so there is none to check. The quote shows it is in the paper.
In the paper
“We also observed an enrichment for H3K18cr at active genes, such Nanog and Pou5f1 (Fig. 4B) consistent with a role for histone crotonylation in active gene expression9,39.”
§ Histone deacetylase (HDAC) 1 and 2 complexes regulate both histone acetylation and crotonylation in vivo > Discussion
plaincorrelational- Asserted: passes — The authors put it forward as true.
- Checkable: passes — It can be checked against evidence.
- Load-bearing: unclear — It is unclear whether the paper’s conclusions depend on it.
- Based: passes — The paper gives a reason why it holds.
- Rests on an assumption: The H3K18cr antibody used for native ChIP specifically detects H3K18cr.
A result the paper reports from its own data — it cites no other source for it, so there is none to check. The quote shows it is in the paper.
In the paper
“Cross-referencing the 1,445 genes up-regulated genes in DKO cells to our ChIP-seq dataset revealed a strong correlation between increased transcription and an increase in H3K18cr (Fig. 5A, p < 0.0001) and H3K18ac (p < 0.0001) levels.”
§ Histone deacetylase (HDAC) 1 and 2 complexes regulate both histone acetylation and crotonylation in vivo > Results > HDAC1/2 regulates H3K18cr levels at active gene loci
boostedcorrelational- Asserted: passes — The authors put it forward as true.
- Checkable: passes — It can be checked against evidence.
- Load-bearing: passes — The paper’s conclusions depend on it.
- Based: passes — The paper gives a reason why it holds.
A result the paper reports from its own data — it cites no other source for it, so there is none to check. The quote shows it is in the paper.
In the paper
“Genetic deletion of HDAC1/2 in ES cells increases global levels of histone crotonylation and causes an 85% reduction in total decrotonylase activity.”
§ Histone deacetylase (HDAC) 1 and 2 complexes regulate both histone acetylation and crotonylation in vivo > Abstract
plaindirect- Asserted: passes — The authors put it forward as true.
- Checkable: passes — It can be checked against evidence.
- Load-bearing: passes — The paper’s conclusions depend on it.
- Based: passes — The paper gives a reason why it holds.
- Rests on an assumption: The changes in histone crotonylation levels upon HDAC1/2 deletion are due to loss of HDAC1/2 decrotonylase activity rather than indirect effects on other enzymes.
A result the paper reports from its own data — it cites no other source for it, so there is none to check. The quote shows it is in the paper.
In the paper
“Individual genes, such as Htra1, Hes6 and Nagk, whose expression increased 2.7, 1.6 and 2.1-fold respectively, showed corresponding increases in H3K18ac and H3K18cr levels (Supplementary Fig. S4).”
§ Histone deacetylase (HDAC) 1 and 2 complexes regulate both histone acetylation and crotonylation in vivo > Results > HDAC1/2 regulates H3K18cr levels at active gene loci
plaincorrelational- Asserted: passes — The authors put it forward as true.
- Checkable: passes — It can be checked against evidence.
- Load-bearing: unclear — It is unclear whether the paper’s conclusions depend on it.
- Based: passes — The paper gives a reason why it holds.
A result the paper reports from its own data — it cites no other source for it, so there is none to check. The quote shows it is in the paper.
In the paper
“In this study, we show that HDAC1/2 and HDAC3 are active decrotonylase enzymes in vitro using recombinant purified co-repressor complexes (Fig. 1A and Supplementary Fig. 1B).”
§ Histone deacetylase (HDAC) 1 and 2 complexes regulate both histone acetylation and crotonylation in vivo > Discussion
boosteddirect- Asserted: passes — The authors put it forward as true.
- Checkable: passes — It can be checked against evidence.
- Load-bearing: passes — The paper’s conclusions depend on it.
- Based: passes — The paper gives a reason why it holds.
A result the paper reports from its own data — it cites no other source for it, so there is none to check. The quote shows it is in the paper.
In the paper
“A time course of LBH589 treatment revealed that both H3K18ac and H3K18cr levels double within 2 hours (Fig. 2D), indicating that the dynamics of acetylation/crotonylation are similar in cells.”
§ Histone deacetylase (HDAC) 1 and 2 complexes regulate both histone acetylation and crotonylation in vivo > Results > HDAC inhibition in cells increases both H3K18ac and H3K18cr in a dose-dependent manner
plaindirect- Asserted: passes — The authors put it forward as true.
- Checkable: passes — It can be checked against evidence.
- Load-bearing: passes — The paper’s conclusions depend on it.
- Based: passes — The paper gives a reason why it holds.
None of the sources cited for this claim have been checked yet.
In the paper
“Intriguingly, we also observed increased levels of both H3K18ac and H3K18cr at bivalent genes (Fig. 5B), that is, poised genes marked with both H3K4me3 and H3K27me3 in ES cells35,36, suggesting a role for HDAC1/2 in controlling the activity of developmentally regulated genes prior to ES cell differentiation.”
§ Histone deacetylase (HDAC) 1 and 2 complexes regulate both histone acetylation and crotonylation in vivo > Results > HDAC1/2 regulates H3K18cr levels at active gene loci
What the sources say
- Not checked yetcites [35] Bernstein, B. E. et al. A bivalent chromatin structure marks key developmental genes in embryonic stem cells. Cell 125, 315–326, https://doi.org/10.1016/j.cell.2006.02.041 (2006). source
- Not checked yetcites [36] Mikkelsen, T. S. et al. Genome-wide maps of chromatin state in pluripotent and lineage-committed cells. Nature 448, 553–560, https://doi.org/10.1038/nature06008 (2007). source
plaincorrelational- Asserted: passes — The authors put it forward as true.
- Checkable: passes — It can be checked against evidence.
- Load-bearing: passes — The paper’s conclusions depend on it.
- Based: passes — The paper gives a reason why it holds.
- It may state two separate claims as one. 21
- Probably not a substantial claim. 16
A result the paper reports from its own data — it cites no other source for it, so there is none to check. The quote shows it is in the paper.
In the paper
“At the end-point of the assay we were also able to measure the percentage conversion of each substrate, which was similarly reduced for H3K18cr compared to H3K18ac, suggesting that the crotonyl-lysine is turned over more slowly than the corresponding acetyl mark.”
§ Histone deacetylase (HDAC) 1 and 2 complexes regulate both histone acetylation and crotonylation in vivo > Results > HDAC1 functions as a histone decrotonylase whose activity is modulated by inositol phosphates
hedgeddirect- Asserted: passes — The authors put it forward as true.
- Checkable: passes — It can be checked against evidence.
- Load-bearing: passes — The paper’s conclusions depend on it.
- Based: passes — The paper gives a reason why it holds.
It may state two separate claims as one.
A result the paper reports from its own data — it cites no other source for it, so there is none to check. The quote shows it is in the paper.
In the paper
“The initial rate of deacetylation and decrotonylation was increased 3.2-fold and 1.8-fold respectively by the addition of InsP6 to the HDAC1/CoREST/LSD1 complex (Fig. 1A,B).”
§ Histone deacetylase (HDAC) 1 and 2 complexes regulate both histone acetylation and crotonylation in vivo > Results > HDAC1 functions as a histone decrotonylase whose activity is modulated by inositol phosphates
plaindirect- Asserted: passes — The authors put it forward as true.
- Checkable: passes — It can be checked against evidence.
- Load-bearing: passes — The paper’s conclusions depend on it.
- Based: passes — The paper gives a reason why it holds.
It may state two separate claims as one.
A result the paper reports from its own data — it cites no other source for it, so there is none to check. The quote shows it is in the paper.
In the paper
“Upon using extended incubation times (>6 hours) extracts from both ES cells and HEK-293T cells displayed robust decrotonylase activity which correlated with protein concentration (Fig. 2A,B).”
§ Histone deacetylase (HDAC) 1 and 2 complexes regulate both histone acetylation and crotonylation in vivo > Results > HDAC inhibition in cells increases both H3K18ac and H3K18cr in a dose-dependent manner
plaincorrelational- Asserted: passes — The authors put it forward as true.
- Checkable: passes — It can be checked against evidence.
- Load-bearing: passes — The paper’s conclusions depend on it.
- Based: passes — The paper gives a reason why it holds.
It may state two separate claims as one.
In the paper
“Consistent with previously published data18 HDAC3 also displayed significant activity against the H3K18cr peptide (Supplementary Fig. 1B), although similar to HDAC1, with an initial rate which was 2.4-fold lower than the H3K18ac substrate.”
§ Histone deacetylase (HDAC) 1 and 2 complexes regulate both histone acetylation and crotonylation in vivo > Results > HDAC1 functions as a histone decrotonylase whose activity is modulated by inositol phosphates
What the sources say
- Not checked yetcites [18] Madsen, A. S. & Olsen, C. A. Profiling of substrates for zinc-dependent lysine deacylase enzymes: HDAC3 exhibits decrotonylase activity in vitro. Angew Chem Int Ed Engl 51, 9083–9087, https://doi.org/10.1002/anie.201203754 (2012). source
plaindirect- Asserted: passes — The authors put it forward as true.
- Checkable: passes — It can be checked against evidence.
- Load-bearing: passes — The paper’s conclusions depend on it.
- Based: passes — The paper gives a reason why it holds.
It may state two separate claims as one.
A result the paper reports from its own data — it cites no other source for it, so there is none to check. The quote shows it is in the paper.
In the paper
“In contrast, we observed a small but significant increase in H3K18cr in the vicinity of TSS upon deletion of HDAC1/2 of in ES cells (Fig. 4A), which is more pronounced at specific promoters (Lactb and Anapc5, Fig. 4D).”
§ Histone deacetylase (HDAC) 1 and 2 complexes regulate both histone acetylation and crotonylation in vivo > Discussion
plaindirect- Asserted: passes — The authors put it forward as true.
- Checkable: passes — It can be checked against evidence.
- Load-bearing: passes — The paper’s conclusions depend on it.
- Based: passes — The paper gives a reason why it holds.
It may state two separate claims as one.
- Rests on an assumption: The H3K18cr antibody used for native ChIP specifically detects H3K18cr.
A result the paper reports from its own data — it cites no other source for it, so there is none to check. The quote shows it is in the paper.
In the paper
“Furthermore, we mapped H3K18cr in cells using ChIP-seq, with and without HDAC1/2, and observed increased levels of crotonylation, which largely overlaps with H3K18ac in the vicinity of transcriptional start sites.”
§ Histone deacetylase (HDAC) 1 and 2 complexes regulate both histone acetylation and crotonylation in vivo > Abstract
plaindirect- Asserted: passes — The authors put it forward as true.
- Checkable: passes — It can be checked against evidence.
- Load-bearing: passes — The paper’s conclusions depend on it.
- Based: passes — The paper gives a reason why it holds.
It may state two separate claims as one.
- Rests on an assumption: The changes in histone crotonylation levels upon HDAC1/2 deletion are due to loss of HDAC1/2 decrotonylase activity rather than indirect effects on other enzymes.
None of the sources cited for this claim have been checked yet.
In the paper
“This is perhaps unsurprising since HDAC1/2 themselves (Fig. 4C) and their related complex components, Sin3A37 and LSD138, all map within the vicinity of TSS.”
§ Histone deacetylase (HDAC) 1 and 2 complexes regulate both histone acetylation and crotonylation in vivo > Discussion
What the sources say
- Not checked yetcites [37] Williams, K. et al. TET1 and hydroxymethylcytosine in transcription and DNA methylation fidelity. Nature 473, 343–348, https://doi.org/10.1038/nature10066 (2011). source
- Not checked yetcites [38] Whyte, W. A. et al. Enhancer decommissioning by LSD1 during embryonic stem cell differentiation. Nature 482, 221–225, https://doi.org/10.1038/nature10805 (2012). source
plaincorrelational- Asserted: passes — The authors put it forward as true.
- Checkable: passes — It can be checked against evidence.
- Load-bearing: fails — The paper’s conclusions may not depend on it.
- Based: passes — The paper gives a reason why it holds.
Probably not a substantial claim. The paper’s conclusions may not depend on it.
A result the paper reports from its own data — it cites no other source for it, so there is none to check. The quote shows it is in the paper.
In the paper
“Furthermore, by plotting the false discovery rate (FDR) of enriched GO terms for both H3K18ac and H3K18cr we observed an R2 = 0.929 correlation (p < 0.0001), indicating a significant overlap in the function of these two acylations in ES cells (Fig. 5D).”
§ Histone deacetylase (HDAC) 1 and 2 complexes regulate both histone acetylation and crotonylation in vivo > Results > HDAC1/2 regulates H3K18cr levels at active gene loci
hedgedcorrelational- Asserted: passes — The authors put it forward as true.
- Checkable: passes — It can be checked against evidence.
- Load-bearing: passes — The paper’s conclusions depend on it.
- Based: passes — The paper gives a reason why it holds.
It may state two separate claims as one.
A result the paper reports from its own data — it cites no other source for it, so there is none to check. The quote shows it is in the paper.
In the paper
“We have shown that deletion of HDAC1/2 in ES cells caused an 85% reduction in total decrotonylase activity; this is the first genetic link between HDACs and decrotonylase activity in cells.”
- Also stated in: § Discussion · boosted
“Furthermore, genetic deletion of HDAC1/2 from ES cells reveals them to be critical enzymes in the regulation of H3K18cr levels, in terms of total decrotonylase activity (Fig. 3) and the regulation of histone crotonylation at specific genomic loci (Fig. 4).”
§ Histone deacetylase (HDAC) 1 and 2 complexes regulate both histone acetylation and crotonylation in vivo > Discussion
boosteddirect- Asserted: passes — The authors put it forward as true.
- Checkable: passes — It can be checked against evidence.
- Load-bearing: passes — The paper’s conclusions depend on it.
- Based: passes — The paper gives a reason why it holds.
It may state two separate claims as one.
- Also stated in: § Discussion · boosted
A result the paper reports from its own data — it cites no other source for it, so there is none to check. The quote shows it is in the paper.
In the paper
“Loss of HDAC1/2 increases the average levels of both H3K18ac and H3K18cr around the TSS (Ctrl vs DKO), with a more pronounced increase observed for H3K18ac.”
§ Histone deacetylase (HDAC) 1 and 2 complexes regulate both histone acetylation and crotonylation in vivo > Results > HDAC1/2 regulates H3K18cr levels at active gene loci
plaindirect- Asserted: passes — The authors put it forward as true.
- Checkable: passes — It can be checked against evidence.
- Load-bearing: passes — The paper’s conclusions depend on it.
- Based: passes — The paper gives a reason why it holds.
It may state two separate claims as one.
In the paper
“In contrast to previously published data22, we observed increased levels of histone crotonylation upon loss of HDAC1/2 activity which largely overlaps with H3K18ac at TSS and correlates with gene activity.”
§ Histone deacetylase (HDAC) 1 and 2 complexes regulate both histone acetylation and crotonylation in vivo > Introduction
What the sources say
- Not checked yetcites [22] Fellows, R. et al. Microbiota derived short chain fatty acids promote histone crotonylation in the colon through histone deacetylases. Nat Commun 9, 105, https://doi.org/10.1038/s41467-017-02651-5 (2018). source
plaindirect- Asserted: passes — The authors put it forward as true.
- Checkable: passes — It can be checked against evidence.
- Load-bearing: passes — The paper’s conclusions depend on it.
- Based: passes — The paper gives a reason why it holds.
It may state two separate claims as one.
- Rests on an assumption: The changes in histone crotonylation levels upon HDAC1/2 deletion are due to loss of HDAC1/2 decrotonylase activity rather than indirect effects on other enzymes.
In the paper
“In line with previous findings9, we observed that H3K18cr levels peak in the vicinity of transcription start sites (TSS) with a significant overlap with H3K18ac (Fig. 4A).”
§ Histone deacetylase (HDAC) 1 and 2 complexes regulate both histone acetylation and crotonylation in vivo > Results > HDAC1/2 regulates H3K18cr levels at active gene loci
What the sources say
- Not checked yetcites [9] Sabari, B. R. et al. Intracellular crotonyl-CoA stimulates transcription through p300-catalyzed histone crotonylation. Molecular cell 58, 203–215, https://doi.org/10.1016/j.molcel.2015.02.029 (2015). source
plaincorrelational- Asserted: passes — The authors put it forward as true.
- Checkable: passes — It can be checked against evidence.
- Load-bearing: unclear — It is unclear whether the paper’s conclusions depend on it.
- Based: passes — The paper gives a reason why it holds.
It may state two separate claims as one.
A result the paper reports from its own data — it cites no other source for it, so there is none to check. The quote shows it is in the paper.
In the paper
“A comparison of H3K18ac and H3K18cr in ES cells revealed a significant overlap in loci, with the increase in abundance upon HDAC1/2 deletion occurring at pre-existing sites.”
§ Histone deacetylase (HDAC) 1 and 2 complexes regulate both histone acetylation and crotonylation in vivo > Discussion
plaindirect- Asserted: passes — The authors put it forward as true.
- Checkable: passes — It can be checked against evidence.
- Load-bearing: passes — The paper’s conclusions depend on it.
- Based: passes — The paper gives a reason why it holds.
It may state two separate claims as one.
- Rests on an assumption: The H3K18cr antibody used for native ChIP specifically detects H3K18cr.
A result the paper reports from its own data — it cites no other source for it, so there is none to check. The quote shows it is in the paper.
In the paper
“HDAC1-KO; HDAC2-Het cells showed increased levels of H3K18ac (1.5-fold) and histone H3 crotonylation (1.5-fold; Pan-Cr; Supplementary Fig. S2B), although these increases are smaller than those observed in DKO cells (Fig. 3B).”
§ Histone deacetylase (HDAC) 1 and 2 complexes regulate both histone acetylation and crotonylation in vivo > Results > HDAC1/2 are the dominant histone decrotonylases in ES cells
plaindirect- Asserted: passes — The authors put it forward as true.
- Checkable: passes — It can be checked against evidence.
- Load-bearing: passes — The paper’s conclusions depend on it.
- Based: passes — The paper gives a reason why it holds.
It may state two separate claims as one.
A result the paper reports from its own data — it cites no other source for it, so there is none to check. The quote shows it is in the paper.
In the paper
“Surprisingly, given the difference in initial rates measured using the caliper assay in vitro (Fig. 1), we detect little or no difference in the recovery time, suggesting that the rate of decrotonylation is similar to deacetylation in cells (Supplementary Fig. S2C).”
§ Histone deacetylase (HDAC) 1 and 2 complexes regulate both histone acetylation and crotonylation in vivo > Results > HDAC inhibition in cells increases both H3K18ac and H3K18cr in a dose-dependent manner
hedged- Asserted: passes — The authors put it forward as true.
- Checkable: passes — It can be checked against evidence.
- Load-bearing: passes — The paper’s conclusions depend on it.
- Based: passes — The paper gives a reason why it holds.
It may state two separate claims as one.
In the paper
“siRNA knockdown of HDAC1/221 or treatment with HDAC inhibitors22 caused increased levels of histone crotonylation; although counterintuitively, the average level of H3K18cr at transcriptional start sites (TSS) was reduced following HDAC inhibitor treatment22.”
§ Histone deacetylase (HDAC) 1 and 2 complexes regulate both histone acetylation and crotonylation in vivo > Introduction
What the sources say
- Not checked yetcites [22] Fellows, R. et al. Microbiota derived short chain fatty acids promote histone crotonylation in the colon through histone deacetylases. Nat Commun 9, 105, https://doi.org/10.1038/s41467-017-02651-5 (2018). source
plaindirect- Asserted: passes — The authors put it forward as true.
- Checkable: passes — It can be checked against evidence.
- Load-bearing: fails — The paper’s conclusions may not depend on it.
- Based: passes — The paper gives a reason why it holds.
Probably not a substantial claim. The paper’s conclusions may not depend on it.
None of the sources cited for this claim have been checked yet.
In the paper
“siRNA knockdown of HDAC1/221 or treatment with HDAC inhibitors22 caused increased levels of histone crotonylation; although counterintuitively, the average level of H3K18cr at transcriptional start sites (TSS) was reduced following HDAC inhibitor treatment22.”
§ Histone deacetylase (HDAC) 1 and 2 complexes regulate both histone acetylation and crotonylation in vivo > Introduction
What the sources say
- Not checked yetcites [21] Wei, W. et al. Class I histone deacetylases are major histone decrotonylases: evidence for critical and broad function of histone crotonylation in transcription. Cell Res 27, 898–915, https://doi.org/10.1038/cr.2017.68 (2017). source
- Not checked yetcites [22] Fellows, R. et al. Microbiota derived short chain fatty acids promote histone crotonylation in the colon through histone deacetylases. Nat Commun 9, 105, https://doi.org/10.1038/s41467-017-02651-5 (2018). source
plaindirect- Asserted: passes — The authors put it forward as true.
- Checkable: passes — It can be checked against evidence.
- Load-bearing: passes — The paper’s conclusions depend on it.
- Based: passes — The paper gives a reason why it holds.
It may state two separate claims as one.
None of the sources cited for this claim have been checked yet.
In the paper
“However, Lys-ac and Lys-cr may be interpreted differently, since they are recognized by distinct readers, in the bromodomain10 and Yeats domain11 respectively.”
§ Histone deacetylase (HDAC) 1 and 2 complexes regulate both histone acetylation and crotonylation in vivo > Introduction
What the sources say
- Not checked yetcites [10] Dhalluin, C. et al. Structure and ligand of a histone acetyltransferase bromodomain. Nature 399, 491–496, https://doi.org/10.1038/20974 (1999). source
- Not checked yetcites [11] Li, Y. et al. Molecular Coupling of Histone Crotonylation and Active Transcription by AF9 YEATS Domain. Molecular cell 62, 181–193, https://doi.org/10.1016/j.molcel.2016.03.028 (2016). source
hedgedcorrelational- Asserted: passes — The authors put it forward as true.
- Checkable: passes — It can be checked against evidence.
- Load-bearing: fails — The paper’s conclusions may not depend on it.
- Based: passes — The paper gives a reason why it holds.
Probably not a substantial claim. The paper’s conclusions may not depend on it.
In the paper
“A study profiling substrate preferences of HDAC1–11 identified HDAC3 as a potential decrotonylase18.”
§ Histone deacetylase (HDAC) 1 and 2 complexes regulate both histone acetylation and crotonylation in vivo > Introduction
What the sources say
- Not checked yetcites [18] Madsen, A. S. & Olsen, C. A. Profiling of substrates for zinc-dependent lysine deacylase enzymes: HDAC3 exhibits decrotonylase activity in vitro. Angew Chem Int Ed Engl 51, 9083–9087, https://doi.org/10.1002/anie.201203754 (2012). source
hedgedconditional- Asserted: passes — The authors put it forward as true.
- Checkable: passes — It can be checked against evidence.
- Load-bearing: fails — The paper’s conclusions may not depend on it.
- Based: passes — The paper gives a reason why it holds.
Probably not a substantial claim. The paper’s conclusions may not depend on it.
None of the sources cited for this claim have been checked yet.
In the paper
“Unsurprisingly, given the range of their potential substrates, sirtuins 1, 216 and 317 were shown to be decrotonylases in vitro.”
§ Histone deacetylase (HDAC) 1 and 2 complexes regulate both histone acetylation and crotonylation in vivo > Introduction
What the sources say
- Not checked yetcites [16] Feldman, J. L., Baeza, J. & Denu, J. M. Activation of the protein deacetylase SIRT6 by long-chain fatty acids and widespread deacylation by mammalian sirtuins. The Journal of biological chemistry 288, 31350–31356, https://doi.org/10.1074/jbc.C113.511261 (2013). source
- Not checked yetcites [17] Bao, X. et al. Identification of ‘erasers’ for lysine crotonylated histone marks using a chemical proteomics approach. Elife 3, https://doi.org/10.7554/eLife.02999 (2014). source
plaindirect- Asserted: passes — The authors put it forward as true.
- Checkable: passes — It can be checked against evidence.
- Load-bearing: fails — The paper’s conclusions may not depend on it.
- Based: passes — The paper gives a reason why it holds.
Probably not a substantial claim. The paper’s conclusions may not depend on it.
None of the sources cited for this claim have been checked yet.
In the paper
“HDAC1 and HDAC2 (HDAC1/2) are highly related deacetylases that form the catalytic core of multiple co-repressor complexes, including, Sin3, NuRD, CoREST and MiDAC19,20.”
§ Histone deacetylase (HDAC) 1 and 2 complexes regulate both histone acetylation and crotonylation in vivo > Introduction
What the sources say
- Not checked yetcites [19] Kelly, R. D. & Cowley, S. M. The physiological roles of histone deacetylase (HDAC) 1 and 2: complex co-stars with multiple leading parts. Biochemical Society transactions 41, 741–749, https://doi.org/10.1042/BST20130010 (2013). source
- Not checked yetcites [20] Millard, C. J., Watson, P. J., Fairall, L. & Schwabe, J. W. Targeting Class I Histone Deacetylases in a “Complex” Environment. Trends Pharmacol Sci 38, 363–377, https://doi.org/10.1016/j.tips.2016.12.006 (2017). source
plaindirect- Asserted: passes — The authors put it forward as true.
- Checkable: passes — It can be checked against evidence.
- Load-bearing: passes — The paper’s conclusions depend on it.
- Based: passes — The paper gives a reason why it holds.
Probably not a substantial claim.
None of the sources cited for this claim have been checked yet.
In the paper
“A number of functional studies have concentrated on histone lysine-crotonylation (Lys-cr) which is associated with active chromatin and overlaps with known sites of lysine-acetylation (Lys-ac)3,9.”
§ Histone deacetylase (HDAC) 1 and 2 complexes regulate both histone acetylation and crotonylation in vivo > Introduction
What the sources say
- Not checked yetcites [3] Tan, M. et al. Identification of 67 histone marks and histone lysine crotonylation as a new type of histone modification. Cell 146, 1016–1028, https://doi.org/10.1016/j.cell.2011.08.008 (2011). source
- Not checked yetcites [9] Sabari, B. R. et al. Intracellular crotonyl-CoA stimulates transcription through p300-catalyzed histone crotonylation. Molecular cell 58, 203–215, https://doi.org/10.1016/j.molcel.2015.02.029 (2015). source
plaincorrelational- Asserted: passes — The authors put it forward as true.
- Checkable: passes — It can be checked against evidence.
- Load-bearing: fails — The paper’s conclusions may not depend on it.
- Based: passes — The paper gives a reason why it holds.
Probably not a substantial claim. The paper’s conclusions may not depend on it. It may state two separate claims as one.
In the paper
“Although treatment of HCT-116 cells with MS-275 increased the global levels of H3K18cr, ChIP-seq showed a reduction in H3K18cr levels around transcriptional start sites22.”
§ Histone deacetylase (HDAC) 1 and 2 complexes regulate both histone acetylation and crotonylation in vivo > Discussion
What the sources say
- Not checked yetcites [22] Fellows, R. et al. Microbiota derived short chain fatty acids promote histone crotonylation in the colon through histone deacetylases. Nat Commun 9, 105, https://doi.org/10.1038/s41467-017-02651-5 (2018). source
plaindirect- Asserted: passes — The authors put it forward as true.
- Checkable: passes — It can be checked against evidence.
- Load-bearing: fails — The paper’s conclusions may not depend on it.
- Based: passes — The paper gives a reason why it holds.
Probably not a substantial claim. The paper’s conclusions may not depend on it. It may state two separate claims as one.
In the paper
“More recently, Fellows et. al. (2018) provided evidence that class-I HDACs regulate levels of histone decrotonylation in the intestine in response to short chain fatty acids generated by the microbiota of the gut22.”
§ Histone deacetylase (HDAC) 1 and 2 complexes regulate both histone acetylation and crotonylation in vivo > Discussion
What the sources say
- Not checked yetcites [22] Fellows, R. et al. Microbiota derived short chain fatty acids promote histone crotonylation in the colon through histone deacetylases. Nat Commun 9, 105, https://doi.org/10.1038/s41467-017-02651-5 (2018). source
plaindirect- Asserted: passes — The authors put it forward as true.
- Checkable: passes — It can be checked against evidence.
- Load-bearing: fails — The paper’s conclusions may not depend on it.
- Based: passes — The paper gives a reason why it holds.
Probably not a substantial claim. The paper’s conclusions may not depend on it.
A conclusion the paper draws from its own results — it cites no other source for it, so there is none to check. The quote shows it is in the paper.
In the paper
“These increases in histone crotonylation appear to be correlated with corresponding changes in H3K18ac, suggesting that HDAC1/2 co-ordinately regulate both histone modifications at specific sites.”
§ Histone deacetylase (HDAC) 1 and 2 complexes regulate both histone acetylation and crotonylation in vivo > Results > HDAC1/2 regulates H3K18cr levels at active gene loci
hedgedcorrelational- Asserted: passes — The authors put it forward as true.
- Checkable: passes — It can be checked against evidence.
- Load-bearing: passes — The paper’s conclusions depend on it.
- Based: passes — The paper gives a reason why it holds.
It may state two separate claims as one.
In the paper
“Wei et al.21 demonstrated that overexpression of class I HDACs (HDAC1, 2, 3 and 8) in HeLa cells were able to decrease global histone crotonylation levels, while knock-down or HDAC inhibitor treatment produced the opposite effect21.”
§ Histone deacetylase (HDAC) 1 and 2 complexes regulate both histone acetylation and crotonylation in vivo > Discussion
What the sources say
- Not checked yetcites [21] Wei, W. et al. Class I histone deacetylases are major histone decrotonylases: evidence for critical and broad function of histone crotonylation in transcription. Cell Res 27, 898–915, https://doi.org/10.1038/cr.2017.68 (2017). source
boosteddirect- Asserted: passes — The authors put it forward as true.
- Checkable: passes — It can be checked against evidence.
- Load-bearing: fails — The paper’s conclusions may not depend on it.
- Based: passes — The paper gives a reason why it holds.
Probably not a substantial claim. The paper’s conclusions may not depend on it. It may state two separate claims as one.
None of the sources cited for this claim have been checked yet.
In the paper
“This is not surprising, since HDAC1/2 map predominantly to TSS (Fig. 4C) with a positive correlation between binding and gene activity33,34.”
§ Histone deacetylase (HDAC) 1 and 2 complexes regulate both histone acetylation and crotonylation in vivo > Results > HDAC1/2 regulates H3K18cr levels at active gene loci
What the sources say
- Not checked yetcites [33] Wang, Z. et al. Genome-wide mapping of HATs and HDACs reveals distinct functions in active and inactive genes. Cell 138, 1019–1031, https://doi.org/10.1016/j.cell.2009.06.049 (2009). source
- Not checked yetcites [34] Kurdistani, S. K., Robyr, D., Tavazoie, S. & Grunstein, M. Genome-wide binding map of the histone deacetylase Rpd3 in yeast. Nature genetics 31, 248–254, https://doi.org/10.1038/ng907 (2002). source
plaincorrelational- Asserted: passes — The authors put it forward as true.
- Checkable: passes — It can be checked against evidence.
- Load-bearing: fails — The paper’s conclusions may not depend on it.
- Based: passes — The paper gives a reason why it holds.
Probably not a substantial claim. The paper’s conclusions may not depend on it. It may state two separate claims as one.
In the paper
“This is consistent with data from Madsen and Olson18, who showed that the HDAC3/NCoR complex also hydrolysed Lys-cr at a lower rate than Lys-ac, although still comparable to the deacetylase activities of HDAC8 and HDAC11.”
§ Histone deacetylase (HDAC) 1 and 2 complexes regulate both histone acetylation and crotonylation in vivo > Discussion
What the sources say
- Not checked yetcites [18] Madsen, A. S. & Olsen, C. A. Profiling of substrates for zinc-dependent lysine deacylase enzymes: HDAC3 exhibits decrotonylase activity in vitro. Angew Chem Int Ed Engl 51, 9083–9087, https://doi.org/10.1002/anie.201203754 (2012). source
plaindirect- Asserted: passes — The authors put it forward as true.
- Checkable: passes — It can be checked against evidence.
- Load-bearing: fails — The paper’s conclusions may not depend on it.
- Based: passes — The paper gives a reason why it holds.
Probably not a substantial claim. The paper’s conclusions may not depend on it. It may state two separate claims as one.
In the paper
“Indeed, data from Fellows et al., showed that purified HDAC1, 2 and 3 are able to reduce the levels of H3K18 butyrlation in vitro22.”
§ Histone deacetylase (HDAC) 1 and 2 complexes regulate both histone acetylation and crotonylation in vivo > Discussion
What the sources say
- Not checked yetcites [22] Fellows, R. et al. Microbiota derived short chain fatty acids promote histone crotonylation in the colon through histone deacetylases. Nat Commun 9, 105, https://doi.org/10.1038/s41467-017-02651-5 (2018). source
plaindirect- Asserted: passes — The authors put it forward as true.
- Checkable: passes — It can be checked against evidence.
- Load-bearing: fails — The paper’s conclusions may not depend on it.
- Based: passes — The paper gives a reason why it holds.
Probably not a substantial claim. The paper’s conclusions may not depend on it.
None of the sources cited for this claim have been checked yet.
In the paper
“To date, decrotonylase activity has been described for HDAC1-3 and Sirtuins 1-316–18,21,22.”
§ Histone deacetylase (HDAC) 1 and 2 complexes regulate both histone acetylation and crotonylation in vivo > Discussion
What the sources say
- Not checked yetcites [16] Feldman, J. L., Baeza, J. & Denu, J. M. Activation of the protein deacetylase SIRT6 by long-chain fatty acids and widespread deacylation by mammalian sirtuins. The Journal of biological chemistry 288, 31350–31356, https://doi.org/10.1074/jbc.C113.511261 (2013). source
- Not checked yetcites [17] Bao, X. et al. Identification of ‘erasers’ for lysine crotonylated histone marks using a chemical proteomics approach. Elife 3, https://doi.org/10.7554/eLife.02999 (2014). source
- Not checked yetcites [18] Madsen, A. S. & Olsen, C. A. Profiling of substrates for zinc-dependent lysine deacylase enzymes: HDAC3 exhibits decrotonylase activity in vitro. Angew Chem Int Ed Engl 51, 9083–9087, https://doi.org/10.1002/anie.201203754 (2012). source
- Not checked yetcites [21] Wei, W. et al. Class I histone deacetylases are major histone decrotonylases: evidence for critical and broad function of histone crotonylation in transcription. Cell Res 27, 898–915, https://doi.org/10.1038/cr.2017.68 (2017). source
- Not checked yetcites [22] Fellows, R. et al. Microbiota derived short chain fatty acids promote histone crotonylation in the colon through histone deacetylases. Nat Commun 9, 105, https://doi.org/10.1038/s41467-017-02651-5 (2018). source
plaindirect- Asserted: passes — The authors put it forward as true.
- Checkable: passes — It can be checked against evidence.
- Load-bearing: fails — The paper’s conclusions may not depend on it.
- Based: passes — The paper gives a reason why it holds.
Probably not a substantial claim. The paper’s conclusions may not depend on it.
What the paper did — it cites no source for this, so there is none to check. The quote shows it is in the paper.
In the paper
“All reactions were carried out in duplicate in 30 µl reaction volumes, performed at room temperature in 50 mM Tris pH 7.5, 50 mM NaCl, 5% glycerol.”
§ Histone deacetylase (HDAC) 1 and 2 complexes regulate both histone acetylation and crotonylation in vivo > Methods > In vitro Histone Deacetylation (HDAC) and decrotonylation (HDCR) Assays
plain- Asserted: passes — The authors put it forward as true.
- Checkable: passes — It can be checked against evidence.
- Load-bearing: fails — The paper’s conclusions may not depend on it.
- Based: passes — The paper gives a reason why it holds.
Probably not a substantial claim. The paper’s conclusions may not depend on it.
None of the sources cited for this claim have been checked yet.
In the paper
“Mass-spectrometry data has shown that there are an abundance of histone crotonylation sites in all four core histones22,40.”
§ Histone deacetylase (HDAC) 1 and 2 complexes regulate both histone acetylation and crotonylation in vivo > Discussion
What the sources say
- Not checked yetcites [22] Fellows, R. et al. Microbiota derived short chain fatty acids promote histone crotonylation in the colon through histone deacetylases. Nat Commun 9, 105, https://doi.org/10.1038/s41467-017-02651-5 (2018). source
- Not checked yetcites [40] Tan, M. et al. Lysine glutarylation is a protein posttranslational modification regulated by SIRT5. Cell Metab 19, 605–617, https://doi.org/10.1016/j.cmet.2014.03.014 (2014). source
plain- Asserted: passes — The authors put it forward as true.
- Checkable: passes — It can be checked against evidence.
- Load-bearing: fails — The paper’s conclusions may not depend on it.
- Based: passes — The paper gives a reason why it holds.
Probably not a substantial claim. The paper’s conclusions may not depend on it.
The paper relies on this without support.
The HDAC1/CoREST1/LSD1 ternary complex is representative of HDAC1/2-containing co-repressor complexes for decrotonylase activity.
“For this study we utilized the CoREST complex because we are able to generate a recombinant HDAC1/CoREST1/LSD1 ternary complex23, using full-length proteins, in a 1:1:1 ratio at milligram quantities.”
The paper relies on this without support.
ES cells are a valid model for in vivo regulation of histone crotonylation.
“Collectively, our data indicate that HDAC1/2 containing complexes are critical regulators of histone crotonylation in vivo.”
The paper relies on this without support.
The changes in histone crotonylation levels upon HDAC1/2 deletion are due to loss of HDAC1/2 decrotonylase activity rather than indirect effects on other enzymes.
“Since these observations imply HDAC1/2 are active decrontonylases, we assayed the remaining deacetylase and decrotonylase activity following HDAC1/2 deletion.”
The paper relies on this without support.
The H3K18cr antibody used for native ChIP specifically detects H3K18cr.
“Chromatin was immunoprecipitated using 8 μg H3K18ac (Catalog No: 39755; Active Motif) or 8 μg H3K18cr (PTM-Biolabs 517) conjugated to 50 μL Dynabeads Protein G overnight at 4 °C.”
Claims other papers make about this one
Each is checked against this paper’s own text: does it say what the citing paper says it does?
The cited source says what the claim attributes to it.
In the citing paper
“Histone modifications are dynamically regulated by coordinated enzyme systems commonly referred to as “writers,” “erasers,” and “readers,” which respectively deposit, remove, or recognize specific epigenetic marks (Kelly et al., 2018; Brancolini et al., 2022).”
From Histone modifications and depression: epigenetic mechanisms, therapeutic targets, and translational outlook (2026) · cites this paper as Kelly et al., 2018
Citations
Cites
Systematic and integrative analysis of large gene lists using DAVID bioinformatics resources
Huang, D. W., Sherman, B. T., & Lempicki, R. A. (2009) · Nature Protocols · doi:10.1038/nprot.2008.211 · Cited by 35,890
deepTools2: a next generation web server for deep-sequencing data analysis
Ramírez, F., Ryan, D. P., Grüning, B., Bhardwaj, V., Kilpert, F., Richter, A. S., Heyne, S., Dündar, F., & Manke, T. (2016) · Nucleic Acids Research · doi:10.1093/nar/gkw257 · Cited by 8,096
A bivalent chromatin structure marks key developmental genes in embryonic stem cells
Bernstein, B. E., Mikkelsen, T. S., Xie, X., Kamal, M., Huebert, D. J., Cuff, J., Fry, B., Meissner, A., Wernig, M., Plath, K., et al. (2006) · Cell · doi:10.1016/j.cell.2006.02.041 · Cited by 5,361
Genome-wide maps of chromatin state in pluripotent and lineage-committed cells
Mikkelsen, T. S., Ku, M., Jaffe, D. B., Issac, B., Lieberman, E., Giannoukos, G., Alvarez, P., Brockman, W., Kim, T.-K., Koche, R. P., et al. (2007) · Nature · doi:10.1038/nature06008 · Cited by 4,129
Haberland, M., Montgomery, R. L., & Olson, E. N. (2008) · Nature Reviews Genetics · doi:10.1038/nrg2485 · Cited by 2,600
Sirtuins as regulators of metabolism and healthspan
Houtkooper, R. H., Pirinen, E., & Auwerx, J. (2012) · Nature Reviews Molecular Cell Biology · doi:10.1038/nrm3293 · Cited by 2,008
Tan, M., Luo, H., Lee, S., Jin, F., Yang, J. S., Montellier, E., Buchou, T., Cheng, Z., Rousseaux, S., Rajagopal, N., et al. (2011) · Cell · doi:10.1016/j.cell.2011.08.008 · Cited by 1,902
Structure and ligand of a histone acetyltransferase bromodomain
Dhalluin, C., Carlson, J. E., Zeng, L., He, C., Aggarwal, A. K., Zhou, M.-M., & Zhou, M.-M. (1999) · Nature · doi:10.1038/20974 · Cited by 1,732
Sirt5 Is a NAD-Dependent Protein Lysine Demalonylase and Desuccinylase
Du, J., Zhou, Y., Su, X., Yu, J. J., Khan, S., Jiang, H., Kim, J., Woo, J., Kim, J. H., Choi, B. H., et al. (2011) · Science · doi:10.1126/science.1207861 · Cited by 1,429
Genome-wide mapping of HATs and HDACs reveals distinct functions in active and inactive genes
Wang, Z., Zang, C., Cui, K., Schones, D. E., Barski, A., Peng, W., & Zhao, K. (2009) · Cell · doi:10.1016/j.cell.2009.06.049 · Cited by 1,344
Cited by
Sorted by citations
Items 101–138 of 138
Kabir, T., Connamacher, C. A., Nadeem, Z., Paul, M. R., Smutny, M. R., Lawler, Z. K., Djomo, A. M., Carroll, T., & Gates, L. A. (2025) · bioRxiv (Cold Spring Harbor Laboratory) · doi:10.1101/2025.05.07.652677 · Cited by 8
Distribution and diversity of classical deacylases in bacteria
Graf, L. G., Moreno–Yruela, C., Qin, C., Schulze, S., Palm, G. J., Schmöker, O., Wang, N., Hocking, D. M., Jebeli, L., Girbardt, B., et al. (2024) · Nature Communications · doi:10.1038/s41467-024-53903-0 · Cited by 7
Histone acylations as a mechanism for regulation of intestinal epithelial cells
Fernandes, M. F., & Vinolo, M. A. R. (2024) · Digestive Medicine Research · doi:10.21037/dmr-23-3 · Cited by 10
Liu, J., Zhong, L., & Guo, R. (2021) · Oxidative Medicine and Cellular Longevity · doi:10.1155/2021/6635836 · Cited by 7
RetractedSystematic analysis of lysine crotonylation in human macrophages responding to MRSA infection
Zhang, H., Ma, W., Liu, H., Tang, W., Shu, J., Zhou, J., Zheng, H., Xiao, H., Yang, X., Liu, D., et al. (2023) · Frontiers in Cellular and Infection Microbiology · doi:10.3389/fcimb.2023.1126350 · Cited by 7
Ren, F., Yang, M., Liu, G., Qi, Y., Li, A., Li, J., & Zheng, L. (2024) · Clinical and Experimental Hypertension · doi:10.1080/10641963.2024.2358030 · Cited by 7
Cheng, S., Cheng, C., Zhou, J., Ji, Y. S., Liu, Y., Jiang, W., Liu, C., & Wang, H. (2025) · Nutrition Reviews · doi:10.1093/nutrit/nuaf258 · Cited by 7
Tay, J. Y., Ho, J., Cheo, F. F., & Iqbal, J. (2024) · Cancers · doi:10.3390/cancers16233910 · Cited by 5
The role of CddA and cGNAT2 in crotonylation of proteins in cyanobacteria
Lin, J., Li, Q., Liu, X., Zhan, J., Yuan, L., Yang, M., & Ge, F. (2025) · New Phytologist · doi:10.1111/nph.70310 · Cited by 5
Proteomics contributions to epigenetic drug discovery
Noberini, R., & Bonaldi, T. (2023) · PROTEOMICS · doi:10.1002/pmic.202200435 · Cited by 5
Lv, L.-Z., Wang, Z.-D., Ren, J.-J., Li, L.-H., Liu, X.-B., Li, J.-L., Zhu, H., Jiang, B., Han, Y.-P., Zhou, X.-M., et al. (2026) · Frontiers in Genetics · doi:10.3389/fgene.2025.1722453 · Cited by 7
Unlocking cardiac health: exploring the role of class I HDACs in cardiovascular diseases
Pai, P., D’Mello, R. S., Brahme, O. M., Gogineni, Y. V., Shetty, M. G., & Babitha, K. S. (2025) · Molecular and Cellular Biochemistry · doi:10.1007/s11010-025-05353-5 · Cited by 4
Epigenetics concepts: An overview
Ngo, V., & Hein, L. (2021) · Elsevier eBooks · doi:10.1016/b978-0-12-822258-4.00006-7 · Cited by 4
Yin, B., Fan, Z., Yu, P., Li, J., Wang, Y., & Shu, M. (2025) · Frontiers in Oncology · doi:10.3389/fonc.2025.1573997 · Cited by 3
Histone decrotonylation plays a distinct role in HIV latency
Li, X., Li, D., Tang, Y., Nearing, M., Varco-Merth, B. D., Chen, H., Smith, D., Gianella, S., Archin, N. M., Okoye, A. A., et al. (2026) · Science Advances · doi:10.1126/sciadv.aec0149 · Cited by 3
Zhang, Y., Ji, P., Zhang, M., Tran, N. T., & Li, S. (2023) · Developmental & Comparative Immunology · doi:10.1016/j.dci.2023.104898 · Cited by 4
Resolving the Deceptive Isoform and Complex Selectivity of HDAC1/2 InhibitorsPreprint
Mazitschek, R., & Payne, N. C. (2021) · SSRN Electronic Journal · doi:10.2139/ssrn.3960267 · Cited by 3
Histone modifications across cancers: mechanisms, therapy and clinical translation
Lu, P., Chan, Y.-T., Kwok, C.-F., Li, Q., Jiang, Z., Xu, L., Feng, Z., Yuan, H., Zou, J., Xun, Y., et al. (2026) · Molecular Cancer · doi:10.1186/s12943-026-02707-5 · Cited by 3
The Mechanism of HDAC2 Inhibitors on Chronic Pancreatitis Pain
Zeng, X., Chen, W., Zhong, D., Dai, Q., He, Y., Ye, R., Xiao, X., & Liao, Y.-H. (2025) · Journal of Neurological Surgery Reports · doi:10.1055/a-2561-8065 · Cited by 1
Tripathi, A., Sharma, G., Pandey, V. K., Rustagi, S., Sharma, A. R., Jha, M., Debnath, A., Joy, J. G., Kim, J., & Jha, A. K. (2026) · GeroScience · doi:10.1007/s11357-026-02107-z · Cited by 1
Dai, S., Ren, N., Liu, C.-M., & Yang, F. (2026) · Cellular & Molecular Biology Letters · doi:10.1186/s11658-026-00935-7 · Cited by 1
Cheng, J.-Y. (2020) · Biomedical Journal of Scientific & Technical Research · doi:10.26717/bjstr.2020.32.005198 · Cited by 1
Kelly, R., Stengel, K. R., Chandru, A., Johnson, L., Hiebert, S. W., & Cowley, S. M. (2023) · bioRxiv (Cold Spring Harbor Laboratory) · doi:10.1101/2023.04.06.535398 · Cited by 1
Self-citationIqbal, J. (2023) · Qeios · doi:10.32388/0er6z3
Chemoproteomics Sheds Light on Epigenetic Targets of [11C]Martinostat in the Human Brain
Catanese, M. C., Klingl, Y. E., Gilbert, T. M., Strebl, M. G., Hartigan, C. R., Schenone, M., & Hooker, J. M. (2025) · ACS Chemical Neuroscience · doi:10.1021/acschemneuro.4c00781
Assessment of histone-modifying enzymes involved in epigenetic gene regulation
Macchia, P. E., & Ungaro, P. (2025) · Elsevier eBooks · doi:10.1016/b978-0-443-26759-8.00010-2
Matrix stress-relaxation and stiffness modulate oligodendrocyte differentiationPreprint
Carvalho, E. D., Morais, M. R. G., Athanasopoulou, G., Araújo, M., Guimarães, S. C., Pluchino, S., Barrias, C. C., & Pêgo, A. P. (2025) · bioRxiv (Cold Spring Harbor Laboratory) · doi:10.1101/2025.10.09.680975
Caractérisation de protéines nucléaires ciblées par la bactérie pathogène Listeria monocytogenes
Pourpre, R. (2019) · theses.fr (ABES) · doi:10.70675/3e0b933ez114cz48e2zae8dzabf6fa8d37b1
Analyse multi-omique des acylations de lysines d'histones pendant la gamétogénèse
Crespo, M. (2019) · theses.fr (ABES) · doi:10.70675/bfab325bz8417z41ffz9a37zb4875d23196c
Feng, J., Zeng, K., Wang, A., Sun, H., Jin, Z., Jin, Z., Feng, S., Sun, X., Bai, Y., He, M., et al. (2026) · bioRxiv (Cold Spring Harbor Laboratory) · doi:10.64898/2026.06.12.731842
Li, W. B., Ye, W., Wang, J., & Liu, Z. (2026) · Acta Pharmaceutica Sinica B · doi:10.1016/j.apsb.2026.06.051
Yang, X., Gong, G., Zhao, Y., Wang, G., & Zhang, F. (2026) · Genes & Diseases · doi:10.1016/j.gendis.2026.102390
Beyond acetylation: Evaluating the emerging biology of lysine acylation
Hintzen, J. C. J., & Burslem, G. M. (2026) · Cell chemical biology · doi:10.1016/j.chembiol.2026.07.009 · Cited by 2
Lv, Z., Li, Q., & Feng, X. (2026) · Frontiers in Immunology · doi:10.3389/fimmu.2026.1981328
Dynamic regulation of H3K9 modifications in cancer: pathogenesis and targeted therapies
Xu, Y., Wu, Q., Zhang, Y., Zhao, J., Fu, X., Li, A., & Li, Y. (2026) · Biomarker Research · doi:10.1186/s40364-026-01019-6
Epigenetics in development, disease, and therapy: from mechanisms to clinical interventions
Ren, Y., Yang, L., Fei, B., Guo, R., Huang, J., Xu, Z., Wang, R., Zhang, P., Cao, D., Chen, P., et al. (2026) · Science China Life Sciences · doi:10.1007/s11427-025-3356-1
Protein Lysine Lactylation in DNA Damage Response: Regulatory Mechanisms and Emerging Functions
裴新可, Zhang, J., Gao, Y., Pan, Z., Wang, Y., Wang, L., Wang, Z., Ding, G., Stauber, R. H., Ni, T., et al. (2026) · Biomolecules · doi:10.3390/biom16101528
Metadata
- Authors
- Kelly, R. D. W., Chandru, A., Watson, P. J., Song, Y., Blades, M., Robertson, N. S., Jamieson, A. G., Schwabe, J. W. R., & Cowley, S. M.
- Affiliations
- University of Leicester (GB)
- University of Cambridge (GB)
- University of Glasgow (GB)
- Corresponding author
- Cowley, S. M.
- Venue
- Scientific Reports
- Published
- 2018-10-02
- Volume
- 8
- Issue
- 1
- Pages
- 14690-14690
- ISSN
- 2045-2322 (ISSN-L)
- PMC
- PMC6168483
- OpenAlex
- W2892763111
- Semantic Scholar
- 5dcbd5abb94c07fb1ae9c0b7b1a6842367d603a5
- Cited by
- 138
- References
- 49
- Citations by year
- 2026: 13 · 2025: 20 · 2024: 25 · 2023: 17 · 2022: 19 · 2021: 21 · 2020: 12 · 2019: 11
- FWCI
- 3.91
- Type
- journal article
- Language
- en
- Open access
- gold
- doi.org
- Locations
- Scientific Reports (publishedVersion, cc-by)
- Europe PMC (PubMed Central) (publishedVersion, cc-by)
- PubMed Central (publishedVersion, cc-by)
- PubMed (publishedVersion)
- ENLIGHTEN (Jurnal Bimbingan dan Konseling Islam) (acceptedVersion, cc-by-sa)
- DOAJ (DOAJ: Directory of Open Access Journals) (submittedVersion)
- Figshare (submittedVersion, cc-by)
- Leicester Research Archive (University of Leicester) (submittedVersion, cc-by)
- Apollo (University of Cambridge) (submittedVersion, cc-by)
- Apollo (cc-by)
- Funders
- Engineering and Physical Sciences Research Council (EP/N034260/1)
- Wellcome Trust (100237)
- Biotechnology and Biological Sciences Research Council (BB/N002954/1, BB/P021689/1)
- Medical Research Council (MR/J009202/1)
- Topics
- Life Sciences › Biochemistry, Genetics and Molecular Biology › Molecular Biology › Histone Deacetylase Inhibitors Research
- Life Sciences › Biochemistry, Genetics and Molecular Biology › Molecular Biology › Genomics and Chromatin Dynamics
- Life Sciences › Biochemistry, Genetics and Molecular Biology › Molecular Biology › Epigenetics and DNA Methylation
- Keywords
- HDAC1, HDAC2, histone crotonylation, histone acetylation, LSD1, H3K18, histone acylation, corepressor complex, epigenetic regulation, embryonic stem cells
- MeSH terms
- Cell Line, Histones, Humans, Multienzyme Complexes, Protein Processing, Post-Translational, Histone Deacetylase 1, Histone Deacetylase 2
About these checks
Registry, retraction, Cites and statistics results are computed, not judged, with one exception: a printed reference that no index lists is read once by a model before it counts as a citation error. Claims are extracted by a model and kept only when their quote appears verbatim in the text; each cited source is then checked, with a model’s help, for whether it says what the claim relies on. Those verdicts can be wrong — read the claim’s quote and the cited source before relying on one.
A language model drew the claims from the paper on 2026-10-10, under version 3 of the claim definition (model deepseek-v4.1-flash, prompt extract-v3).
A second model labelled each claim on 2026-10-10 (model jev-1.13-20260917, definition revision gold-guideline-v0.2).
Statistics and arithmetic are recomputed, not judged.
Confidence bands are shown only for fields calibrated on our annotated test set. None is calibrated yet, so no band is shown.
What counts as a claim ›How we measure confidence ›How we check this ›
Are you an author, or do you see a problem with this page? Request a review
