

The DOI matches its Crossref record; 4 of the 4 references it cites were found in a registry or an index.
Analysis of expression of the PD-1/PD-L1 immune checkpoint system and its prognostic impact in gastroenteropancreatic neuroendocrine tumors
Abstract
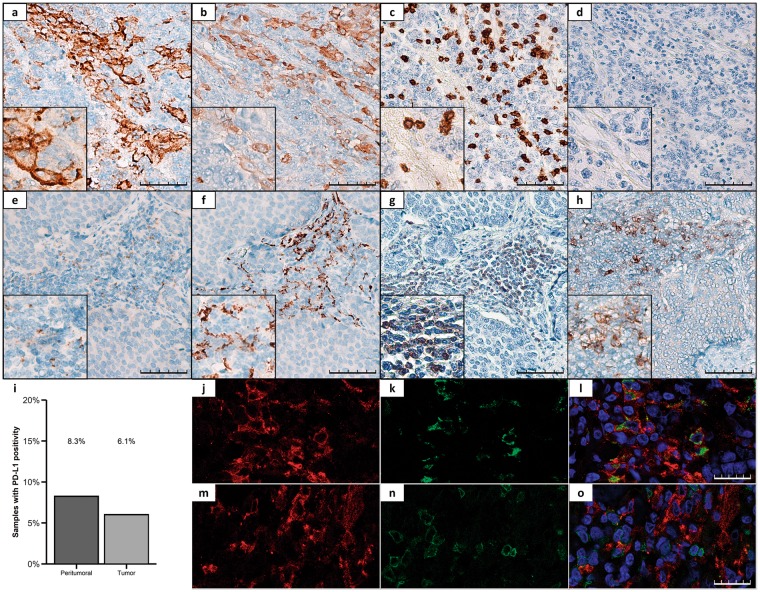
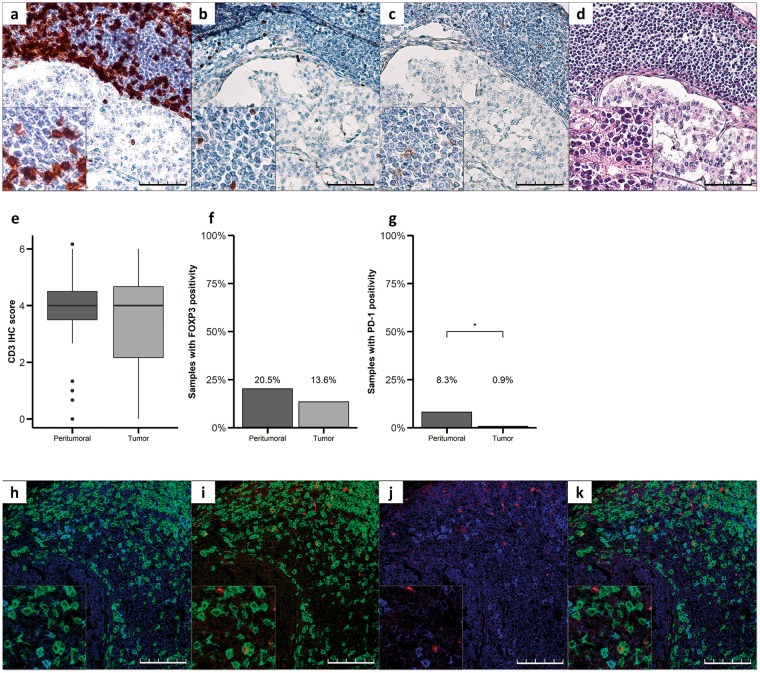
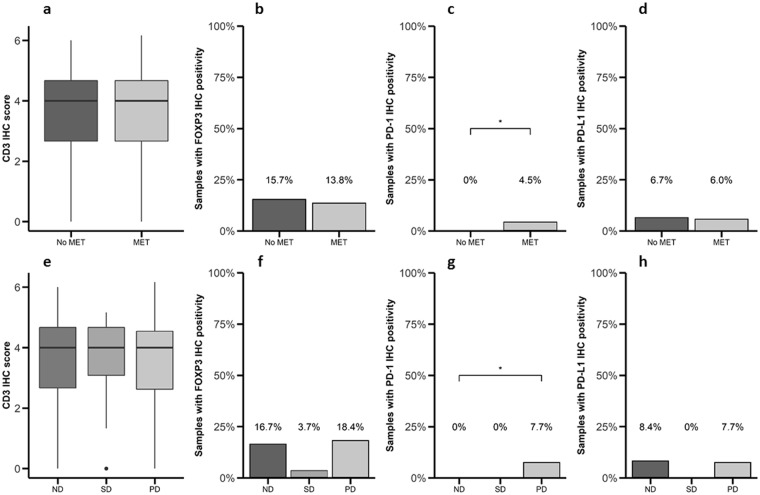
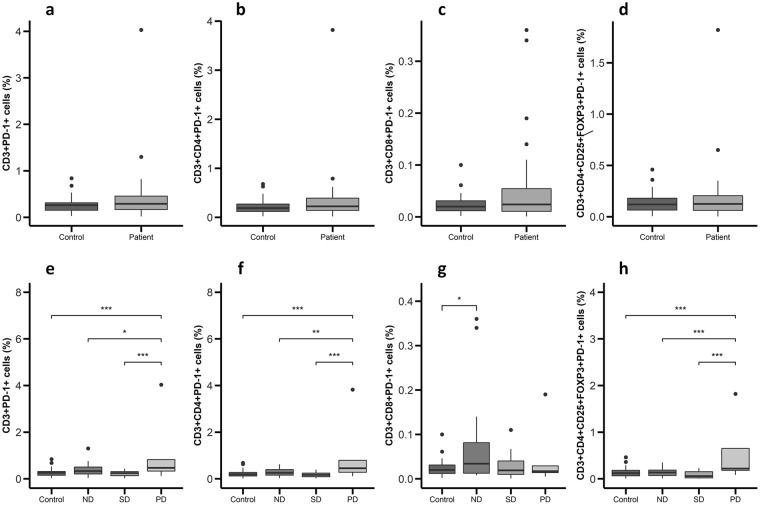
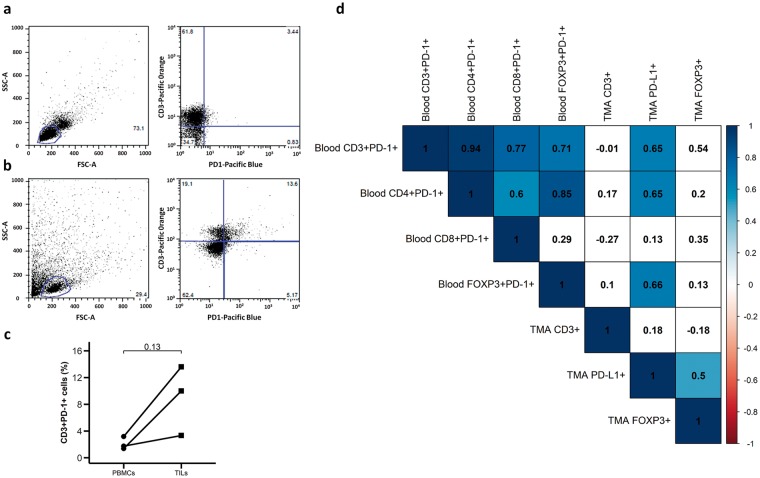
The immune checkpoint based therapy targeting the programmed death-1 (PD-1) receptor and its PD-L1 ligand has recently been approved for the therapy of different malignant conditions, but not yet for gastroenteropancreatic neuroendocrine tumors (GEP-NETs). In this context, we evaluated the expression of PD-1 and PD-L1 in GEP-NETs and its potential correlations with clinical outcomes. Expression of PD-1/PD-L1 was analyzed by immunohistochemistry in 116 GEP-NETs and 48 samples of peritumoral tissue. In addition, the expression of these molecules was assessed by flow cytometry in peripheral blood mononuclear cells (PBMC) from patients with GEP-NETs (n = 32) and healthy controls (n = 32) and in intratumoral mononuclear cells (TMCs) (n = 3). Expression of PD-L1 and PD-1 was detected by immunohistochemistry in 6% and 1% of tumor tissue samples, respectively, and in 8% of peritumoral tissue samples, for both markers. We also observed that PD-1 expression by TMCs was associated with metastatic disease at diagnosis, and the levels of circulating PD-1+ PBMCs were associated with progressive disease upon follow-ups. In addition, circulating PD-1+ PBMCs were significantly correlated with PD-L1 expression by tumor cells. Our data suggest that PD-1/PD-L1 is expressed in 1 to 8% of GEP-NETs, and that this feature is significantly associated with disease evolution (p < 0.01).
Overview
The claims and statistics of this paper haven’t been checked yet.
Run the check — free, no account needed. It reads the open-access text and checks the sources it cites.
Integrity signals
Registry
Cites
Statistics
Figures
Verification
Claims the paper makes
The claims and statistics of this paper haven’t been checked yet.
Run the check — free, no account needed. It reads the open-access text and checks the sources it cites.
Claims other papers make about this one
Each is checked against this paper’s own text: does it say what the citing paper says it does?
In the citing paper
“However, the major challenge for COL is its toxicity, which causes severe side effects to patients [4].”
From Targeted Nano-Drug Delivery of Colchicine against Colon Cancer Cells by Means of Mesoporous Silica Nanoparticles (2020) · cites this paper as [4]
Self-check
Percentages, sums and reported differences re-computed from the paper’s own numbers.
The self-check needs the paper’s full text.
Citations
Cites
Innate and adaptive immune cells in the tumor microenvironment
Gajewski, T. F., Schreiber, H., & Fu, Y.-X. (2013) · Nature Immunology · doi:10.1038/ni.2703 · Cited by 4,148
PD-L2 is a second ligand for PD-1 and inhibits T cell activation
Latchman, Y., Wood, C. R., Chernova, T., Chaudhary, D., Borde, M., Chernova, I., Iwai, Y., Long, A. J., Brown, J. A., Nunes, R., et al. (2001) · Nature Immunology · doi:10.1038/85330 · Cited by 2,955
CTLA-4 and PD-1 Pathways: Similarities, Differences, and Implications of Their Inhibition
Buchbinder, E. I., & Desai, A. (2016) · American Journal of Clinical Oncology · doi:10.1097/coc.0000000000000239 · Cited by 2,360
Inhibitory B7-family molecules in the tumour microenvironment
Zou, W., & Chen, L. (2008) · Nature Reviews Immunology · doi:10.1038/nri2326 · Cited by 1,608
Research works printed but not linked: 36
- Parry, R. V. et al. CTLA-4 and PD-1 receptors inhibit T-cell activation by distinct mechanisms. Mol Cell Biol 25, 9543–9553, https://doi.org/10.1128/MCB.25.21.9543-9553.2005 (2005). · DOI · Paper page
- Topalian, S. L., Drake, C. G. & Pardoll, D. M. Immune checkpoint blockade: a common denominator approach to cancer therapy. Cancer Cell 27, 450–461, https://doi.org/10.1016/j.ccell.2015.03.001 (2015). · DOI · Paper page
- Brahmer, J. R. et al. Phase I study of single-agent anti-programmed death-1 (MDX-1106) in refractory solid tumors: safety, clinical activity, pharmacodynamics, and immunologic correlates. J Clin Oncol 28, 3167–3175, https://doi.org/10.1200/JCO.2009.26.7609 (2010). · DOI
- Topalian, S. L. et al. Survival, durable tumor remission, and long-term safety in patients with advanced melanoma receiving nivolumab. J Clin Oncol 32, 1020–1030, https://doi.org/10.1200/JCO.2013.53.0105 (2014). · DOI · Paper page
- McDermott, D. F. et al. Survival, Durable Response, and Long-Term Safety in Patients With Previously Treated Advanced Renal Cell Carcinoma Receiving Nivolumab. J Clin Oncol 33, 2013–2020, https://doi.org/10.1200/JCO.2014.58.1041 (2015). · DOI
- Powles, T. et al. MPDL3280A (anti-PD-L1) treatment leads to clinical activity in metastatic bladder cancer. Nature 515, 558–562, https://doi.org/10.1038/nature13904 (2014). · DOI
- Nowicki, T. S., Hu-Lieskovan, S. & Ribas, A. Mechanisms of Resistance to PD-1 and PD-L1 Blockade. Cancer J 24, 47–53, https://doi.org/10.1097/PPO.0000000000000303 (2018). · DOI
- Francisco, L. M., Sage, P. T. & Sharpe, A. H. The PD-1 pathway in tolerance and autoimmunity. Immunol Rev 236, 219–242, https://doi.org/10.1111/j.1600-065X.2010.00923.x (2010). · DOI · Paper page
- Keir, M. E., Butte, M. J., Freeman, G. J. & Sharpe, A. H. PD-1 and its ligands in tolerance and immunity. Annu Rev Immunol 26, 677–704, https://doi.org/10.1146/annurev.immunol.26.021607.090331 (2008). · DOI · Paper page
- Liang, S. C. et al. Regulation of PD-1, PD-L1, and PD-L2 expression during normal and autoimmune responses. Eur J Immunol 33, 2706–2716, https://doi.org/10.1002/eji.200324228 (2003). · DOI
- Kuang, D. M. et al. Activated monocytes in peritumoral stroma of hepatocellular carcinoma foster immune privilege and disease progression through PD-L1. J Exp Med 206, 1327–1337, https://doi.org/10.1084/jem.20082173 (2009). · DOI
- Wu, K., Kryczek, I., Chen, L., Zou, W. & Welling, T. H. Kupffer cell suppression of CD8+ T cells in human hepatocellular carcinoma is mediated by B7-H1/programmed death-1 interactions. Cancer Res 69, 8067–8075, https://doi.org/10.1158/0008-5472.CAN-09-0901 (2009). · DOI · Paper page
- Perrot, I. et al. Dendritic cells infiltrating human non-small cell lung cancer are blocked at immature stage. J Immunol 178, 2763–2769, https://doi.org/10.4049/jimmunol.178.5.2763 (2007). · DOI
- Khan, A. R. et al. PD-L1hi B cells are critical regulators of humoral immunity. Nat Commun 6, 5997, https://doi.org/10.1038/ncomms6997 (2015). · DOI
- Ostrand-Rosenberg, S., Horn, L. A. & Haile, S. T. The programmed death-1 immune-suppressive pathway: barrier to antitumor immunity. J Immunol 193, 3835–3841, https://doi.org/10.4049/jimmunol.1401572 (2014). · DOI
- Francisco, L. M. et al. PD-L1 regulates the development, maintenance, and function of induced regulatory T cells. J Exp Med 206, 3015–3029, https://doi.org/10.1084/jem.20090847 (2009). · DOI
- Intlekofer, A. M. & Thompson, C. B. At the bench: preclinical rationale for CTLA-4 and PD-1 blockade as cancer immunotherapy. J Leukoc Biol 94, 25–39, https://doi.org/10.1189/jlb.1212621 (2013). · DOI
- Lee, Y. H., Bae, S. C., Kim, J. H. & Song, G. G. Meta-analysis of genetic polymorphisms in programmed cell death 1. Associations with rheumatoid arthritis, ankylosing spondylitis, and type 1 diabetes susceptibility. Z Rheumatol 74, 230–239, https://doi.org/10.1007/s00393-014-1415-y (2015). · DOI
- Gao, J. et al. Meta-analysis of programmed cell death 1 polymorphisms with systemic lupus erythematosus risk. Oncotarget 8, 36885–36897, https://doi.org/10.18632/oncotarget.16378 (2017). · DOI
- Chai, S. M., Brown, I. S. & Kumarasinghe, M. P. Gastroenteropancreatic neuroendocrine neoplasms: selected pathology review and molecular updates. Histopathology 72, 153–167, https://doi.org/10.1111/his.13367 (2018). · DOI
- Kos-Kudla, B. et al. Current treatment options for gastroenteropancreatic neuroendocrine tumors with a focus on the role of lanreotide. Contemp Oncol (Pozn) 21, 115–122, https://doi.org/10.5114/wo.2017.68619 (2017). · DOI
- Yao, J. C. et al. One hundred years after “carcinoid”: epidemiology of and prognostic factors for neuroendocrine tumors in 35,825 cases in the United States. J Clin Oncol 26, 3063–3072, https://doi.org/10.1200/JCO.2007.15.4377 (2008). · DOI
- Gong, J., Chehrazi-Raffle, A., Reddi, S. & Salgia, R. Development of PD-1 and PD-L1 inhibitors as a form of cancer immunotherapy: a comprehensive review of registration trials and future considerations. J Immunother Cancer 6, 8, https://doi.org/10.1186/s40425-018-0316-z (2018). · DOI
- Lamarca, A. et al. PD-L1 expression and presence of TILs in small intestinal neuroendocrine tumours. Oncotarget 9, 14922–14938, https://doi.org/10.18632/oncotarget.24464 (2018). · DOI
- Dong, H., Zhu, G., Tamada, K. & Chen, L. B7-H1, a third member of the B7 family, co-stimulates T-cell proliferation and interleukin-10 secretion. Nat Med 5, 1365–1369, https://doi.org/10.1038/70932 (1999). · DOI · Paper page
- Dong, H. et al. Tumor-associated B7-H1 promotes T-cell apoptosis: a potential mechanism of immune evasion. Nat Med 8, 793–800, https://doi.org/10.1038/nm730 (2002). · DOI · Paper page
- Yamazaki, T. et al. Expression of programmed death 1 ligands by murine T cells and APC. J Immunol 169, 5538–5545, https://doi.org/10.4049/jimmunol.169.10.5538 (2002). · DOI
- Taube, J. M. et al. Association of PD-1, PD-1 ligands, and other features of the tumor immune microenvironment with response to anti-PD-1 therapy. Clin Cancer Res 20, 5064–5074, https://doi.org/10.1158/1078-0432.CCR-13-3271 (2014). · DOI · Paper page
- Fan, Y. et al. Prognostic value of PD-L1 and PD-1 expression in pulmonary neuroendocrine tumors. Onco Targets Ther 9, 6075–6082, https://doi.org/10.2147/OTT.S115054 (2016). · DOI
- Tsuruoka, K. et al. PD-L1 expression in neuroendocrine tumors of the lung. Lung Cancer 108, 115–120, https://doi.org/10.1016/j.lungcan.2017.03.006 (2017). · DOI
- Schultheis, A. M. et al. PD-L1 expression in small cell neuroendocrine carcinomas. Eur J Cancer 51, 421–426, https://doi.org/10.1016/j.ejca.2014.12.006 (2015). · DOI
- Kim, S. T. et al. The Impact of PD-L1 Expression in Patients with Metastatic GEP-NETs. J Cancer 7, 484–489, https://doi.org/10.7150/jca.13711 (2016). · DOI
- Cavalcanti, E., Armentano, R., Valentini, A. M., Chieppa, M. & Caruso, M. L. Role of PD-L1 expression as a biomarker for GEP neuroendocrine neoplasm grading. Cell Death Dis 8, e3004, https://doi.org/10.1038/cddis.2017.401 (2017). · DOI
- Zheng, H. et al. Expression of PD-1 on CD4+ T cells in peripheral blood associates with poor clinical outcome in non-small cell lung cancer. Oncotarget 7, 56233–56240, https://doi.org/10.18632/oncotarget.9316 (2016). · DOI
- Oberg, K. et al. ENETS Consensus Guidelines for Standard of Care in Neuroendocrine Tumours: Biochemical Markers. Neuroendocrinology 105, 201–211, https://doi.org/10.1159/000472254 (2017). · DOI
- Wickham, H. ggplot2: Elegant Graphics for Data Analysis. (Springer-Verlag New York, 2009). · DOI · Paper page
Cited by
Sorted by citations
The efficacy of PD-1/PD-L1 blockade in cold cancers and future perspectives
Majidpoor, J., & Mortezaee, K. (2021) · Clinical Immunology · doi:10.1016/j.clim.2021.108707 · Cited by 236
AbouAitah, K., Hassan, H. A., Swiderska-Sroda, A., Gohar, L., Shaker, O. G., Wojnarowicz, J., Opalinska, A., Smalc-Koziorowska, J., Gierlotka, S., & Lojkowski, W. (2020) · Cancers · doi:10.3390/cancers12010144 · Cited by 105
Metadata
- Authors
- Sampedro-Núñez, M., Serrano-Somavilla, A., Adrados, M., Cameselle-Teijeiro, J. M., Blanco-Carrera, C., Cabezas-Agricola, J. M., Martínez-Hernández, R., Martín-Pérez, E., Muñoz de Nova, J. L., Díaz, J. Á., García-Centeno, R., Caneiro-Gómez, J., Abdulkader, I., González-Amaro, R., & Marazuela, M.
- Venue
- Scientific Reports
- Published
- 2018-12-13
- Volume
- 8
- Issue
- 1
- ISSN
- 2045-2322
- PMC
- PMC6292913
- Cited by
- 49
- References
- 4
- Language
- en
About these checks
Registry, retraction, Cites and statistics results are computed, not judged, with one exception: a printed reference that no index lists is read once by a model before it counts as a citation error. Claims are extracted by a model and kept only when their quote appears verbatim in the text; each cited source is then checked, with a model’s help, for whether it says what the claim relies on. Those verdicts can be wrong — read the claim’s quote and the cited source before relying on one.
Statistics and arithmetic are recomputed, not judged.
Confidence bands are shown only for fields calibrated on our annotated test set. None is calibrated yet, so no band is shown.
What counts as a claim ›How we measure confidence ›How we check this ›
Are you an author, or do you see a problem with this page? Request a review
How to cite
Cite CoChat for the checks on this page, and the paper for its own findings.
- This page
- CoChat. (2026). Citation check: Analysis of expression of the PD-1/PD-L1 immune checkpoint system and its prognostic impact in gastroenteropancreatic neuroendocrine tumors. https://app.cochat.ai/papers/10.1038/s41598-018-36129-1
- The paper
- Sampedro-Núñez, M., Serrano-Somavilla, A., Adrados, M., Cameselle-Teijeiro, J. M., Blanco-Carrera, C., Cabezas-Agricola, J. M., Martínez-Hernández, R., Martín-Pérez, E., Muñoz de Nova, J. L., Díaz, J. Á., García-Centeno, R., Caneiro-Gómez, J., Abdulkader, I., González-Amaro, R., & Marazuela, M. (2018). Analysis of expression of the PD-1/PD-L1 immune checkpoint system and its prognostic impact in gastroenteropancreatic neuroendocrine tumors. Scientific Reports. https://doi.org/10.1038/s41598-018-36129-1
