

The DOI matches its Crossref record; 32 of the 32 references it cites were found in a registry or an index.
DMSO cryopreservation is the method of choice to preserve cells for droplet-based single-cell RNA sequencing
Open accessAbstract
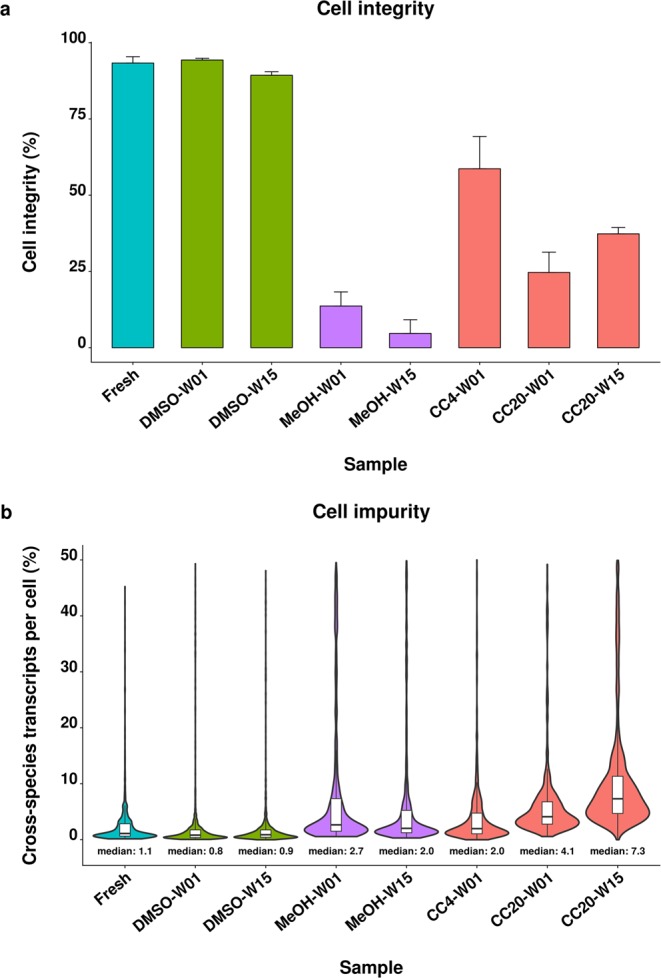
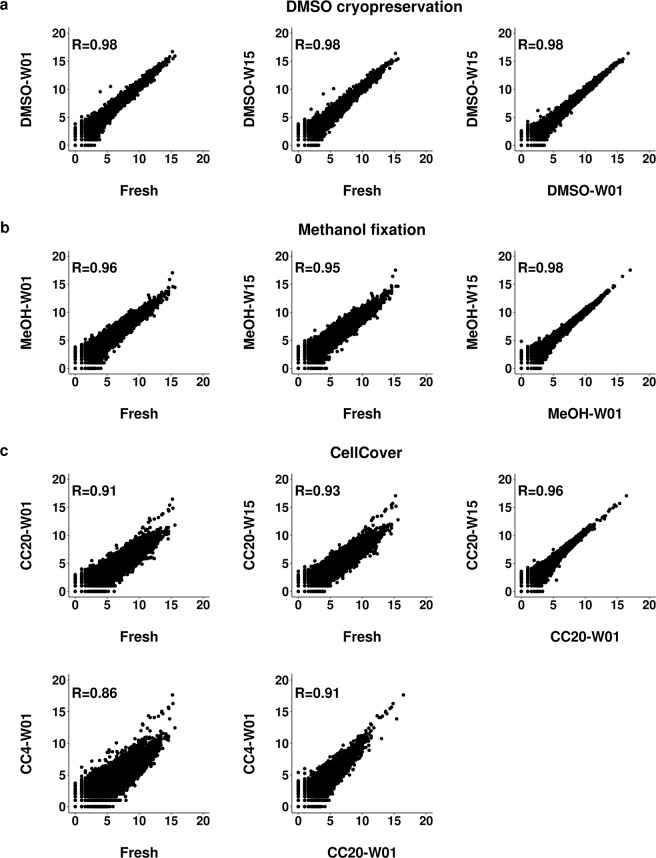
Combining single-cell RNA sequencing (scRNA-seq) with upstream cell preservation procedures such as cryopreservation or methanol fixation has recently become more common. By separating cell handling and preparation, from downstream library generation, scRNA-seq workflows are more flexible and manageable. However, the inherent transcriptomic changes associated with cell preservation and how they may bias further downstream analysis remain unknown. Here, we present a side-by-side droplet-based scRNA-seq analysis, comparing the gold standard – fresh cells – to three different cell preservation workflows: dimethyl sulfoxide based cryopreservation, methanol fixation and CellCover reagent. Cryopreservation proved to be the most robust protocol, maximizing both cell integrity and low background ambient RNA. Importantly, gene expression profiles from fresh cells correlated most with those of cryopreserved cells. Such similarities were consistently observed across the tested cell lines (R ≥ 0.97), monocyte-derived macrophages (R = 0.97) and immune cells (R = 0.99). In contrast, both methanol fixation and CellCover preservation showed an increased ambient RNA background and an overall lower gene expression correlation to fresh cells. Thus, our results demonstrate the superiority of cryopreservation over other cell preservation methods. We expect our comparative study to provide single-cell omics researchers invaluable support when integrating cell preservation into their scRNA-seq studies.
Overview
The claims and statistics of this paper haven’t been checked yet.
Run the check — free, no account needed. It reads the open-access text and checks the sources it cites.
Integrity signals
Registry
Cites
Statistics
Figures
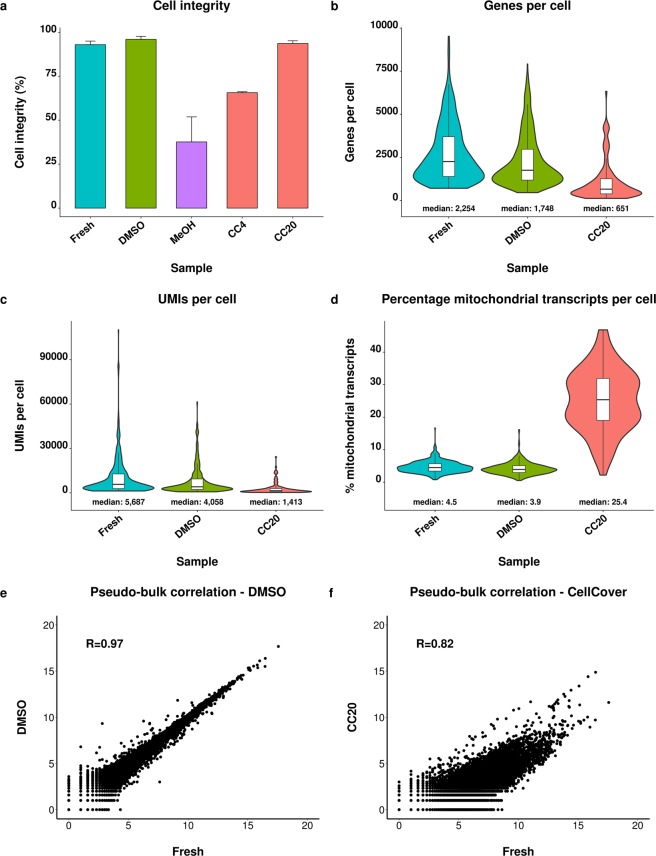
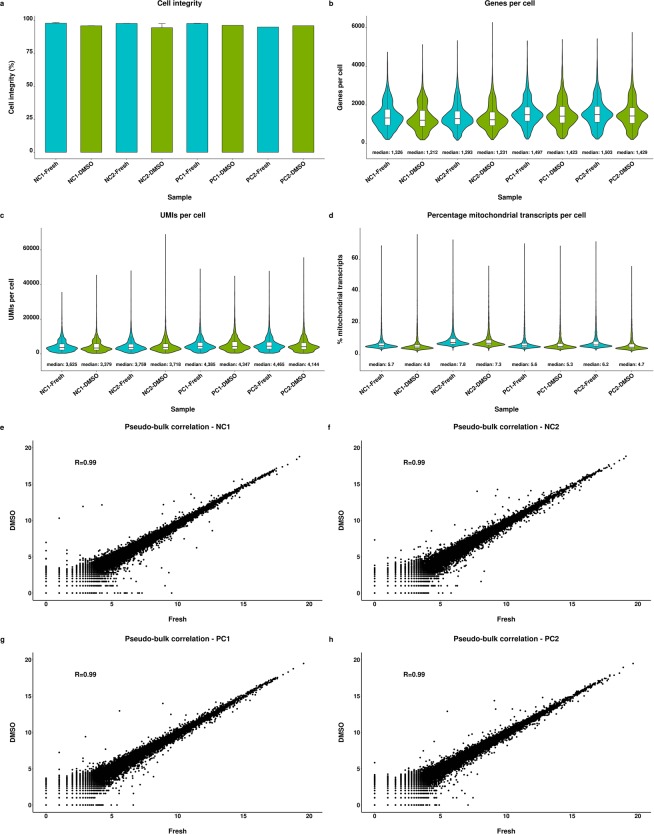
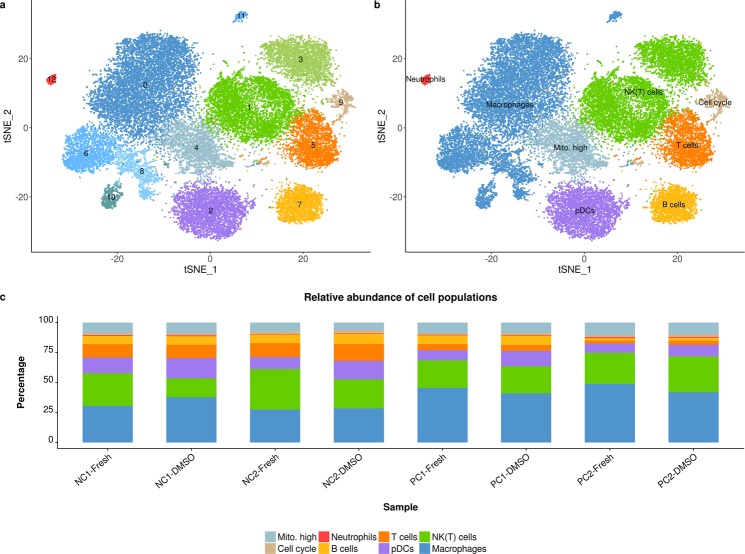
Verification
Claims the paper makes
The claims and statistics of this paper haven’t been checked yet.
Run the check — free, no account needed. It reads the open-access text and checks the sources it cites.
Claims other papers make about this one
Each is checked against this paper’s own text: does it say what the citing paper says it does?
In the citing paper
“we observed ambient RNA contamination with highly abundant transcripts suggesting cell damage by methanol fixation [22].”
From Systematic assessment of tissue dissociation and storage biases in single-cell and single-nucleus RNA-seq workflows (2020) · cites this paper as [22]
Self-check
Percentages, sums and reported differences re-computed from the paper’s own numbers.
The self-check needs the paper’s full text.
Citations
Cites
STAR: ultrafast universal RNA-seq aligner
Dobin, A., Davis, C. A., Schlesinger, F., Drenkow, J., Zaleski, C., Jha, S., Batut, P., Chaisson, M., & Gingeras, T. R. (2013) · Bioinformatics · doi:10.1093/bioinformatics/bts635 · Cited by 51,709
Robinson, M. D., McCarthy, D. J., & Smyth, G. K. (2010) · Bioinformatics · doi:10.1093/bioinformatics/btp616 · Cited by 41,364
limma powers differential expression analyses for RNA-sequencing and microarray studies
Ritchie, M. E., Phipson, B., Wu, D., Hu, Y., Law, C. W., Shi, W., & Smyth, G. K. (2015) · Nucleic Acids Research · doi:10.1093/nar/gkv007 · Cited by 40,458
Integrating single-cell transcriptomic data across different conditions, technologies, and species
Butler, A., Hoffman, P., Smibert, P., Papalexi, E., & Satija, R. (2018) · Nature Biotechnology · doi:10.1038/nbt.4096 · Cited by 13,174
Massively parallel digital transcriptional profiling of single cells
Zheng, G. X. Y., Terry, J. M., Belgrader, P., Ryvkin, P., Bent, Z. W., Wilson, R., Ziraldo, S. B., Wheeler, T. D., McDermott, G. P., Zhu, J., et al. (2017) · Nature Communications · doi:10.1038/ncomms14049 · Cited by 7,353
Highly parallel genome-wide expression profiling of individual cells using nanoliter droplets.
Macosko, E. Z., Basu, A., Satija, R., Nemesh, J., Shekhar, K., Goldman, M., Tirosh, I., Bialas, A. R., Kamitaki, N., Martersteck, E. M., et al. (2015) · Cell · doi:10.1016/j.cell.2015.05.002 · Cited by 7,110
mRNA-Seq whole-transcriptome analysis of a single cell
Tang, F., Barbacioru, C., Wang, Y., Nordman, E., Lee, C., Xu, N., Wang, X., Bodeau, J., Tuch, B. B., Siddiqui, A., et al. (2009) · Nature Methods · doi:10.1038/nmeth.1315 · Cited by 3,969
Droplet barcoding for single-cell transcriptomics applied to embryonic stem cells
Klein, A. M., Mazutis, L., Akartuna, I., Tallapragada, N., Veres, A., Li, V., Peshkin, L., Weitz, D. A., & Kirschner, M. W. (2015) · Cell · doi:10.1016/j.cell.2015.04.044 · Cited by 3,356
Finak, G., McDavid, A., Yajima, M., Deng, J., Gersuk, V., Shalek, A. K., Slichter, C. K., Miller, H. W., McElrath, M. J., Prlic, M., et al. (2015) · Genome Biology · doi:10.1186/s13059-015-0844-5 · Cited by 3,159
Single-cell RNA sequencing to explore immune cell heterogeneity
Papalexi, E., & Satija, R. (2018) · Nature Reviews Immunology · doi:10.1038/nri.2017.76 · Cited by 1,806
Cited by
Sorted by citations
Denisenko, E., Guo, B. B., Jones, M., Hou, R., de Kock, L., Lassmann, T., Poppe, D., Clément, O., Simmons, R. K., Lister, R., et al. (2020) · Genome Biology · doi:10.1186/s13059-020-02048-6 · Cited by 686
Benchmarking single-cell RNA-sequencing protocols for cell atlas projects
Mereu, E., Lafzi, A., Moutinho, C., Ziegenhain, C., McCarthy, D. J., Álvarez-Varela, A., Batlle, E., Sagar, Grün, D., Lau, J. K., et al. (2020) · Nature Biotechnology · doi:10.1038/s41587-020-0469-4 · Cited by 499
Advancing Cancer Research and Medicine with Single-Cell Genomics
Lim, B., Lin, Y., & Navin, N. E. (2020) · Cancer Cell · doi:10.1016/j.ccell.2020.03.008 · Cited by 297
Single-Cell RNA Sequencing Analysis: A Step-by-Step Overview
Slovin, S., Carissimo, A., Panariello, F., Grimaldi, A., Bouchè, V., Gambardella, G., & Cacchiarelli, D. (2021) · Methods in molecular biology · doi:10.1007/978-1-0716-1307-8_19 · Cited by 264
Riemondy, K. A., Venkataraman, S., Willard, N., Nellan, A., Sanford, B. L., Griesinger, A. M., Amani, V. M., Mitra, S. S., Hankinson, T. C., Handler, M. H., et al. (2020) · Neuro-Oncology · doi:10.1093/neuonc/noab135 · Cited by 138
Single-cell transcriptomics identifies conserved regulators of neuroglandular lineages
Steger, J., Cole, A. G., Denner, A., Lebedeva, T. S., Genikhovich, G., Ries, A., Reischl, R., Taudes, E., Lassnig, M., & Technau, U. (2022) · Cell Reports · doi:10.1016/j.celrep.2022.111370 · Cited by 114
miQC: An adaptive probabilistic framework for quality control of single-cell RNA-sequencing data
Hippen, A. A., Falco, M. M., Weber, L. M., Erkan, E. P., Zhang, K., Doherty, J. A., Vähärautio, A., Greene, C. S., & Hicks, S. C. (2021) · PLoS Computational Biology · doi:10.1371/journal.pcbi.1009290 · Cited by 114
Gillen, A. E., Riemondy, K. A., Amani, V. M., Griesinger, A. M., Gilani, A., Venkataraman, S., Madhavan, K. P. C., Prince, E. W., Sanford, B. L., Hankinson, T. C., et al. (2019) · Cell Reports · doi:10.1016/j.celrep.2020.108023 · Cited by 88
Seyfferth, C., Eekhout, T., Shi, D., Neumann, M., Berg, L. S., Ke, Y., Shahan, R., Cox, K. L., Gómez-Cano, F., Nelissen, H., et al. (2024) · The Plant Cell · doi:10.1093/plcell/koae003 · Cited by 88
Roque‐Borda, C. A., Kulus, D., de Souza, A. V., Kaviani, B., & Vicente, E. F. (2021) · International Journal of Molecular Sciences · doi:10.3390/ijms22116157 · Cited by 79
McCluskey, D., Benzian-Olsson, N., Mahil, S. K., Hassi, K., Wohnhaas, C. T., Burden, A. D., Griffiths, C. E. M., Ingram, J. R., Levell, N. J., Parslew, R., et al. (2022) · Journal of Allergy and Clinical Immunology · doi:10.1016/j.jaci.2022.04.027 · Cited by 77
Self-citationWu, S. Z., Roden, D. L., Al‐Eryani, G., Bartoniček, N., Harvey, K., Cazet, A., Chan, C., Junankar, S. R., Hui, M. N., Millar, E. A., et al. (2021) · Genome Medicine · doi:10.1186/s13073-021-00885-z · Cited by 66
Cryopreservation: A Comprehensive Overview, Challenges, and Future Perspectives
Parihar, A., Kumar, A., Panda, U., Khan, R., Parihar, D. S., & Khan, R. (2023) · Advanced Biology · doi:10.1002/adbi.202200285 · Cited by 65
The Application of Single‐Cell RNA Sequencing in Vaccinology
Noé, A., Cargill, T. N., Nielsen, C. M., Russell, A. J. C., & Barnes, E. J. (2020) · Journal of Immunology Research · doi:10.1155/2020/8624963 · Cited by 61
Valkiers, S., de Vrij, N., Gielis, S., Verbandt, S., Ogunjimi, B., Laukens, K., & Meysman, P. (2022) · ImmunoInformatics · doi:10.1016/j.immuno.2022.100009 · Cited by 56
Gallardo‐Villagrán, M., Paulus, L., Leger, D. Y., Therrien, B., & Liagre, B. (2022) · Molecules · doi:10.3390/molecules27144472 · Cited by 50
Deleersnijder, D., Callemeyn, J., Arijs, I., Naesens, M., Craenenbroeck, A. H. V., Lambrechts, D., & Sprangers, B. (2021) · Journal of the American Society of Nephrology · doi:10.1681/asn.2021020157 · Cited by 49
Wohnhaas, C. T., Bassler, K. E., Watson, C. K., Shen, Y., Leparc, G., Tilp, C., Heinemann, F., Kind, D., Stierstorfer, B., Delić, D., et al. (2024) · Frontiers in Immunology · doi:10.3389/fimmu.2024.1325090 · Cited by 45
Self-citationGibson, A., Ram, R., Gangula, R., Li, Y., Mukherjee, E. M., Palubinsky, A. M., Campbell, C. N., Thorne, M., Konvinse, K. C., Choshi, P., et al. (2024) · Nature Communications · doi:10.1038/s41467-024-52990-3 · Cited by 44
High-throughput microfluidic droplets in biomolecular analytical system: A review
Zhang, L., Parvin, R., Chen, M., Hu, D., Fan, Q., & Ye, F. (2023) · Biosensors and Bioelectronics · doi:10.1016/j.bios.2023.115213 · Cited by 43
Berrío, R. T., Verhelst, E., Eekhout, T., Grones, C., Veylder, L. D., Rybel, B. D., & Dubois, M. (2025) · New Phytologist · doi:10.1111/nph.20446 · Cited by 44
Effects of Cryopreservation and Thawing on Single-Cell Transcriptomes of Human T Cells
Lee, J. S., Yi, K., Ju, Y. S., & Shin, E. (2020) · Immune Network · doi:10.4110/in.2020.20.e34 · Cited by 38
Channathodiyil, P., & Houseley, J. M. (2021) · PLoS ONE · doi:10.1371/journal.pone.0240769 · Cited by 32
León‐Rivera, R., Morsey, B., Niu, M., Fox, H. S., & Berman, J. W. (2020) · mBio · doi:10.1128/mbio.01037-20 · Cited by 33
McKinnon, B. D., Lukowski, S. W., Mortlock, S., Crawford, J., Atluri, S. C., Subramaniam, S., Johnston, R. L., Nirgianakis, K., Tanaka, K., Amoako, A. A., et al. (2022) · Communications Biology · doi:10.1038/s42003-022-03541-3 · Cited by 28
Unraveling patterns of disrupted gene expression across a complex tissue
Hunnicutt, K. E., Good, J. M., & Larson, E. L. (2021) · Evolution · doi:10.1111/evo.14420 · Cited by 27
Derbois, C., Palomares, M.-A., Deleuze, J., Cabannes, É., & Bonnet, É. (2023) · Scientific Data · doi:10.1038/s41597-023-02348-z · Cited by 28
Matute, J. D., Finander, B., Pépin, D., Ai, X., Smith, N. P., Li, J. Z., Edlow, A. G., Villani, A., Lerou, P. H., & Kalish, B. T. (2021) · Pediatric Research · doi:10.1038/s41390-021-01793-z · Cited by 26
Morsey, B., Niu, M., Dyavar, S. R., Fletcher, C. V., Lamberty, B. G., Emanuel, K., Fangmeier, A., & Fox, H. S. (2021) · iScience · doi:10.1016/j.isci.2021.102357 · Cited by 25
Practical Considerations for Single‐Cell Genomics
Regan, C., & Preall, J. B. (2022) · Current Protocols · doi:10.1002/cpz1.498 · Cited by 27
Gutiérrez-Franco, A., Ake, F. A., Hassan, M. N., Cayuela, N. C., Mularoni, L., & Plass, M. (2023) · Communications Biology · doi:10.1038/s42003-023-04834-x · Cited by 25
Chen, D., Zaid, M. I. A., Reiter, J. L., Czader, M., Wang, L., McGuire, P. C., Xuei, X., Gao, H., Huang, K., Abonour, R., et al. (2021) · Frontiers in Genetics · doi:10.3389/fgene.2021.663487 · Cited by 23
Vegting, Y., Jongejan, A., Neele, A. E., Claessen, N., Sela, G., Prange, K. H. M., Kers, J., Roelofs, J. J. T. H., van der Heijden, J. W., de Boer, O. J., et al. (2024) · Nephrology Dialysis Transplantation · doi:10.1093/ndt/gfae292 · Cited by 22
Whelan, E. C., Yang, F., Avarbock, M. R., Sullivan, M. C., Beiting, D. P., & Brinster, R. L. (2022) · PLoS Biology · doi:10.1371/journal.pbio.3001618 · Cited by 22
Live slow-frozen human tumor tissues viable for 2D, 3D, ex vivo cultures and single-cell RNAseq
Restivo, G., Tastanova, A., Balázs, Z., Panebianco, F., Diepenbruck, M., Ercan, C., Preca, B.-T., Hafner, J., Weber, W. P., Kurzeder, C., et al. (2022) · Communications Biology · doi:10.1038/s42003-022-04025-0 · Cited by 20
Breathing fresh air into respiratory research with single-cell RNA sequencing
Alexander, M. J., Budinger, G. R. S., & Reyfman, P. A. (2020) · European Respiratory Review · doi:10.1183/16000617.0060-2020 · Cited by 23
Chen, A., Diaz-Soto, M. P., Sanmamed, M. F., Adams, T. S., Schupp, J. C., Gupta, A., Britto, C. J., Sauler, M., Yan, X., Liu, Q., et al. (2021) · Respiratory Research · doi:10.1186/s12931-021-01709-9 · Cited by 20
Ascensión, A. M., Araúzo-Bravo, M. J., & Izeta, A. (2022) · Life · doi:10.3390/life12010067 · Cited by 19
Oh, J., Arbour, N., Giuliani, F., Guenette, M. D., Kolind, S., Lynd, L. D., Marrie, R. A., Metz, L. M., Patten, S. B., Prat, A., et al. (2021) · BMC Neurology · doi:10.1186/s12883-021-02447-7 · Cited by 20
Robertson, H., Gresham, I. J., Nelson, A. R. J., Gregory, K. P., Johnson, E. C., Willott, J. D., Prescott, S. W., Webber, G. B., & Wanless, E. J. (2023) · Langmuir · doi:10.1021/acs.langmuir.3c02596 · Cited by 18
Single-cell genomic analysis of human cerebral organoids
Kanton, S., Treutlein, B., & Camp, J. G. (2020) · Methods in cell biology · doi:10.1016/bs.mcb.2020.03.013 · Cited by 18
Prada, M. L., Espinet, E., Mijošek, V., Schwartz, U., Lutsik, P., Tamas, R., Richter, M., Behrendt, A., Pohl, S. T., Benz, N. P., et al. (2021) · JCI Insight · doi:10.1172/jci.insight.140443 · Cited by 13
Hughes, D. A., Szkuta, B., van Oorschot, R. A. H., & Conlan, X. A. (2021) · Forensic Science International · doi:10.1016/j.forsciint.2021.111096 · Cited by 14
Wong, M., Wei, Y., & Ho, Y. (2023) · Current Opinion in HIV and AIDS · doi:10.1097/coh.0000000000000809 · Cited by 15
Advanced sequencing-based high-throughput and long-read single-cell transcriptome analysis
Huang, S., Shi, W., Li, S., Fan, Q., Yang, C. J., Cao, J., & Wu, L. (2024) · Lab on a Chip · doi:10.1039/d4lc00105b · Cited by 14
Goodspeed, A. E., Bodlak, A., Duffy, A. B., Nelson-Taylor, S., Oike, N., Porfilio, T. E., Shirai, R., Walker, D., Treece, A., Black, J. O., et al. (2025) · Clinical Cancer Research · doi:10.1158/1078-0432.ccr-24-2040 · Cited by 24
Isolating and cryopreserving pig skin cells for single-cell RNA sequencing study
Han, L., Jara, C. P., Wang, O., Shi, Y., Wu, X., Thibivilliers, S., Wóycicki, R. K., Carlson, M. A., Velander, W. H., ARAUJO, E. P. D., et al. (2022) · PLoS ONE · doi:10.1371/journal.pone.0263869 · Cited by 12
scRNA-seq Analysis of Hemocytes of Penaeid Shrimp Under Virus Infection
Koiwai, K., Kondo, H., & Hırono, I. (2023) · Marine Biotechnology · doi:10.1007/s10126-023-10221-8 · Cited by 14
Mikacenic, C. R., Fussner, L. A., Bell, J., Burnham, E. L., Chlan, L. L., Cook, S. K., Dickson, R. P., Almonor, F., Luo, F., Madan, K., et al. (2023) · Annals of the American Thoracic Society · doi:10.1513/annalsats.202302-106st · Cited by 13
Characterization of iCell cardiomyocytes using single-cell RNA-sequencing methods
Schmid, C., Wohnhaas, C. T., Hildebrandt, T., Baum, P., & Rast, G. F. (2020) · Journal of Pharmacological and Toxicological Methods · doi:10.1016/j.vascn.2020.106915 · Cited by 13
Self-citationA pulmonologist's guide to perform and analyse cross-species single lung cell transcriptomics
Pennitz, P., Kirsten, H., Friedrich, V. D., Wyler, E., Goekeri, C., Obermayer, B., Heinz, G. A., Mashreghi, M., Büttner, M., Trimpert, J., et al. (2022) · European Respiratory Review · doi:10.1183/16000617.0056-2022 · Cited by 14
Liposome Formulations for the Strategic Delivery of PARP1 Inhibitors: Development and Optimization
Conceição, C. J. F., Moe, E., Ribeiro, P. A., & Raposo, M. (2023) · Nanomaterials · doi:10.3390/nano13101613 · Cited by 12
Kodali, M. C., Antone, J., Alsop, E. B., Jayakumar, R., Parikh, K., Chiot, A., Sanchez-Molina, P., Ajami, B., Arnold, S. E., Jensen, K., et al. (2024) · Journal of Neuroinflammation · doi:10.1186/s12974-024-03047-1 · Cited by 12
Application of single-cell transcriptomics to kinetoplastid research
Briggs, E. M., Warren, F., Matthews, K. R., McCulloch, R., & Otto, T. D. (2021) · Parasitology · doi:10.1017/s003118202100041x · Cited by 12
Wei, F., Hua, Q., Liang, J., Yue, M., Xu, D., Tian, W., Yu, L., & Feng, Z. (2022) · In Vitro Cellular & Developmental Biology - Animal · doi:10.1007/s11626-022-00729-z · Cited by 11
scROSHI: robust supervised hierarchical identification of single cells
Prummer, M., Bertolini, A., Bosshard, L., Barkmann, F., Yates, J., Boeva, V., Aebersold, R. H., Ak, M., Alquaddoomi, F., Albinus, J. B., et al. (2022) · NAR Genomics and Bioinformatics · doi:10.1093/nargab/lqad058 · Cited by 12
iDESC: identifying differential expression in single-cell RNA sequencing data with multiple subjects
Liu, Y., Zhao, J., Adams, T. S., Wang, N., Schupp, J. C., Wu, W., McDonough, J. E., Chupp, G. L., Kaminski, N., Wang, Z., et al. (2023) · BMC Bioinformatics · doi:10.1186/s12859-023-05432-8 · Cited by 11
Jankelow, A. M., Almeida-Porada, G. D., Atala, A., Sawyer, S. W., & Porada, C. D. (2025) · Stem Cells Translational Medicine · doi:10.1093/stcltm/szaf055 · Cited by 11
Is Dissociation of HCl in DMSO Clusters Bistable?
Sadhukhan, D., Hsu, P., Kuo, J., & Patwari, G. N. (2021) · The Journal of Physical Chemistry A · doi:10.1021/acs.jpca.1c08627 · Cited by 10
Systematic bias assessment in solid tissue 10x scRNA-seq workflowsPreprint
Denisenko, E., Guo, B. B., Jones, M., Hou, R., de Kock, L., Lassmann, T., Poppe, D., Clément, O., Simmons, R. K., Lister, R., et al. (2020) · UWA Profiles and Research Repository (University of Western Australia) · Cited by 10
Heubeck, A. T., Phalen, C. G., Kaul, N., Wittig, P. J., Garber, J., Weiss, M. D. A., Genge, P. C., Thomson, Z., Gustafson, C. E., Reading, J., et al. (2025) · Journal of Translational Medicine · doi:10.1186/s12967-024-06010-z · Cited by 10
Practical Considerations for Complex Tissue Dissociation for Single-Cell Transcriptomics
Pohl, S. T., Prada, M. L., Espinet, E., & Jurkowska, R. Z. (2022) · Methods in molecular biology · doi:10.1007/978-1-0716-2756-3_19 · Cited by 8
Yoshioka, N. A., Faraco, T. A., Barud, H. D. S., Ribeiro, S. J. L., Cremona, M., Fragneaud, B., Maciel, I. O., Quirino, W. G., & Legnani, C. (2022) · Polymers · doi:10.3390/polym14245336 · Cited by 9
Immune related biomarkers for cancer metastasis to the brain
Chen, W., Chu, T. S. M., Xu, L., Zhao, C., Poon, W. S., Leung, G., & Kong, F. (2022) · Experimental Hematology and Oncology · doi:10.1186/s40164-022-00349-z · Cited by 9
Immune cell identifier and classifier (ImmunIC) for single cell transcriptomic readouts
Park, S. Y., Ter-Saakyan, S., Faraci, G., & Lee, H. Y. (2023) · Scientific Reports · doi:10.1038/s41598-023-39282-4 · Cited by 9
Effect of methanol fixation on single-cell RNA sequencing of the murine dentate gyrus
Sánchez-Carbonell, M., Peinado, P. J., Bayer, C., Hennings, J. C., Hofmann, Y., Schmidt, S., Witte, O. W., & Urbach, A. (2023) · Frontiers in Molecular Neuroscience · doi:10.3389/fnmol.2023.1223798 · Cited by 8
Melnik, M., Miyoshi, E., Ma, R., Corrada, M. M., Kawas, C. H., Bohannan, R. C., Caraway, C. A., Miller, C. A., Hinman, J. D., John, V., et al. (2024) · Journal of Neuroscience Methods · doi:10.1016/j.jneumeth.2024.110137 · Cited by 8
EDClust: an EM–MM hybrid method for cell clustering in multiple-subject single-cell RNA sequencing
Wei, X., Li, Z., Ji, H., & Wu, H. (2022) · Bioinformatics · doi:10.1093/bioinformatics/btac168 · Cited by 8
Glyoxal as an alternative fixative for single-cell RNA sequencing
Bageritz, J., Krausse, N., Yousefian, S., Leible, S., Valentini, E., & Boutros, M. (2023) · G3 Genes Genomes Genetics · doi:10.1093/g3journal/jkad160 · Cited by 8
Choudhury, S. N., Novotny, M. A., Aevermann, B. D., Lee, S., Mandava, A., Qian, Y., Scheuermann, R. H., & Freire, M. (2020) · doi:10.21203/rs.3.pex-953/v2 · Cited by 8
Dahl, N. A., Donson, A. M., Sanford, B. L., Wang, D., Walker, F. M., Gilani, A., Foreman, N. K., Tinkle, C. L., Baker, S. J., Hoffman, L. M., et al. (2021) · Journal of Neuropathology & Experimental Neurology · doi:10.1093/jnen/nlab016 · Cited by 7
Choudhury, S. N., Novotny, M. A., Aevermann, B. D., Lee, S., Mandava, A., Qian, Y., Scheuermann, R. H., & Freire, M. (2020) · doi:10.21203/rs.3.pex-953/v1 · Cited by 7
Single cell transcriptomics identifies conserved regulators of neurosecretory lineagesPreprint
Steger, J., Cole, A. G., Denner, A., Lebedeva, T. S., Genikhovich, G., Ries, A., Reischl, R., Taudes, E., Lassnig, M., & Technau, U. (2022) · bioRxiv (Cold Spring Harbor Laboratory) · doi:10.1101/2022.05.11.491463 · Cited by 7
Pennitz, P., Goekeri, C., Trimpert, J., Wyler, E., Ebenig, A., Weissfuss, C., Mühlebach, M. D., Witzenrath, M., & Nouailles, G. (2022) · STAR Protocols · doi:10.1016/j.xpro.2022.101957 · Cited by 6
Verrillo, L., Mangano, E., Drongitis, D., Ivan Merelli, A., Pischedda, F., Piccoli, G., Consolandi, C., Bordoni, R., & Miano, M. G. (2020) · Journal of Neuroscience Methods · doi:10.1016/j.jneumeth.2020.108960 · Cited by 6
Makar, A. N., Holkham, J., Lilla, S., Wilkinson, S., & von Kriegsheim, A. (2025) · Journal of Proteome Research · doi:10.1021/acs.jproteome.5c00268 · Cited by 5
Das, D., McGrath, J. S., Moore, J. H., Gardner, J. P., & Blom, D. (2025) · Biosensors · doi:10.3390/bios15070409 · Cited by 5
Heuston, E. F., Doumatey, A. P., Naz, F., Islam, S., Anderson, S. M., Kirby, M., Wincovitch, S., Dell’Orso, S., Rotimi, C. N., & Adeyemo, A. (2025) · Communications Biology · doi:10.1038/s42003-024-07445-2 · Cited by 5
Preservation and Storage of Cells for Therapy: Fundamental Aspects of Low Temperature Science
Buriak, I. A., Elliott, G. D., Fleck, R. A., Fuller, B. J., Glasmacher, B., Goltsev, А., Gryshkov, O., Guibert, E. E., Hagedorn, J., de Paz, L. J., et al. (2022) · Reference series in biomedical engineering · doi:10.1007/978-3-319-37076-7_67-1 · Cited by 5
Schulze, T. T., Neville, A. J., Chapman, R. C., & Davis, P. H. (2022) · STAR Protocols · doi:10.1016/j.xpro.2022.101402 · Cited by 4
Methodologies for Sample Multiplexing and Computational Deconvolution in Single‐Cell Sequencing
Gao, Y., Yin, W., Hu, W., & Chen, W. (2025) · Advanced Science · doi:10.1002/advs.202513396 · Cited by 4
Processing and Cryopreservation of Blood, Cancer Tissues, and Cancer Cells for Viable Biobanking
Chan, J. A.-W., & Vercauteren, S. (2022) · Methods in molecular biology · doi:10.1007/978-1-0716-2376-3_5 · Cited by 3
Vegting, Y., Jongejan, A., Neele, A. E., Claessen, N., Sela, G., Prange, K. H. M., Kers, J., Roelofs, J. J. T. H., van der Heijden, J. W., de Boer, O. J., et al. (2024) · bioRxiv (Cold Spring Harbor Laboratory) · doi:10.1101/2024.03.13.584866 · Cited by 2
Target sequence of single cells captured by a polymeric microfluidic device
Oyama, R., Mori, M., Matsumiya, H., Nemoto, Y., Nishizawa, N., Honda, Y., Kanayama, M., Taira, A., Kuwata, T., Takenaka, M., et al. (2025) · Scientific Reports · doi:10.1038/s41598-025-14826-y · Cited by 1
Rombach, A., Geissler, M., Liu, X., Qasem, L., Stange, L., Prinz, V., Jussen, D., Landolsi, S., Kokkaliaris, K. D., Medyouf, H., et al. (2025) · Molecular and Cellular Probes · doi:10.1016/j.mcp.2025.102055 · Cited by 1
Stochastic Analysis of the RT-PCR Process in Single-Cell RNA-Seq
Vázquez-Jiménez, A., & Reséndis-Antonio, O. (2021) · Mathematics · doi:10.3390/math9192515 · Cited by 1
Computational and Statistical Methods for Single-Cell RNA Sequencing Data
Wang, Z., & Yan, X. (2022) · Springer handbooks of computational statistics · doi:10.1007/978-3-662-65902-1_1
Kodali, M. C., Antone, J., Alsop, E. B., Jayakumar, R., Parikh, K., Sanchez-Molina, P., Ajami, B., Arnold, S. E., Jensen, K., Das, S., et al. (2023) · bioRxiv (Cold Spring Harbor Laboratory) · doi:10.1101/2023.08.10.552735
Chen, A., Diaz-Soto, M. P., Sanmamed, M. F., Adams, T. S., Schupp, J. C., Gupta, A., Britto, C. J., Sauler, M., Yan, X., Liu, Q. L., et al. (2021) · Figshare · doi:10.6084/m9.figshare.14490634
Single-Cell RNA-Sequencing of RVFV Infection
Wyler, E. (2024) · Methods in molecular biology · doi:10.1007/978-1-0716-3926-9_22
Cryopreservation for Long-Term Space Flight
Greenberger, J. S. (2024) · Springer eBooks · doi:10.1007/978-3-031-66300-0_13
Single Cell and Spatial Omics and Applications in Toxicology
Gallegos, D. A., Robarts, D. R., & Umbaugh, D. S. (2025) · Elsevier eBooks · doi:10.1016/b978-0-323-95488-4.00284-9
Buishand, F. O., Chan, P. Y. K., Xia, D., & Davison, L. J. (2025) · Veterinary oncology. · doi:10.1186/s44356-025-00025-4
Kryokonservierung für Langzeit-Weltraumflüge
Greenberger, J. S. (2025) · Springer eBooks · doi:10.1007/978-3-031-92467-5_13
Accurate Force Field for Dimer Interactions: From Acetone to Dimethylsulfoxide
Mancini, L., Lombardi, A., Pirani, F., Pacifici, L., Rosi, M., & Faginas‐Lago, N. (2025) · Lecture notes in computer science · doi:10.1007/978-3-031-97660-5_5
Multisite Assessment of Methods for Cell Preservation Upstream of Single-Cell RNA Sequencing
Kolling, F., Podnar, J. W., Wilkins, O. M., Fraser, C. J., MacDonald, M. L., Polson, S. W., Herbert, Z. T., Chittur, S. V., Hayden, A., Kuentzel, M. L., et al. (2026) · Journal of Biomolecular Techniques JBT · doi:10.7171/001c.162768 · Cited by 1
Oh, J., Arbour, N., Giuliani, F., Guenette, M. D., Kolind, S., Lynd, L., Marrie, R. A., Metz, L. M., Patten, S. B., Prat, A., et al. (2021) · Figshare · doi:10.6084/m9.figshare.16893237
Liu, Y., Zhao, J., Adams, T. S., Wang, N., Schupp, J. C., Wu, W., McDonough, J. E., Chupp, G. L., Kaminski, N., Wang, Z., et al. (2023) · Figshare · doi:10.6084/m9.figshare.24013075
Liu, Y., Zhao, J., Adams, T. S., Wang, N., Schupp, J. C., Wu, W., McDonough, J. E., Chupp, G. L., Kaminski, N., Wang, Z., et al. (2023) · Figshare · doi:10.6084/m9.figshare.24013078
Wu, S. Z., Roden, D. L., Al‐Eryani, G., Bartoniček, N., Harvey, K., Cazet, A., Chan, C.-L., Junankar, S. R., Hui, M. N., Millar, E. A., et al. (2021) · Figshare · doi:10.6084/m9.figshare.14570099
Metadata
- Authors
- Wohnhaas, C. T., Leparc, G. G., Fernandez-Albert, F., Kind, D., Gantner, F., Viollet, C., Hildebrandt, T., & Baum, P.
- Affiliations
- Boehringer Ingelheim (Germany) (DE)
- Corresponding author
- Baum, Patrick
- Venue
- Scientific Reports
- Published
- 2019-07-23
- Volume
- 9
- Issue
- 1
- Pages
- 10699-10699
- ISSN
- 2045-2322 (ISSN-L)
- PMC
- PMC6650608
- OpenAlex
- W2964240868
- Cited by
- 105
- References
- 31
- Citations by year
- 2026: 5 · 2025: 14 · 2024: 10 · 2023: 17 · 2022: 23 · 2021: 21 · 2020: 15
- FWCI
- 4.97
- Type
- journal article
- Language
- en
- Open access
- gold
- doi.org
- Locations
- Scientific Reports (publishedVersion, cc-by)
- Europe PMC (PubMed Central) (publishedVersion, cc-by)
- PubMed Central (publishedVersion, cc-by)
- PubMed (publishedVersion)
- KOPS (University of Konstanz) (submittedVersion, cc-by)
- DOAJ (DOAJ: Directory of Open Access Journals) (submittedVersion)
- Funders
- Universität Konstanz
- National Institutes of Health (HEK293)
- Topics
- Life Sciences › Biochemistry, Genetics and Molecular Biology › Molecular Biology › Single-cell and spatial transcriptomics
- Physical Sciences › Chemical Engineering › Fluid Flow and Transfer Processes › Innovative Microfluidic and Catalytic Techniques Innovation
- Life Sciences › Biochemistry, Genetics and Molecular Biology › Molecular Biology › Molecular Biology Techniques and Applications
- Keywords
- cell cryopreservation, dimethyl sulfoxide, cell preservation, methanol fixation, gene expression correlation, cell integrity, monocyte-derived macrophages, immune cells, cell lines
- MeSH terms
- Dimethyl Sulfoxide, Humans, Cryopreservation, Sequence Analysis, RNA, Gene Expression Profiling, Single-Cell Analysis
About these checks
Registry, retraction, Cites and statistics results are computed, not judged, with one exception: a printed reference that no index lists is read once by a model before it counts as a citation error. Claims are extracted by a model and kept only when their quote appears verbatim in the text; each cited source is then checked, with a model’s help, for whether it says what the claim relies on. Those verdicts can be wrong — read the claim’s quote and the cited source before relying on one.
Statistics and arithmetic are recomputed, not judged.
Confidence bands are shown only for fields calibrated on our annotated test set. None is calibrated yet, so no band is shown.
What counts as a claim ›How we measure confidence ›How we check this ›
Are you an author, or do you see a problem with this page? Request a review
