

The DOI matches its Crossref record; 9 of the 9 references it cites were found in a registry or an index.
Midlife Chronological and Endocrinological Transitions in Brain Metabolism: System Biology Basis for Increased Alzheimer’s Risk in Female Brain
Abstract
Decline in brain glucose metabolism is a hallmark of late-onset Alzheimer’s disease (LOAD). Comprehensive understanding of the dynamic metabolic aging process in brain can provide insights into windows of opportunities to promote healthy brain aging. Chronological and endocrinological aging are associated with brain glucose hypometabolism and mitochondrial adaptations in female brain. Using a rat model recapitulating fundamental features of the human menopausal transition, results of transcriptomic analysis revealed stage-specific shifts in bioenergetic systems of biology that were paralleled by bioenergetic dysregulation in midlife aging female brain. Transcriptomic profiles were predictive of outcomes from unbiased, discovery-based metabolomic and lipidomic analyses, which revealed a dynamic adaptation of the aging female brain from glucose centric to utilization of auxiliary fuel sources that included amino acids, fatty acids, lipids, and ketone bodies. Coupling between brain and peripheral metabolic systems was dynamic and shifted from uncoupled to coupled under metabolic stress. Collectively, these data provide a detailed profile across transcriptomic and metabolomic systems underlying bioenergetic function in brain and its relationship to peripheral metabolic responses. Mechanistically, these data provide insights into the complex dynamics of chronological and endocrinological bioenergetic aging in female brain. Translationally, these findings are predictive of initiation of the prodromal / preclinical phase of LOAD for women in midlife and highlight therapeutic windows of opportunity to reduce the risk of late-onset Alzheimer’s disease.
Overview
The claims and statistics of this paper haven’t been checked yet.
Run the check — free, no account needed. It reads the open-access text and checks the sources it cites.
Integrity signals
Registry
Cites
Statistics
Figures
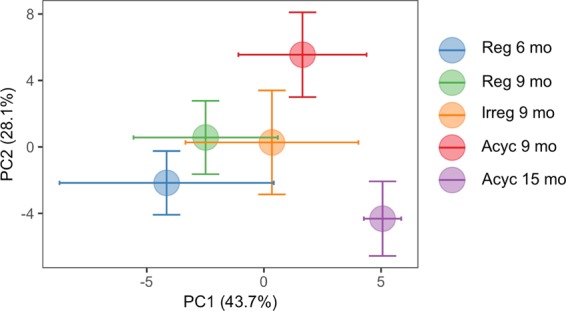
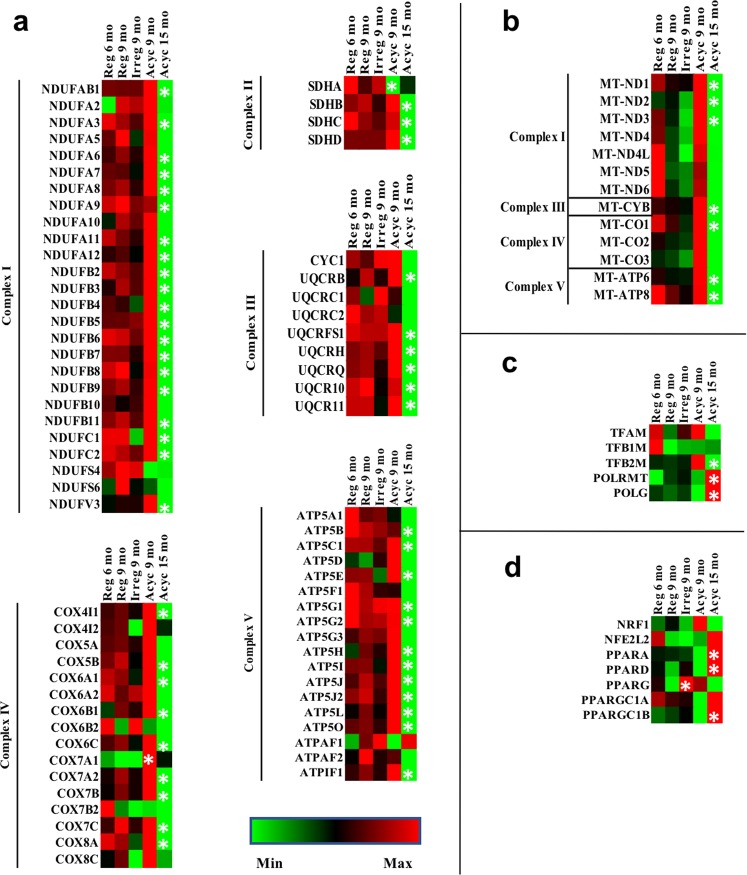
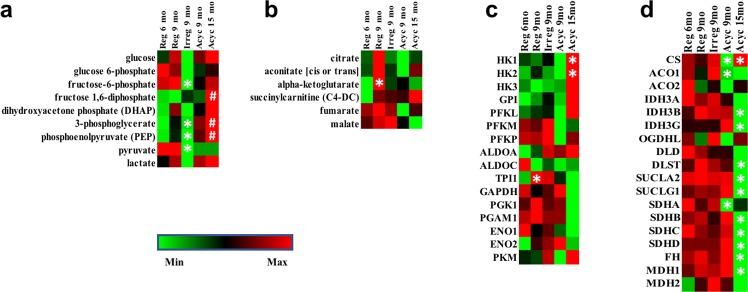
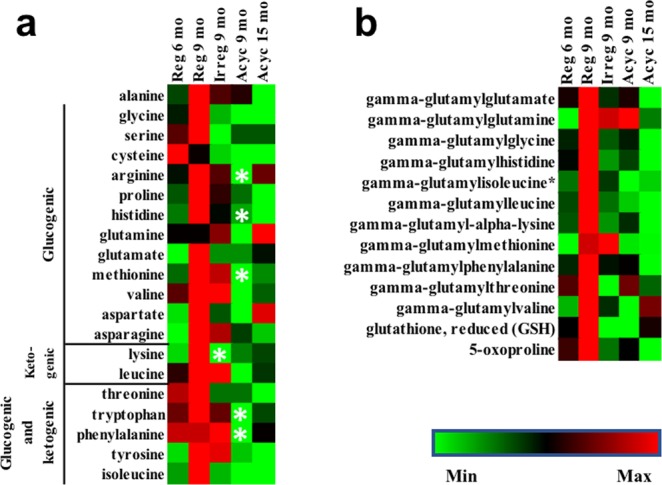
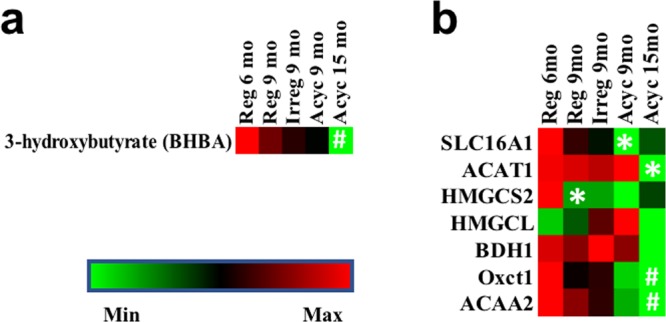
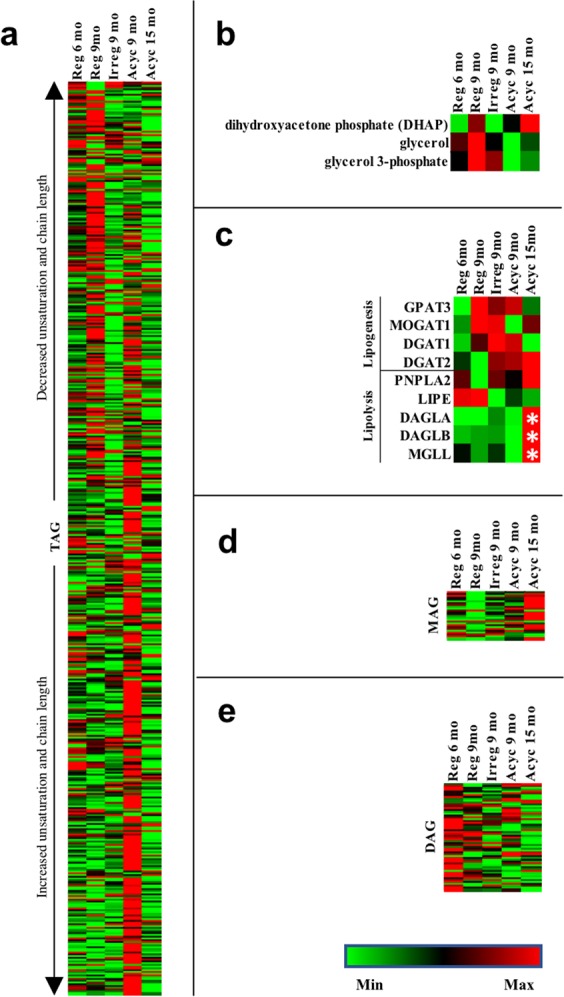
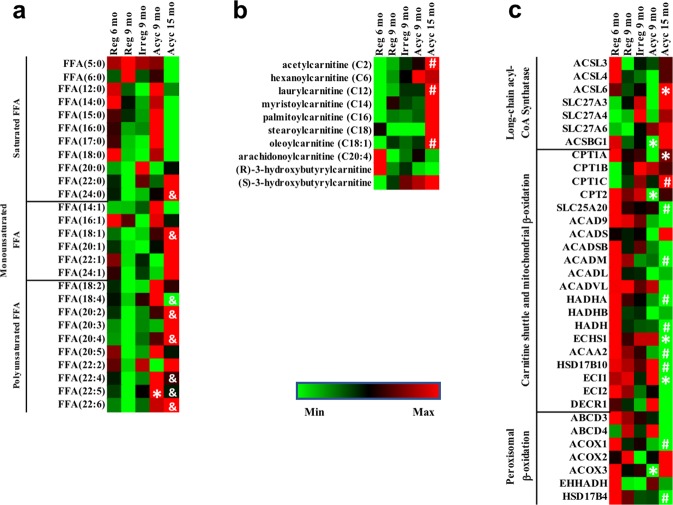
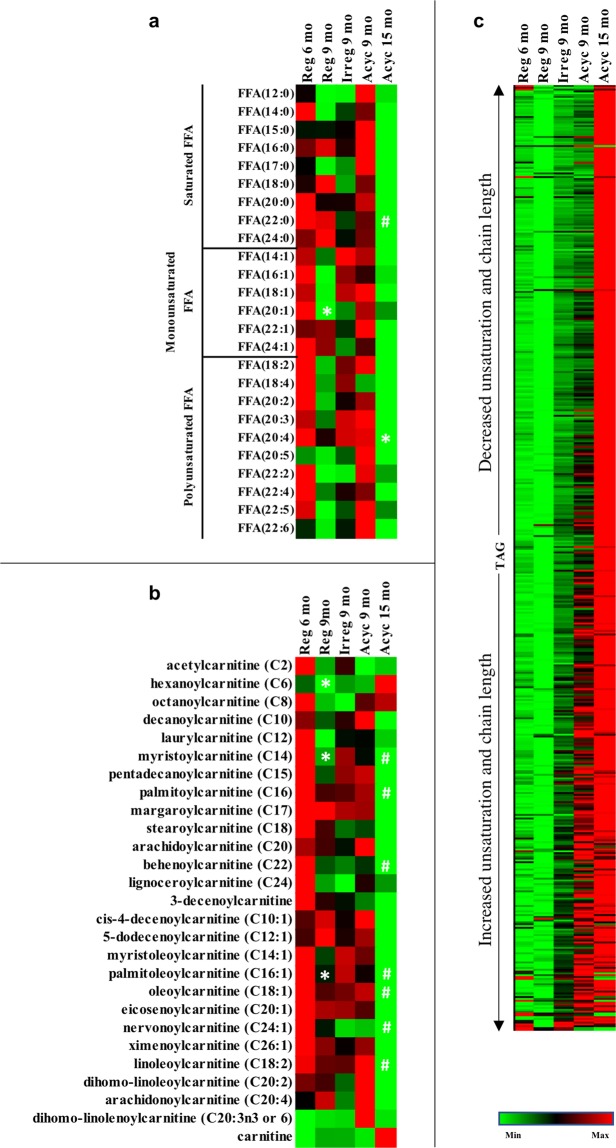
Verification
Claims the paper makes
The claims and statistics of this paper haven’t been checked yet.
Run the check — free, no account needed. It reads the open-access text and checks the sources it cites.
Claims other papers make about this one
Each is checked against this paper’s own text: does it say what the citing paper says it does?
The cited source says what the claim attributes to it.
In the citing paper
“However, availability of glucose becomes limited during various stress conditions, such as brain ageing34–39.”
From Interaction of sortilin with apolipoprotein E3 enables neurons to use long-chain fatty acids as alternative metabolic fuel (2025) · cites this paper as [37]
Self-check
Percentages, sums and reported differences re-computed from the paper’s own numbers.
The self-check needs the paper’s full text.
Citations
Cites
2019 Alzheimer’s disease facts and figures.
Alzheimer's Association (2019) · Alzheimer's & Dementia · doi:10.1016/j.jalz.2019.01.010 · Cited by 2,461
Brain energy metabolism: focus on Astrocyte-neuron metabolic cooperation
Bélanger, M., Allaman, I., & Magistretti, P. J. (2011) · Cell Metabolism · doi:10.1016/j.cmet.2011.08.016 · Cited by 2,313
Feldman, H. A., Longcope, C., Derby, C. A., Johannes, C. B., Araujo, A. B., Coviello, A. D., Bremner, W. J., & McKinlay, J. B. (2002) · The Journal of Clinical Endocrinology & Metabolism · doi:10.1210/jcem.87.2.8201 · Cited by 1,861
Apolipoprotein E Genotype and Sex Risk Factors for Alzheimer Disease: A Meta-analysis
Neu, S. C., Pa, J., Kukull, W., Beekly, D., Kuzma, A., Gangadharan, P., Wang, L.-S., Romero, K., Arneric, S. P., Redolfi, A., et al. (2017) · JAMA Neurology · doi:10.1001/jamaneurol.2017.2188 · Cited by 674
Blalock, E. M., Chen, K.-C., Sharrow, K., Herman, J. P., Porter, N. M., Foster, T. C., & Landfield, P. W. (2003) · The Journal of Neuroscience · doi:10.1523/jneurosci.23-09-03807.2003 · Cited by 570
13 C MRS studies of neuroenergetics and neurotransmitter cycling in humans
Rothman, D. L., De Feyter, H. M., de Graaf, R. A., Mason, G. F., & Behar, K. L. (2011) · NMR in Biomedicine · doi:10.1002/nbm.1772 · Cited by 290
Progesterone and Estrogen Regulate Oxidative Metabolism in Brain Mitochondria
Irwin, R. W., Yao, J., Hamilton, R. T., Cadenas, E., Brinton, R. D., & Nilsen, J. (2008) · Endocrinology · doi:10.1210/en.2007-1227 · Cited by 289
Self-citationResnick, S. M., Matsumoto, A. M., Stephens-Shields, A. J., Ellenberg, S. S., Gill, T. M., Shumaker, S. A., Pleasants, D. D., Barrett-Connor, E., Bhasin, S., Cauley, J. A., et al. (2017) · JAMA · doi:10.1001/jama.2016.21044 · Cited by 220
Why Is Androgen Replacement in Males Controversial?
Cunningham, G. R., & Toma, S. M. (2011) · The Journal of Clinical Endocrinology & Metabolism · doi:10.1210/jc.2010-0266 · Cited by 111
Research works printed but not linked: 79
- Bateman, R. J. et al. Clinical and biomarker changes in dominantly inherited Alzheimer’s disease. N Engl J Med 367, 795–804, https://doi.org/10.1056/NEJMoa1202753 (2012). · DOI · Paper page
- Reitz, C., Brayne, C. & Mayeux, R. Epidemiology of Alzheimer disease. Nature reviews. Neurology 7, 137–152, https://doi.org/10.1038/nrneurol.2011.2 (2011). · DOI · Paper page
- Brinton, R. D. Neurosteroids as regenerative agents in the brain: therapeutic implications. Nature reviews. Endocrinology 9, 241–250, https://doi.org/10.1038/nrendo.2013.31 (2013). · DOI
- De Santi, S. et al. Hippocampal formation glucose metabolism and volume losses in MCI and AD. Neurobiology of aging 22, 529–539 (2001). · DOI · Paper page
- Ishii, K. et al. Reduction of cerebellar glucose metabolism in advanced Alzheimer’s disease. Journal of nuclear medicine: official publication, Society of Nuclear Medicine 38, 925–928 (1997).
- Mosconi, L. et al. Hypometabolism and altered cerebrospinal fluid markers in normal apolipoprotein E E4 carriers with subjective memory complaints. Biological psychiatry 63, 609–618, https://doi.org/10.1016/j.biopsych.2007.05.030 (2008). · DOI · Paper page
- Mosconi, L. et al. Hippocampal hypometabolism predicts cognitive decline from normal aging. Neurobiology of aging 29, 676–692, https://doi.org/10.1016/j.neurobiolaging.2006.12.008 (2008). · DOI · Paper page
- Reiman, E. M. et al. Declining brain activity in cognitively normal apolipoprotein E epsilon 4 heterozygotes: A foundation for using positron emission tomography to efficiently test treatments to prevent Alzheimer’s disease. Proceedings of the National Academy of Sciences of the United States of America 98, 3334–3339, https://doi.org/10.1073/pnas.061509598 (2001). · DOI · Paper page
- Mosconi, L. et al. Declining brain glucose metabolism in normal individuals with a maternal history of Alzheimer disease. Neurology 72, 513–520, https://doi.org/10.1212/01.wnl.0000333247.51383.43 (2009). · DOI · Paper page
- Reiman, E. M. et al. Functional brain abnormalities in young adults at genetic risk for late-onset Alzheimer’s dementia. Proceedings of the National Academy of Sciences of the United States of America 101, 284–289, https://doi.org/10.1073/pnas.2635903100 (2004). · DOI · Paper page
- Chetelat, G. et al. Mild cognitive impairment: Can FDG-PET predict who is to rapidly convert to Alzheimer’s disease? Neurology 60, 1374–1377 (2003). · DOI
- Willette, A. A. et al. Association of Insulin Resistance With Cerebral Glucose Uptake in Late Middle-Aged Adults at Risk for Alzheimer Disease. JAMA neurology 72, 1013–1020, https://doi.org/10.1001/jamaneurol.2015.0613 (2015). · DOI · Paper page
- Small, G. W. et al. Cerebral metabolic and cognitive decline in persons at genetic risk for Alzheimer’s disease. Proceedings of the National Academy of Sciences of the United States of America 97, 6037–6042, https://doi.org/10.1073/pnas.090106797 (2000). · DOI · Paper page
- Hyder, F. & Rothman, D. L. Quantitative fMRI and oxidative neuroenergetics. NeuroImage 62, 985–994, https://doi.org/10.1016/j.neuroimage.2012.04.027 (2012). · DOI
- Lin, A. L. & Rothman, D. L. What have novel imaging techniques revealed about metabolism in the aging brain? Future neurology 9, 341–354, https://doi.org/10.2217/fnl.14.13 (2014). · DOI
- de Leon, M. J. et al. Computed tomography and positron emission transaxial tomography evaluations of normal aging and Alzheimer’s disease. Journal of cerebral blood flow and metabolism: official journal of the International Society of Cerebral Blood Flow and Metabolism 3, 391–394, https://doi.org/10.1038/jcbfm.1983.57 (1983). · DOI
- Hoyer, S. The young-adult and normally aged brain. Its blood flow and oxidative metabolism. A review–part I. Archives of gerontology and geriatrics 1, 101–116 (1982). · DOI
- Yin, F. et al. The perimenopausal aging transition in the female rat brain: decline in bioenergetic systems and synaptic plasticity. Neurobiology of aging 36, 2282–2295, https://doi.org/10.1016/j.neurobiolaging.2015.03.013 (2015). · DOI · Paper page
- Ding, F., Yao, J., Rettberg, J. R., Chen, S. & Brinton, R. D. Early Decline in Glucose Transport and Metabolism Precedes Shift to Ketogenic System in Female Aging and Alzheimer’s Mouse Brain: Implication for Bioenergetic Intervention. Plos One 8, e79977, https://doi.org/10.1371/journal.pone.0079977 (2013). · DOI · Paper page
- Yao, J. et al. Mitochondrial bioenergetic deficit precedes Alzheimer’s pathology in female mouse model of Alzheimer’s disease. Proceedings of the National Academy of Sciences of the United States of America 106, 14670–14675, https://doi.org/10.1073/pnas.0903563106 (2009). · DOI · Paper page
- Yao, J., Rettberg, J. R., Klosinski, L. P., Cadenas, E. & Brinton, R. D. Shift in brain metabolism in late onset Alzheimer’s disease: implications for biomarkers and therapeutic interventions. Molecular aspects of medicine 32, 247–257, https://doi.org/10.1016/j.mam.2011.10.005 (2011). · DOI
- Ding, F. et al. Ovariectomy induces a shift in fuel availability and metabolism in the hippocampus of the female transgenic model of familial Alzheimer’s. PloS One 8, e59825, https://doi.org/10.1371/journal.pone.0059825 (2013). · DOI
- Rettberg, J. R., Yao, J. & Brinton, R. D. Estrogen: a master regulator of bioenergetic systems in the brain and body. Front Neuroendocrinol 35, 8–30, https://doi.org/10.1016/j.yfrne.2013.08.001 (2014). · DOI · Paper page
- Yao, J. & Brinton, R. D. Estrogen regulation of mitochondrial bioenergetics: implications for prevention of Alzheimer’s disease. Advances in pharmacology (San Diego, Calif.) 64, 327–371, https://doi.org/10.1016/b978-0-12-394816-8.00010-6 (2012). · DOI
- Yao, J., Hamilton, R. T., Cadenas, E. & Brinton, R. D. Decline in mitochondrial bioenergetics and shift to ketogenic profile in brain during reproductive senescence. Biochimica et biophysica acta 1800, 1121–1126, https://doi.org/10.1016/j.bbagen.2010.06.002 (2010). · DOI
- Navarro, A. & Boveris, A. The mitochondrial energy transduction system and the aging process. American Journal of Physiology-Cell Physiology 292, C670–C686, https://doi.org/10.1152/ajpcell.00213.2006 (2007). · DOI · Paper page
- Boveris, A. & Navarro, A. Brain mitochondrial dysfunction in aging. IUBMB Life 60, 308–314, https://doi.org/10.1002/iub.46 (2008). · DOI · Paper page
- Maklashina, E. & Ackrell, B. A. C. Is defective electron transport at the hub of aging? Aging cell 3, 21–27, https://doi.org/10.1111/j.1474-9728.2003.00078.x (2003). · DOI
- Jones, T. T. & Brewer, G. J. Age-related deficiencies in complex I endogenous substrate availability and reserve capacity of complex IV in cortical neuron electron transport. Biochimica et Biophysica Acta (BBA) - Bioenergetics 1797, 167–176, https://doi.org/10.1016/j.bbabio.2009.09.009 (2010). · DOI
- Yao, J. et al. Ovarian hormone loss induces bioenergetic deficits and mitochondrial beta-amyloid. Neurobiology of aging 33, 1507–1521, https://doi.org/10.1016/j.neurobiolaging.2011.03.001 (2012). · DOI
- Klosinski, L. P. et al. White Matter Lipids as a Ketogenic Fuel Supply in Aging Female Brain: Implications for Alzheimer’s Disease. EBioMedicine 2, 1888–1904, https://doi.org/10.1016/j.ebiom.2015.11.002 (2015). · DOI
- Bowling, A. C. et al. Age-dependent impairment of mitochondrial function in primate brain. Journal of neurochemistry 60, 1964–1967 (1993). · DOI
- Ulfert, G., Schmidt, U. & Hoyer, S. Glucose and energy metabolism of rat cerebral cortex during aging. Experimental brain research Suppl 5, 102–111 (1982).
- Meier-Ruge, W., Iwangoff, P., Reichlmeier, K. & Sandoz, P. Neurochemical findings in the aging brain. Advances in biochemical psychopharmacology 23, 323–338 (1980).
- Mastroeni, D. Nuclear but not mitochondrial-encoded oxidative phosphorylation genes are altered in aging, mild cognitive impairment, and Alzheimer’s disease. 13, 510–519, https://doi.org/10.1016/j.jalz.2016.09.003 (2017). · DOI
- Zhu, X.-H., Lu, M., Lee, B.-Y., Ugurbil, K. & Chen, W. In vivo NAD assay reveals the intracellular NAD contents and redox state in healthy human brain and their age dependences. Proceedings of the National Academy of Sciences 112, 2876 (2015). · DOI · Paper page
- Ivanisevic, J. et al. Metabolic drift in the aging brain. Aging 8, 1000–1013, https://doi.org/10.18632/aging.100961 (2016). · DOI
- Mosconi, L. et al. Perimenopause and emergence of an Alzheimer’s bioenergetic phenotype in brain and periphery. Plos One 12, e0185926, https://doi.org/10.1371/journal.pone.0185926 (2017). · DOI
- Seshadri, S. et al. The lifetime risk of stroke: estimates from the Framingham Study. Stroke; a journal of cerebral circulation 37, 345–350, https://doi.org/10.1161/01.STR.0000199613.38911.b2 (2006). · DOI
- Paganini-Hill, A. & Henderson, V. W. Estrogen deficiency and risk of Alzheimer’s disease in women. American journal of epidemiology 140, 256–261 (1994). · DOI
- Brinton, R. D. The healthy cell bias of estrogen action: mitochondrial bioenergetics and neurological implications. Trends in neurosciences 31, 529–537, https://doi.org/10.1016/j.tins.2008.07.003 (2008). · DOI
- Pellerin, L. Food for thought: the importance of glucose and other energy substrates for sustaining brain function under varying levels of activity. Diabetes & metabolism 36(Suppl 3), S59–63, https://doi.org/10.1016/s1262-3636(10)70469-9 (2010). · DOI
- Lin, A. L., Zhang, W., Gao, X. & Watts, L. Caloric restriction increases ketone bodies metabolism and preserves blood flow in aging brain. Neurobiology of aging 36, 2296–2303, https://doi.org/10.1016/j.neurobiolaging.2015.03.012 (2015). · DOI · Paper page
- Guzman, M. & Blazquez, C. Ketone body synthesis in the brain: possible neuroprotective effects. Prostaglandins, leukotrienes, and essential fatty acids 70, 287–292, https://doi.org/10.1016/j.plefa.2003.05.001 (2004). · DOI
- Morris, A. A. Cerebral ketone body metabolism. Journal of inherited metabolic disease 28, 109–121, https://doi.org/10.1007/s10545-005-5518-0 (2005). · DOI
- Brinton, R. D., Yao, J., Yin, F., Mack, W. J. & Cadenas, E. Perimenopause as a neurological transition state. Nature reviews. Endocrinology, https://doi.org/10.1038/nrendo.2015.82 (2015). · DOI · Paper page
- Wang, Y. From Risk Mitochondrial and Metabolic Phenotype Towards a Precision Medicine Approach for Alzheimer’s Disease 27798664 thesis, University of Southern California, (2018).
- Shang, Y. et al. Evidence in support of chromosomal sex influencing plasma based metabolome vs APOE genotype influencing brain metabolome profile in humanized APOE male and female mice. Plos One 15, e0225392, https://doi.org/10.1371/journal.pone.0225392 (2020). · DOI
- Bray, N. L., Pimentel, H., Melsted, P. & Pachter, L. Near-optimal probabilistic RNA-seq quantification. Nature biotechnology 34, 525–527, https://doi.org/10.1038/nbt.3519 (2016). · DOI · Paper page
- Soneson, C., Love, M. I. & Robinson, M. D. Differential analyses for RNA-seq: transcript-level estimates improve gene-level inferences. F1000Research 4, 1521, https://doi.org/10.12688/f1000research.7563.2 (2015). · DOI · Paper page
- Love, M. I., Huber, W. & Anders, S. Moderated estimation of fold change and dispersion for RNA-seq data with DESeq. 2. Genome Biol 15, 550, https://doi.org/10.1186/s13059-014-0550-8 (2014). · DOI · Paper page
- Bacon, E. R. et al. Neuroendocrine aging precedes perimenopause and is regulated by DNA methylation. Neurobiology of aging 74, 213–224, https://doi.org/10.1016/j.neurobiolaging.2018.09.029 (2019). · DOI
- Villemagne, V. L. et al. Amyloid beta deposition, neurodegeneration, and cognitive decline in sporadic Alzheimer’s disease: a prospective cohort study. The Lancet. Neurology 12, 357–367, https://doi.org/10.1016/s1474-4422(13)70044-9 (2013). · DOI · Paper page
- Wilson, R. S., Leurgans, S. E., Boyle, P. A. & Bennett, D. A. Cognitive decline in prodromal Alzheimer disease and mild cognitive impairment. Arch Neurol 68, 351–356, https://doi.org/10.1001/archneurol.2011.31 (2011). · DOI · Paper page
- Barnes, J. et al. Alzheimer’s disease first symptoms are age dependent: Evidence from the NACC dataset. Alzheimer’s &. dementia: the journal of the Alzheimer’s Association 11, 1349–1357, https://doi.org/10.1016/j.jalz.2014.12.007 (2015). · DOI
- Gold, E. B. The timing of the age at which natural menopause occurs. Obstetrics and gynecology clinics of North America 38, 425–440, https://doi.org/10.1016/j.ogc.2011.05.002 (2011). · DOI
- Brookmeyer, R., Gray, S. & Kawas, C. Projections of Alzheimer’s disease in the United States and the public health impact of delaying disease onset. American journal of public health 88, 1337–1342 (1998). · DOI
- Brookmeyer, R. et al. National estimates of the prevalence of Alzheimer’s disease in the United States. Alzheimer’s &. dementia: the journal of the Alzheimer’s Association 7, 61–73, https://doi.org/10.1016/j.jalz.2010.11.007 (2011). · DOI
- Riedel, B. C., Thompson, P. M. & Brinton, R. D. Age, APOE and sex: Triad of risk of Alzheimer’s disease. The Journal of Steroid Biochemistry and Molecular Biology 160, 134–147, https://doi.org/10.1016/j.jsbmb.2016.03.012 (2016). · DOI · Paper page
- Mosconi, L. et al. Sex differences in Alzheimer risk: Brain imaging of endocrine vs chronologic aging. Neurology 89, 1382–1390, https://doi.org/10.1212/WNL.0000000000004425 (2017). · DOI · Paper page
- Zhang, J. et al. Acylcarnitines as markers of exercise-associated fuel partitioning, xenometabolism, and potential signals to muscle afferent neurons. Experimental physiology 102, 48–69, https://doi.org/10.1113/ep086019 (2017). · DOI
- Adams, S. H. et al. Plasma Acylcarnitine Profiles Suggest Incomplete Long-Chain Fatty Acid β-Oxidation and Altered Tricarboxylic Acid Cycle Activity in Type 2 Diabetic African-American Women. J Nutr 139, 1073–1081, https://doi.org/10.3945/jn.108.103754 (2009). · DOI · Paper page
- Nugent, S. et al. Brain glucose and acetoacetate metabolism: a comparison of young and older adults. Neurobiology of aging 35, 1386–1395, https://doi.org/10.1016/j.neurobiolaging.2013.11.027 (2014). · DOI
- Blalock, E. M. et al. Incipient Alzheimer’s disease: microarray correlation analyses reveal major transcriptional and tumor suppressor responses. Proceedings of the National Academy of Sciences of the United States of America 101, 2173–2178, https://doi.org/10.1073/pnas.0308512100 (2004). · DOI · Paper page
- Kakimoto, A. et al. Age-Related Sex-Specific Changes in Brain Metabolism and Morphology. Journal of nuclear medicine: official publication, Society of Nuclear Medicine 57, 221–225, https://doi.org/10.2967/jnumed.115.166439 (2016). · DOI
- Shen, X., Liu, H., Hu, Z., Hu, H. & Shi, P. The Relationship between Cerebral Glucose Metabolism and Age: Report of a Large Brain PET Data Set. Plos One 7, e51517, https://doi.org/10.1371/journal.pone.0051517 (2012). · DOI
- Salminen, E. K., Portin, R. I., Koskinen, A., Helenius, H. & Nurmi, M. Associations between serum testosterone fall and cognitive function in prostate cancer patients. Clinical cancer research: an official journal of the American Association for Cancer Research 10, 7575–7582, https://doi.org/10.1158/1078-0432.Ccr-04-0750 (2004). · DOI
- Almeida, O. P., Waterreus, A., Spry, N., Flicker, L. & Martins, R. N. One year follow-up study of the association between chemical castration, sex hormones, beta-amyloid, memory and depression in men. Psychoneuroendocrinology 29, 1071–1081, https://doi.org/10.1016/j.psyneuen.2003.11.002 (2004). · DOI
- Cherrier, M. M., Rose, A. L. & Higano, C. The effects of combined androgen blockade on cognitive function during the first cycle of intermittent androgen suppression in patients with prostate cancer. The Journal of urology 170, 1808–1811, https://doi.org/10.1097/01.ju.0000091640.59812.83 (2003). · DOI
- Beauchet, O. Testosterone and cognitive function: current clinical evidence of a relationship. European journal of endocrinology 155, 773–781, https://doi.org/10.1530/eje.1.02306 (2006). · DOI
- Grimm, A., Mensah-Nyagan, A. G. & Eckert, A. Alzheimer, mitochondria and gender. Neuroscience and biobehavioral reviews 67, 89–101, https://doi.org/10.1016/j.neubiorev.2016.04.012 (2016). · DOI
- Gaignard, P. et al. Role of Sex Hormones on Brain Mitochondrial Function, with Special Reference to Aging and Neurodegenerative Diseases. Frontiers in aging neuroscience 9, https://doi.org/10.3389/fnagi.2017.00406 (2017). · DOI
- Hogervorst, E. et al. Serum total testosterone is lower in men with Alzheimer’s disease. Neuro endocrinology letters 22, 163–168 (2001).
- Rosario, E. R., Chang, L., Stanczyk, F. Z. & Pike, C. J. Age-Related Testosterone Depletion and the Development of Alzheimer Disease. JAMA 292, 1431–1432, https://doi.org/10.1001/jama.292.12.1431-b (2004). · DOI
- Moffat, S. D. et al. Free testosterone and risk for Alzheimer disease in older men. Neurology 62, 188, https://doi.org/10.1212/WNL.62.2.188 (2004). · DOI
- Schönfeld, P. & Reiser, G. Why does brain metabolism not favor burning of fatty acids to provide energy? - Reflections on disadvantages of the use of free fatty acids as fuel for brain. Journal of Cerebral Blood Flow & Metabolism 33, 1493–1499, https://doi.org/10.1038/jcbfm.2013.128 (2013). · DOI · Paper page
- Blazquez, C., Sanchez, C., Daza, A., Galve-Roperh, I. & Guzman, M. The stimulation of ketogenesis by cannabinoids in cultured astrocytes defines carnitine palmitoyltransferase I as a new ceramide-activated enzyme. Journal of neurochemistry 72, 1759–1768 (1999). · DOI
- Edmond, J., Higa, T. A., Korsak, R. A., Bergner, E. A. & Lee, W. N. Fatty acid transport and utilization for the developing brain. Journal of neurochemistry 70, 1227–1234 (1998). · DOI
- Edmond, J., Robbins, R. A., Bergstrom, J. D., Cole, R. A. & de Vellis, J. Capacity for substrate utilization in oxidative metabolism by neurons, astrocytes, and oligodendrocytes from developing brain in primary culture. Journal of neuroscience research 18, 551–561, https://doi.org/10.1002/jnr.490180407 (1987). · DOI
Cited by
Sorted by citations
Greda, A. K., Gomes, J. P., Schmidt-Krueger, V., Zurawska-Plaksej, E., Fritsche-Guenther, R., Rudolph, I.-M., Telugu, N. S., Cömert, C., Kirwan, J., Kunz, S., et al. (2025) · Nature Metabolism · doi:10.1038/s42255-025-01389-5 · Cited by 21
Metadata
- Authors
- Wang, Y., Shang, Y., Mishra, A., Bacon, E., Yin, F., & Brinton, R.
- Venue
- Scientific Reports
- Published
- 2020-05-22
- Volume
- 10
- Issue
- 1
- ISSN
- 2045-2322
- PMC
- PMC7244485
- Cited by
- 42
- References
- 9
- Language
- en
About these checks
Registry, retraction, Cites and statistics results are computed, not judged, with one exception: a printed reference that no index lists is read once by a model before it counts as a citation error. Claims are extracted by a model and kept only when their quote appears verbatim in the text; each cited source is then checked, with a model’s help, for whether it says what the claim relies on. Those verdicts can be wrong — read the claim’s quote and the cited source before relying on one.
Statistics and arithmetic are recomputed, not judged.
Confidence bands are shown only for fields calibrated on our annotated test set. None is calibrated yet, so no band is shown.
What counts as a claim ›How we measure confidence ›How we check this ›
Are you an author, or do you see a problem with this page? Request a review
