

The DOI matches its Crossref record; 107 of the 107 references it cites were found in a registry or an index.
Context-aware experience sampling reveals the scale of variation in affective experience
Open accessAbstract
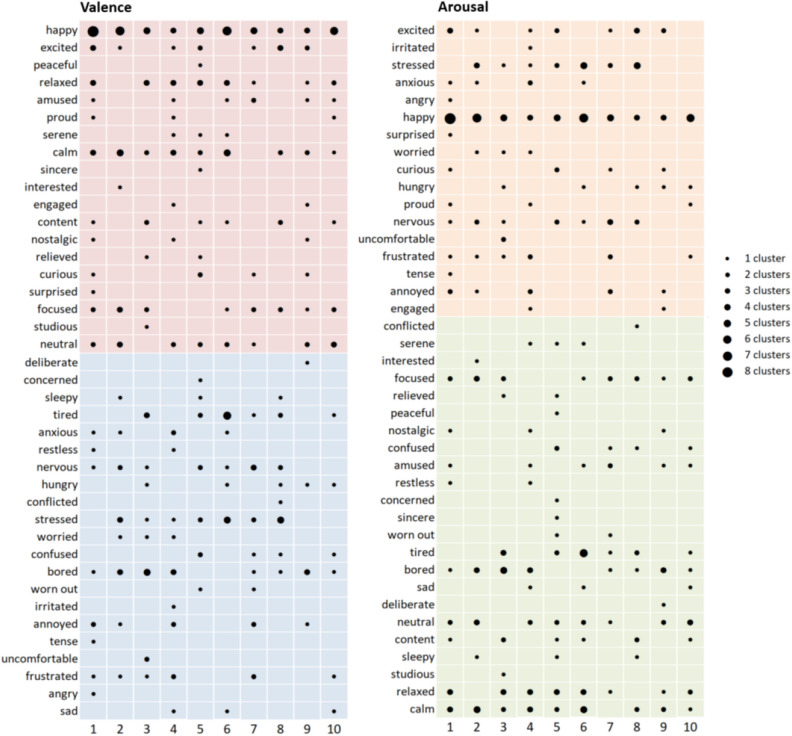
Emotion research typically searches for consistency and specificity in physiological activity across instances of an emotion category, such as anger or fear, yet studies to date have observed more variation than expected. In the present study, we adopt an alternative approach, searching inductively for structure within variation, both within and across participants. Following a novel, physiologically-triggered experience sampling procedure, participants’ self-reports and peripheral physiological activity were recorded when substantial changes in cardiac activity occurred in the absence of movement. Unsupervised clustering analyses revealed variability in the number and nature of patterns of physiological activity that recurred within individuals, as well as in the affect ratings and emotion labels associated with each pattern. There were also broad patterns that recurred across individuals. These findings support a constructionist account of emotion which, drawing on Darwin, proposes that emotion categories are populations of variable instances tied to situation-specific needs.
Overview
The claims and statistics of this paper haven’t been checked yet.
Free: it reads the open-access text and checks the first 5 claims that cite a source we can check. Create a free account to check every claim.
Integrity signals
Registry
Cites
Statistics
Figures



Verification
Claims the paper makes
The claims and statistics of this paper haven’t been checked yet.
Free: it reads the open-access text and checks the first 5 claims that cite a source we can check. Create a free account to check every claim.
Claims other papers make about this one
Each is checked against this paper’s own text: does it say what the citing paper says it does?
The cited source says what the claim attributes to it.
In the citing paper
“The notion that discrete emotion categories can be reliably identified by specific behavioural patterns and/or physiological features has been seriously called into doubt by the marked variability within instances of the same category as well as similarities across categories.”
From A new science of emotion: implications for functional neurological disorder (2022) · cites this paper as [60]
Self-check
Percentages, sums and reported differences re-computed from the paper’s own numbers.
The self-check needs the paper’s full text.
Citations
Cites
Scikit-learn: Machine Learning in Python
Pedregosa, F., Varoquaux, G., Gramfort, A., Michel, V., Thirion, B., Grisel, O., Blondel, M., Müller, A., Nothman, J., Louppe, G., et al. (2012) · arXiv · doi:10.48550/arxiv.1201.0490 · Cited by 71,016
Book Review: Pattern Recognition and Machine Learning
Nasrabadi, N. M. (2007) · Journal of Electronic Imaging · doi:10.1117/1.2819119 · Cited by 22,066
Lakens, D. (2013) · Frontiers in Psychology · doi:10.3389/fpsyg.2013.00863 · Cited by 10,303
Pattern Recognition and Machine Learning
(2007) · Kybernetes · doi:10.1108/03684920710743466 · Cited by 8,265
Heart rate variability: origins, methods, and interpretive caveats
BERNTSON, G. G., THOMAS BIGGER, J., ECKBERG, D. L., GROSSMAN, P., KAUFMANN, P. G., MALIK, M., NAGARAJA, H. N., PORGES, S. W., SAUL, J. P., STONE, P. H., et al. (1997) · Psychophysiology · doi:10.1111/j.1469-8986.1997.tb02140.x · Cited by 3,962
Emotion knowledge: further exploration of a prototype approach
Shaver, P., Schwartz, J., Kirson, D., & O'Connor, C. (1987) · Journal of Personality and Social Psychology · doi:10.1037/0022-3514.52.6.1061 · Cited by 3,072
Autonomic nervous system activity distinguishes among emotions
Ekman, P., Levenson, R. W., & Friesen, W. V. (1983) · Science · doi:10.1126/science.6612338 · Cited by 2,692
Toward machine emotional intelligence: analysis of affective physiological state
Picard, R. W., Vyzas, E., & Healey, J. (2001) · IEEE Transactions on Pattern Analysis and Machine Intelligence · doi:10.1109/34.954607 · Cited by 2,334
The brain basis of emotion: a meta-analytic review
Lindquist, K. A., Wager, T. D., Kober, H., Bliss-Moreau, E., & Barrett, L. F. (2012) · Behavioral and Brain Sciences · doi:10.1017/s0140525x11000446 · Cited by 2,320
Self-citationNorms of valence, arousal, and dominance for 13,915 English lemmas
Warriner, A. B., Kuperman, V., & Brysbaert, M. (2013) · Behavior Research Methods · doi:10.3758/s13428-012-0314-x · Cited by 1,959
Research works printed but not linked: 5
- Scherer, K. R. On the nature and function of emotion: a component process approach. In Approaches to Emotion (eds Scherer, K. R. & Ekman, P.) 293–317 (Lawrence Erlbaum Associates, New York, 1984).
- Darwin, C. On the Origin of Species. (Harvard University Press, Harvard, 1859/2001).
- Cohen, J. The effect size index d: statistical power analysis for the behavioral sciences (Routledge Academic, Abingdon-on-Thames, 1988).
- Le Mau, T. et al. Uncovering emotional structure in 604 expert portrayals of experience. (under review).
- Kleckner, I. R. & Quigley, K. S. Mapping the neurophysiological state of the body to affective experience. In The psychological construction of emotion (eds Barrett, L. F. & Russell, J. A.) 265–301 (Guilford Press, New York, 2015).
Cited by
A new science of emotion: implications for functional neurological disorder
Jungilligens, J., Paredes-Echeverri, S., Popkirov, S., Barrett, L. F., & Perez, D. L. (2022) · Brain · doi:10.1093/brain/awac204 · Cited by 164
Self-citationThe neurobiology of interoception and affect
Feldman, M. J., Bliss-Moreau, E., & Lindquist, K. A. (2024) · Trends in Cognitive Sciences · doi:10.1016/j.tics.2024.01.009 · Cited by 101
Self-citationAllostasis, action and affect in depression: Insights from the theory of constructed emotion
Shaffer, C., Westlin, C., Quigley, K. S., Whitfield-Gabrieli, S., & Barrett, L. F. (2022) · Annual Review of Clinical Psychology · doi:10.1146/annurev-clinpsy-081219-115627 · Cited by 94
Self-citationHoemann, K., Nielson, C., Yuen, A., Gurera, J. W., Quigley, K. S., & Barrett, L. F. (2021) · Psychological Bulletin · doi:10.1037/bul0000327 · Cited by 83
Self-citationHoemann, K., Khan, Z., Kamona, N., Dy, J., Barrett, L. F., & Quigley, K. S. (2021) · Psychophysiology · doi:10.1111/psyp.13818 · Cited by 40
Self-citation
Metadata
- Authors
- Hoemann, K., Khan, Z., Feldman, M. J., Nielson, C., Devlin, M., Dy, J., Barrett, L. F., Wormwood, J. B., & Quigley, K. S.
- Affiliations
- Northeastern University (US)
- University of North Carolina at Chapel Hill (US)
- University of New Hampshire (US)
- Corresponding author
- Hoemann, Katie
- ORCID
- Venue
- Scientific Reports
- Published
- 2020-07-27
- Volume
- 10
- Issue
- 1
- Pages
- 12459-12459
- ISSN
- 2045-2322 (ISSN-L)
- PMC
- PMC7385108
- OpenAlex
- W3045388177
- Cited by
- 124
- References
- 107
- Citations by year
- 2026: 16 · 2025: 37 · 2024: 22 · 2023: 17 · 2022: 19 · 2021: 11 · 2020: 2
- FWCI
- 11.81
- Type
- journal article
- Language
- en
- Update notices
- correction (2021-01-26)
- Open access
- gold
- doi.org
- Licence
- cc-by
- creativecommons.org/licenses/by/4.0 (tdm)
- creativecommons.org/licenses/by/4.0 (vor)
- Locations
- Scientific Reports (publishedVersion, cc-by)
- PubMed Central (publishedVersion, cc-by)
- PubMed (publishedVersion)
- Lirias (submittedVersion, cc-by)
- Funders
- Army Research Institute for the Behavioral and Social Sciences (W911NF-16-1-0191)
- National Heart, Lung, and Blood Institute (1 F31 HL140943-01)
- National Institute of Mental Health (R01MH113234)
- National Cancer Institute (1U01CA193632-01A1)
- Topics
- Physical Sciences › Computer Science › Artificial Intelligence › Emotion and Mood Recognition
- Social Sciences › Psychology › Experimental and Cognitive Psychology › Mental Health Research Topics
- Social Sciences › Psychology › Social Psychology › Emotions and Moral Behavior
- Keywords
- emotional experience, emotion variability, emotion categories, ecological momentary assessment, physiological function, cardiac activity, unsupervised clustering, self-report, emotion labels
- MeSH terms
- Adolescent, Adult, Awareness, Cardiovascular Physiological Phenomena, Emotions, Female, Humans, Life Change Events, Male, Young Adult
About these checks
Registry, retraction, Cites and statistics results are computed, not judged, with one exception: a printed reference that no index lists is read once by a model before it counts as a citation error. Claims are extracted by a model and kept only when their quote appears verbatim in the text; each cited source is then checked, with a model’s help, for whether it says what the claim relies on. Those verdicts can be wrong — read the claim’s quote and the cited source before relying on one.
Statistics and arithmetic are recomputed, not judged.
Confidence bands are shown only for fields calibrated on our annotated test set. None is calibrated yet, so no band is shown.
What counts as a claim ›How we measure confidence ›How we check this ›
Are you an author, or do you see a problem with this page? Request a review
How to cite
Cite CoChat for the checks on this page, and the paper for its own findings.
- This page
- CoChat. (2026). Citation check: Context-aware experience sampling reveals the scale of variation in affective experience. https://app.cochat.ai/papers/10.1038/s41598-020-69180-y
- The paper
- Hoemann, K., Khan, Z., Feldman, M. J., Nielson, C., Devlin, M., Dy, J., Barrett, L. F., Wormwood, J. B., & Quigley, K. S. (2020). Context-aware experience sampling reveals the scale of variation in affective experience. Scientific Reports. https://doi.org/10.1038/s41598-020-69180-y
Data sources
Bibliographic data: Semantic Scholar, OpenAlex, Crossref.
Contains information from the Semantic Scholar Academic Graph Datasets, made available under the ODC Attribution License (ODC-BY 1.0).
Semantic Scholar’s data is described in: Kinney, R., et al. (2023). The Semantic Scholar Open Data Platform. arXiv:2301.10140.
