

The DOI matches its Crossref record; 109 of the 109 references it cites were found in a registry or an index.
A multilayer multimodal detection and prediction model based on explainable artificial intelligence for Alzheimer’s disease
Open accessAbstract
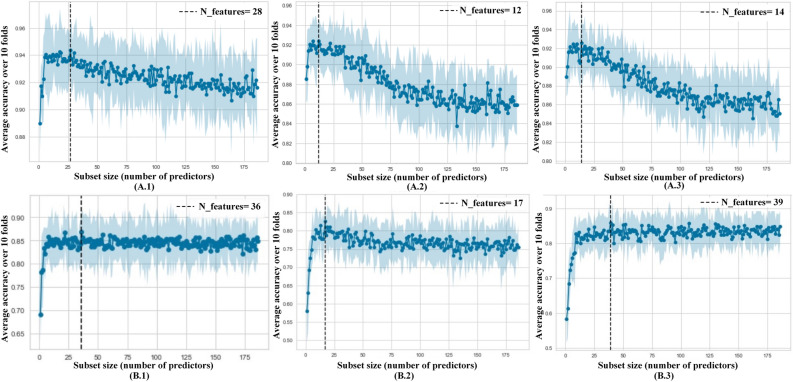
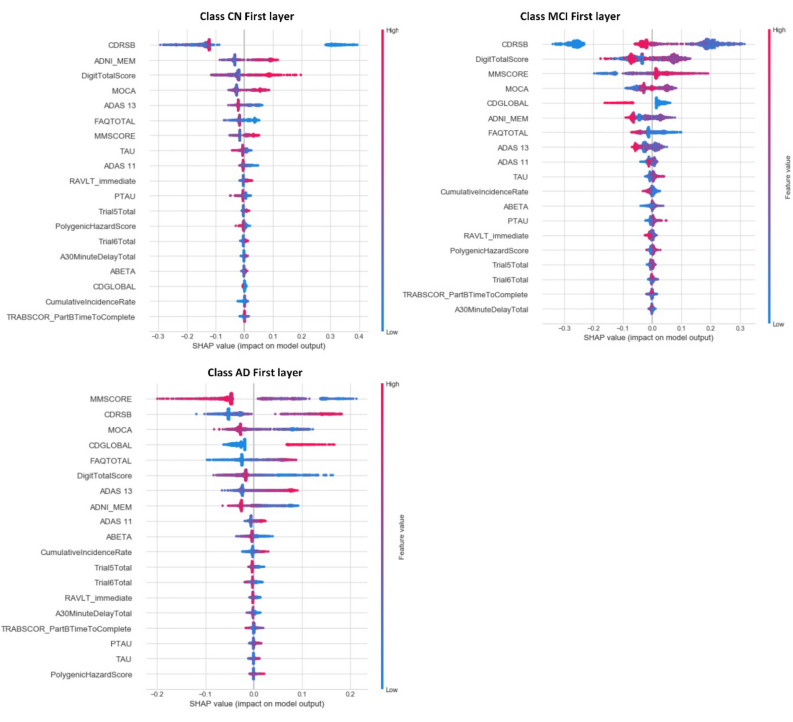
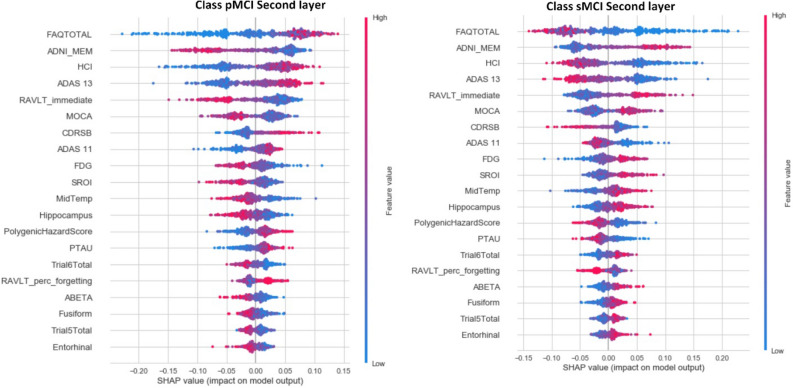
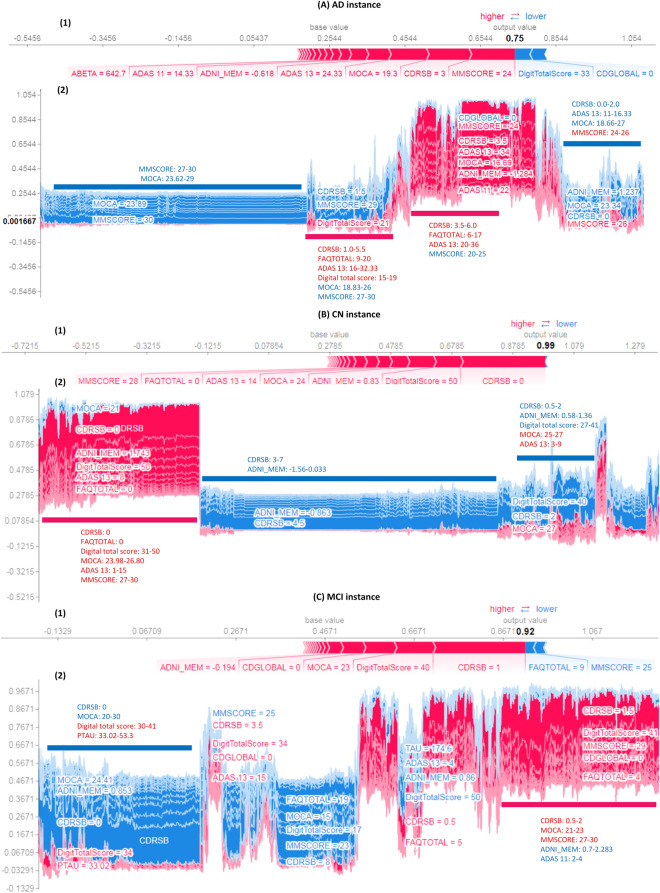
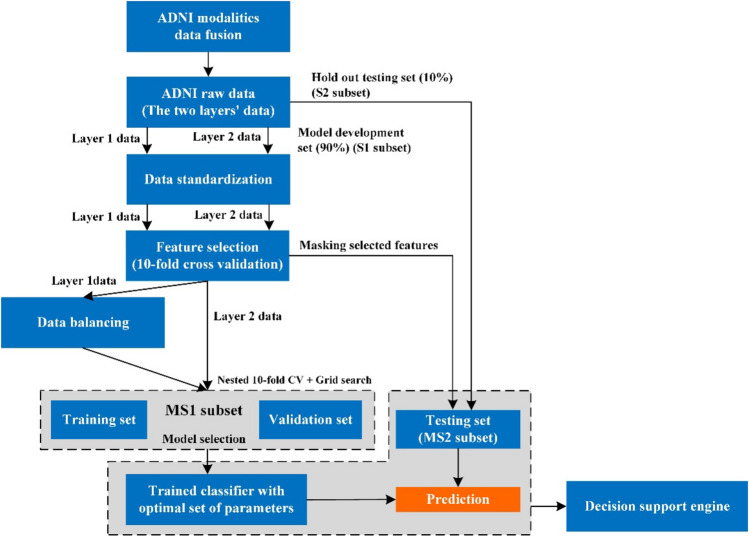
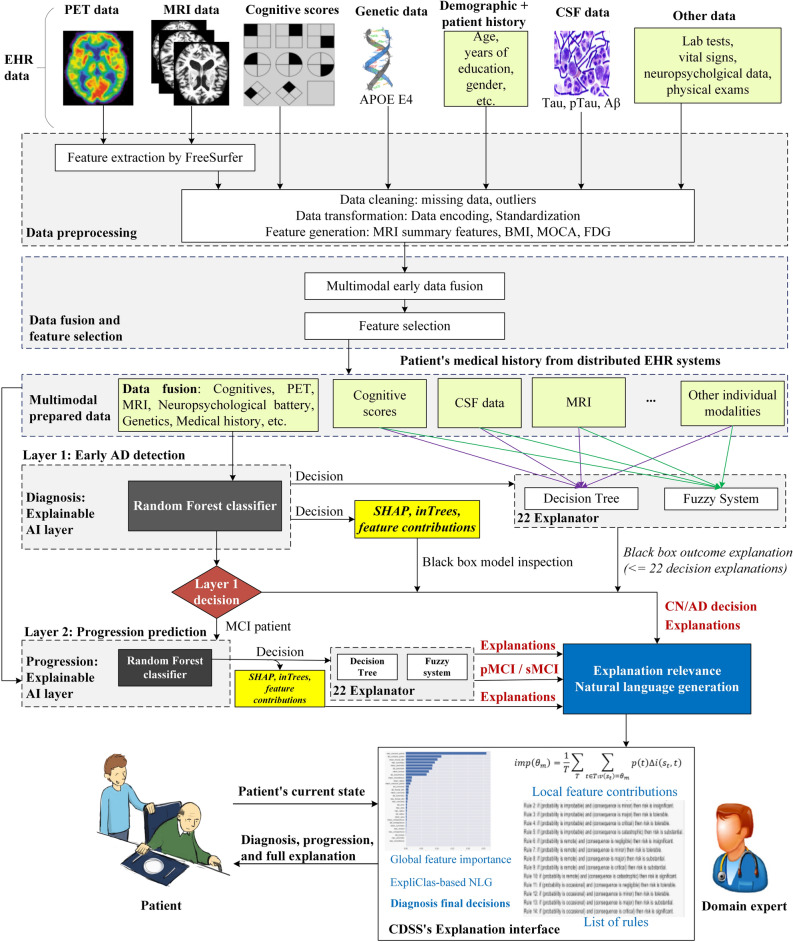
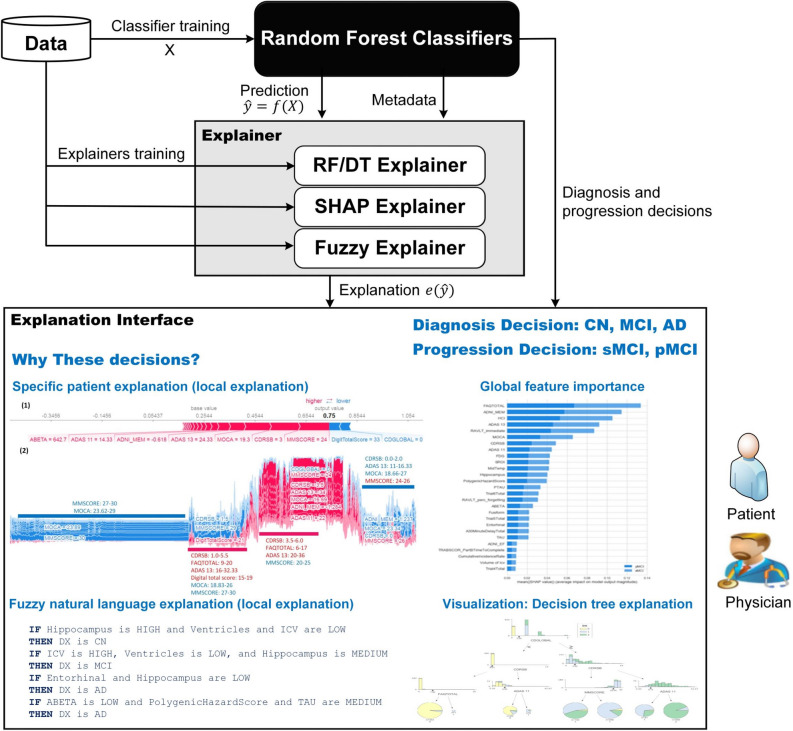
Alzheimer’s disease (AD) is the most common type of dementia. Its diagnosis and progression detection have been intensively studied. Nevertheless, research studies often have little effect on clinical practice mainly due to the following reasons: (1) Most studies depend mainly on a single modality, especially neuroimaging; (2) diagnosis and progression detection are usually studied separately as two independent problems; and (3) current studies concentrate mainly on optimizing the performance of complex machine learning models, while disregarding their explainability. As a result, physicians struggle to interpret these models, and feel it is hard to trust them. In this paper, we carefully develop an accurate and interpretable AD diagnosis and progression detection model. This model provides physicians with accurate decisions along with a set of explanations for every decision. Specifically, the model integrates 11 modalities of 1048 subjects from the Alzheimer’s Disease Neuroimaging Initiative (ADNI) real-world dataset: 294 cognitively normal, 254 stable mild cognitive impairment (MCI), 232 progressive MCI, and 268 AD. It is actually a two-layer model with random forest (RF) as classifier algorithm. In the first layer, the model carries out a multi-class classification for the early diagnosis of AD patients. In the second layer, the model applies binary classification to detect possible MCI-to-AD progression within three years from a baseline diagnosis. The performance of the model is optimized with key markers selected from a large set of biological and clinical measures. Regarding explainability, we provide, for each layer, global and instance-based explanations of the RF classifier by using the SHapley Additive exPlanations (SHAP) feature attribution framework. In addition, we implement 22 explainers based on decision trees and fuzzy rule-based systems to provide complementary justifications for every RF decision in each layer. Furthermore, these explanations are represented in natural language form to help physicians understand the predictions. The designed model achieves a cross-validation accuracy of 93.95% and an F1-score of 93.94% in the first layer, while it achieves a cross-validation accuracy of 87.08% and an F1-Score of 87.09% in the second layer. The resulting system is not only accurate, but also trustworthy, accountable, and medically applicable, thanks to the provided explanations which are broadly consistent with each other and with the AD medical literature. The proposed system can help to enhance the clinical understanding of AD diagnosis and progression processes by providing detailed insights into the effect of different modalities on the disease risk.
Overview
The claims and statistics of this paper haven’t been checked yet.
Run the check — free, no account needed. It reads the open-access text and checks the sources it cites.
Integrity signals
Registry
Cites
Statistics
Figures

Verification
Claims the paper makes
The claims and statistics of this paper haven’t been checked yet.
Run the check — free, no account needed. It reads the open-access text and checks the sources it cites.
Claims other papers make about this one
Each is checked against this paper’s own text: does it say what the citing paper says it does?
The source backs part of the claim, not all of it — or backs it for a different population, condition or comparison.
In the citing paper
“El-Sappagh et al. performed early and late fusion to create an interpretable Alzheimer’s diagnosis and progression detection model158. Their best performing model was one that implemented instance-based explanations of the random forest classifier by using the SHapley Additive exPlanations (SHAP) feature attribution. Despite using clinical, genomic, and imaging data, the most influential feature”
From Multimodal machine learning in precision health: A scoping review (2022) · cites this paper as [158]
Experimental — accuracy not yet measured
Self-check
Percentages, sums and reported differences re-computed from the paper’s own numbers.
The self-check needs the paper’s full text.
Citations
Cites
Breiman, L. (2001) · Machine Learning · doi:10.1023/a:1010933404324 · Cited by 133,538
SMOTE synthetic minority over-sampling technique
Chawla, N. V., Bowyer, K. W., Hall, L. O., & Kegelmeyer, W. P. (2002) · Journal of Artificial Intelligence Research · doi:10.1613/jair.953 · Cited by 32,865
McKhann, G., Drachman, D., Folstein, M., Katzman, R., Price, D., & Stadlan, E. M. (1984) · Neurology · doi:10.1212/wnl.34.7.939 · Cited by 27,915
A Unified Approach to Interpreting Model Predictions
Lundberg, S., & Lee, S.-I. (2017) · arXiv · doi:10.48550/arxiv.1705.07874 · Cited by 23,707 · cited 2×
“SHAP is based on the Shapely value concept from game theory 91,92 .”
Method(1992) · Cited by 23,431
Advances in neural information processing systems 7
Cios, K. J., & Shields, M. E. (1997) · Neurocomputing · doi:10.1016/s0925-2312(97)90018-7 · Cited by 22,093
"Why Should I Trust You?": Explaining the Predictions of Any Classifier
Ribeiro, M. T., Singh, S., & Guestrin, C. (2016) · Proceedings of the 22nd ACM SIGKDD International Conference on Knowledge Discovery and Data Mining · doi:10.1145/2939672.2939778 · Cited by 17,555 · cited 3×
“Fernandez-Delgado et al. 40 evaluated 179 classifiers using different UCI datasets, and concluded that RF outperforms other classifiers, including SVMs and neural networks.”
BackgroundMethodRor2 signaling regulates Golgi structure and transport through IFT20 for tumor invasiveness
Nishita, M., Park, S.-Y., Nishio, T., Kamizaki, K., Wang, Z., Tamada, K., Takumi, T., Hashimoto, R., Otani, H., Pazour, G. J., et al. (2017) · Scientific Reports · doi:10.1038/s41598-016-0028-x · Cited by 15,947
Desikan, R. S., Ségonne, F., Fischl, B., Quinn, B. T., Dickerson, B. C., Blacker, D., Buckner, R. L., Dale, A. M., Maguire, R. P., Hyman, B. T., et al. (2006) · NeuroImage · doi:10.1016/j.neuroimage.2006.01.021 · Cited by 13,324
A Study of Cross-Validation and Bootstrap for Accuracy Estimation and Model Selection
Kohavi, R. (1995) · Zenodo · doi:10.5281/zenodo.19712698 · Cited by 10,909
Research works printed but not linked: 2
- Fernandez-Delgado, M., Cernadas, E., Barro, S. & Amorim, D. Do we need hundreds of classifiers to solve real world classification problems. J. Mach. Learn. Res. 15, 3133–3181 (2014).
- Elisseeff, A. & Pontil, M. Leave-one-out error and stability of learning algorithms with applications. In NATO science series sub series iii computer and systems sciences 111–130 (ISO Press, 2003).
Cited by
Sorted by citations
Items 101–200 of 363
AD-Diff: enhancing Alzheimer's disease prediction accuracy through multimodal fusion
Han, L. (2025) · Frontiers in Computational Neuroscience · doi:10.3389/fncom.2025.1484540 · Cited by 28
RetractedHernández, M., Ramon-Julvez, U., Viladés, E., Ciordía, B. C., Mayordomo, E., & García‐Martín, E. (2023) · PLoS ONE · doi:10.1371/journal.pone.0289495 · Cited by 26
“Medical experts usually do not trust ML decisions unless they come with comprehensive and easily understandable explanations [32].”
BackgroundMethodVermeulen, R. J., Andersson, V., Banken, J., Hannink, G., Govers, T. M., Rovers, M. M., & Rikkert, M. O. (2025) · Alzheimer s & Dementia · doi:10.1002/alz.70069 · Cited by 25
Agarwal, K., Choudhury, S., Tipirneni, S., Mukherjee, P., Ham, C., Tamang, S. R., Baker, M. C., Tang, S., Kocaman, V., Gevaert, O., et al. (2022) · Scientific Reports · doi:10.1038/s41598-022-13072-w · Cited by 26
Srikrishna, M., Ashton, N. J., Moscoso, A., Pereira, J. B., Heckemann, R. A., van Westen, D., Volpe, G., Simrén, J., Zettergren, A., Kern, S., et al. (2023) · Alzheimer s & Dementia · doi:10.1002/alz.13445 · Cited by 22
Lakhan, A. R., Mohammed, M. A., Ghani, M. K. A., Abdulkareem, K. H., Marhoon, H. A., Nedoma, J., Martínek, R., & Deveci, M. (2024) · Information Sciences · doi:10.1016/j.ins.2024.120833 · Cited by 22
A feature-aware multimodal framework with auto-fusion for Alzheimer’s disease diagnosis
Zhang, M., Cui, Q., Lü, Y., & Li, W. (2024) · Computers in Biology and Medicine · doi:10.1016/j.compbiomed.2024.108740 · Cited by 23
Saleh, H., El-Rashidy, N. M., Elaziz, M. A., Aseeri, A. O., & El–Sappagh, S. (2024) · International Journal of Data Science and Analytics · doi:10.1007/s41060-024-00514-z · Cited by 24
Self-citationAli, S. S. A., Memon, K., Yahya, N., & Khan, S. (2025) · Artificial Intelligence Review · doi:10.1007/s10462-025-11146-5 · Cited by 24
Explainable MRI-Based Ensemble Learnable Architecture for Alzheimer’s Disease Detection
Adeniran, O., Ojeme, B., Ajibola, T. E., Peter, O. O. E., Ajala, A. O., Rahman, M. M., & Khalifa, F. (2025) · Algorithms · doi:10.3390/a18030163 · Cited by 20
Li, F., & Xu, J. (2025) · IEEE Access · doi:10.1109/access.2025.3552039 · Cited by 24
“Although, these models have given restriction, involving high implementation and maintenance expenses, data incorporation complication, and potential data privacy issues [78].”
Mild Cognitive Impairment detection based on EEG and HRV data
Boudaya, A., Chaabene, S., Bouaziz, B., Hökelmann, A., & Chaâri, L. (2024) · Digital Signal Processing · doi:10.1016/j.dsp.2024.104399 · Cited by 20
Wang, F., Liang, Y., & Wang, Q. (2024) · Scientific Reports · doi:10.1038/s41598-024-80401-6 · Cited by 21
“Since most current research on AD diagnostic models primarily focuses on optimizing the performance of machine learning models, it is easy to overlook their interpretability 30 .”
Sevas, M. S., Sharmin, N., Santona, C. F. T., & Sagor, S. R. (2024) · Theoretical and Applied Climatology · doi:10.1007/s00704-024-04951-5 · Cited by 19
Multi-Modal Deep Learning Models for Alzheimer's Disease Prediction Using MRI and EHR
Prabhu, S. S., Berkebile, J. A., Rajagopalan, N., Yao, R., Shi, W., Giuste, F., Zhong, Y., Sun, J., & Wang, M. D. (2022) · IEEE International Conference on Bioinformatics and Bioengineering (BIBE) · doi:10.1109/bibe55377.2022.00044 · Cited by 18
“Specifically, [6] demonstrated that the most salient portions of the EHR data consist of the cognitive scores, neurophysiological battery tests, medical history, symptoms, and vital signs, all of which were utilized as inputs into the DAE used in this work.”
MethodTermine, A., Fabrizio, C., Caltagirone, C., Petrosini, L., & Initiative, O. B. O. T. F. L. D. N. (2022) · Life · doi:10.3390/life12070947 · Cited by 21
“Within this setting, the application of explainable AI methods is required to overcome the issue posed by black box models, in particular about physicians’ trust in CAD.”
Trustworthy AI Guidelines in Biomedical Decision-Making Applications: A Scoping Review
Mora‐Cantallops, M., García‐Barriocanal, E., & Sicilia, M. (2024) · Big Data and Cognitive Computing · doi:10.3390/bdcc8070073 · Cited by 24
“Other studies, such as [52], devote large sections to the explainability of every single layer in the model, a practice that results in a much deeper understanding of the model reasoning.”
BackgroundEnhancing Brain Disease Diagnosis with XAI: A Review of Recent Studies
Bibi, N., Courtney, J., & McGuinness, K. (2025) · ACM Transactions on Computing for Healthcare · doi:10.1145/3709152 · Cited by 17
“El-Sappagh et al. [20] introduced a two-layer ML model for the diagnosis and tracking of AD progression.”
Viswan, V., Shaffi, N., Malathy, E., Selvi, G. C., Kavitha, B. R., Abdesselam, A., Wang, S., Suganthan, P. N., Shezawi, I. A., & Mahmud, M. (2026) · Brain Informatics · doi:10.1186/s40708-025-00291-w · Cited by 17
“The visualization highlights the relative importance and directional influence of each feature on model output; image reproduced with permission from - [45] using stratified ten-fold cross-validation in the ADNI-1 and ADNI-GO/2 cohorts and tested in an independent set from the ADNI-3 cohort.”
InfluentialEhiabhi, J., & Wang, H. (2023) · BioMedInformatics · doi:10.3390/biomedinformatics3010014 · Cited by 21
Alzheimer’s Multiclassification Using Explainable AI Techniques
Jordan, K., Carole, K. S., Armand, T. P. T., Kim, H.-C., & Initiative, T. F. L. D. N. (2024) · Applied Sciences · doi:10.3390/app14188287 · Cited by 16
“The investigation by El-Sappagh, S. et al. [18] highlights the intuitive significance of cognitive scores, including CDRSB and MMSE, in effectively identifying patients with Alzheimer’s disease (AD), a consensus validated by domain experts.”
Paving the Roadmap for XAI and IML in Healthcare: Data-Driven Discoveries and the FIXAIH Framework
Alghamdi, S., Mehmood, R., Alqurashi, F. A., & Alzahrani, A. (2025) · IEEE Access · doi:10.1109/access.2025.3616353 · Cited by 22
“Various studies have used the ADNI database to develop interpretable models for detecting AD progression [178], [179].”
Real-Time Prediction for Neonatal Endotracheal Intubation Using Multimodal Transformer Network
Im, J.-E., Yoon, S.-A., Shin, Y. M., & Park, S. (2023) · IEEE Journal of Biomedical and Health Informatics · doi:10.1109/jbhi.2023.3267521 · Cited by 16
“ing (XGBoost) [38], [39], [40], SVM [36], [41], [42], MLP [36], [43], [44], [45] and LSTM [46], [47], [48], [49].”
Yu, X., Liu, J., Lu, Y., Funahashi, S., Murai, T., Wu, J., Li, Q., & Zhang, Z. (2024) · Scientific Reports · doi:10.1038/s41598-024-74508-z · Cited by 16
“This is because the proposed method extracts complementary information from multiple modalities and reduces the classification error, thus expanding the classification accuracy 52,53 .”
MethodEl–Sappagh, S., Abuhmed, T., Alouffi, B., Sahal, R., Abdelhade, N., & Saleh, H. (2021) · Computational Intelligence and Neuroscience · doi:10.1155/2021/8439655 · Cited by 16
“…AD progression. authors in Moradi et al. [11] used semisupervised learning to predict MCI-to-AD conversion between one to three years using MRI modality. authors in El-Sappagh et al. [18] used ensemble machine learning classifiers based on RF for the two layers, utilizing multimodal AD datasets.”
MethodSelf-citationRichter-Laskowska, M., Sobotnicka, E., & Bednorz, A. (2025) · Scientific Reports · doi:10.1038/s41598-025-90460-y · Cited by 16
“It is crucial to note the variability in AUC measures and the observed accuracy rates, as similar discrepancies in classifier performance have been reported in other studies 7,19,30 .”
InfluentialLesley, U., & Kuratomi, A. (2024) · Lecture notes in computer science · doi:10.1007/978-3-031-66535-6_32 · Cited by 15
Wu, F., Li, W., Lu, H., & Li, L. (2025) · Molecular & Cellular Proteomics · doi:10.1016/j.mcpro.2025.101003 · Cited by 16
Inamdar, A., Bugadannavar, P., Palled, M. S., Umarani, S., Salve, P. S., Gurupadayya, B., Patil, P. D., & Sharma, H. (2025) · Frontiers in Aging Neuroscience · doi:10.3389/fnagi.2025.1614962 · Cited by 21
Ensemble-of-classifiers-based approach for early Alzheimer’s Disease detection
Rajasree, R. S., & Rajakumari, S. B. (2023) · Multimedia Tools and Applications · doi:10.1007/s11042-023-16023-3 · Cited by 15
Extensive Review of Literature on Explainable AI (XAI) in Healthcare Applications
Mariappan, R. (2024) · Recent Advances in Computer Science and Communications · doi:10.2174/0126662558296699240314055348 · Cited by 18
Zarei, O., moghaddam, M. T., & Vastegani, S. M. (2025) · Brain Research Bulletin · doi:10.1016/j.brainresbull.2025.111667 · Cited by 21
Saleh, H., Amer, E., Abuhmed, T., Ali, A., Al‐Fuqaha, A., & El–Sappagh, S. (2023) · Scientific Reports · doi:10.1038/s41598-023-42796-6 · Cited by 15
Self-citationFinzel, B. (2025) · Pflügers Archiv - European Journal of Physiology · doi:10.1007/s00424-025-03067-7 · Cited by 17
Wang, F., Xu, C., Chen, W., Duan, S., Xu, S., Dai, J., & Wang, Q. (2021) · Journal of Alzheimer s Disease · doi:10.3233/jad-210540 · Cited by 12
“Inthemostrecentstudy[71],multi-modedata integrationwasusedtoestablishanADprediction model,andevenafter10-foldcross-validationthe ROC AUC of the machine learning model was still lower than that of our model.”
Explainable AI Framework for Software Defect Prediction
Geçer, B. G., & Tarhan, A. (2025) · Journal of Software Evolution and Process · doi:10.1002/smr.70018 · Cited by 21
AI in Neurology: Everything, Everywhere, All at Once Part 1: Principles and Practice
Rizzo, M., & Dawson, J. D. (2025) · Annals of Neurology · doi:10.1002/ana.27225 · Cited by 18
Liu, S., Zheng, Y., Li, H., Pan, M., Fang, Z., Liu, M., Qiao, Y., Pan, N., Jia, W., & Ge, X. (2023) · Neuroscience · doi:10.1016/j.neuroscience.2023.09.003 · Cited by 13
Zhu, X. W., Liu, S., Ji, C., Liu, J., & Huang, C. (2024) · Frontiers in Neurology · doi:10.3389/fneur.2024.1352423 · Cited by 12
Wang, B., Xie, R., Qi, W., Yao, J., Shi, Y., Lou, X., Dong, C., Zhu, X., Wang, B., He, D., et al. (2025) · BMJ Open · doi:10.1136/bmjopen-2024-092293 · Cited by 15
Prediction and detection of terminal diseases using Internet of Medical Things: A review
Otapo, A. T., Othmani, A., Khodabandelou, G., & Ming, Z. (2025) · Computers in Biology and Medicine · doi:10.1016/j.compbiomed.2025.109835 · Cited by 14
A Proactive Explainable Artificial Neural Network Model for the Early Diagnosis of Thyroid Cancer
Aljameel, S. S. (2022) · Computation · doi:10.3390/computation10100183 · Cited by 12
“[19] developed an EAI detection and prediction model for Alzheimer’s disease.”
BackgroundGu, Z., Ge, B., Wang, Y., Gong, Y., & Qi, M. (2025) · Frontiers in Aging Neuroscience · doi:10.3389/fnagi.2025.1609063 · Cited by 12
Development of a Systems Medicine Approach to Spinal Cord Injury
Guest, J. D., Kelly-Hedrick, M., Williamson, T. L., Park, C., Ali, D. M., Sivaganesan, A., Neal, C. J., Tator, C. H., & Fehlings, M. G. (2023) · Journal of Neurotrauma · doi:10.1089/neu.2023.0024 · Cited by 11
“Similar modeling has been used to predict Alzheimer’s disease progression.(253)”
MethodDolci, G., Cruciani, F., Rahaman, M. A., Abrol, A., Chen, J., Fu, Z., Galazzo, I. B., Menegaz, G., Calhoun, V. D., & Initiative, A. D. N. (2025) · Journal of Neural Engineering · doi:10.1088/1741-2552/ae087d · Cited by 18
FusionEXNet: an interpretable fused deep learning model for skin cancer detection
Gautam, Y., Gupta, P., Kumar, D., Kalra, B., Kumar, A., & Hemanth, D. J. (2024) · International Journal of Computers and Applications · doi:10.1080/1206212x.2024.2385923 · Cited by 11
“They integrated 11 modalities from the Alzheimer’s Disease Neuroimaging Initiative (ADNI) dataset, attaining a cross-validation accuracy of 93.95% for AD diagnosis and 87.08% for MCI-to-AD progression detection [27].”
InfluentialExplainable Machine Learning Models for Brain Diseases: Insights from a Systematic Review
Mallma, M. J. R., Zuloaga-Rotta, L., Borja-Rosales, R., Mallma, J. R. R., Vilca-Aguilar, M., Salas-Ojeda, M., & Mauricio, D. (2024) · Neurology International · doi:10.3390/neurolint16060098 · Cited by 15
Adarsh, V., & Gangadharan, G. R. (2024) · Journal of Neuroscience Methods · doi:10.1016/j.jneumeth.2024.110318 · Cited by 15
Dolci, G., Ellis, C. A., Cruciani, F., Brusini, L., Abrol, A., Galazzo, I. B., Menegaz, G., Calhoun, V. D., & Initiative, A. D. N. (2024) · Network Neuroscience · doi:10.1162/netn_a_00423 · Cited by 14
“To address this issue, eXplainable Artificial Intelligence (XAI) methods have been developed allowing to identify the contributions of input features to final predictions, potentially highlighting crucial information for AD ([23, 24, 25, 26]).”
MethodXAI-based Clinical Decision Support System: A Systematic Review
Kim, S., Kim, D., Kim, M., Ko, H., & Jeong, O. (2024) · doi:10.20944/preprints202406.0721.v1 · Cited by 72
Sasikala., S., Arunkumar, S., N, S. S., & S, D. S. S. (2024) · International Conference on Control, Automation and Robotics (ICCAR) · doi:10.1109/iccar61844.2024.10569414 · Cited by 10
“SHAP algorithm and fuzzy based algorithms are used further to improve the explainability of the developed model [22].”
MethodInterpretable extreme wind speed prediction with concept bottleneck models
Álvarez-Rodríguez, C., Parrado-Hernández, E., Pérez‐Aracil, J., Prieto-Godino, L., & Salcedo‐Sanz, S. (2024) · Renewable Energy · doi:10.1016/j.renene.2024.120935 · Cited by 10
Advancing Alzheimer's Therapy: Computational strategies and treatment innovations
Paul, J. K., Malik, A., Azmal, M., Gulzar, T., Afghan, M. T. R., Talukder, O. F., Shahzadi, S., & Ghosh, A. (2025) · IBRO Neuroscience Reports · doi:10.1016/j.ibneur.2025.02.002 · Cited by 10
Chen, X., Cui, B., Dongwei, G. U. I., Liu, Q., Liu, Y., & Jin, Q. (2025) · Ecological Indicators · doi:10.1016/j.ecolind.2025.113333 · Cited by 10
Alzheimer’s Disease Diagnosis Based on a Semantic Rule-Based Modeling and Reasoning Approach
Shoaip, N., Rezk, A., El–Sappagh, S., Abuhmed, T., Barakat, S., & Elmogy, M. M. (2021) · Computers, materials & continua/Computers, materials & continua (Print) · doi:10.32604/cmc.2021.019069 · Cited by 10
“In [31], a random forest-based interpretable AD detection and progression prediction model within three years from a baseline diagnosis was proposed.”
MethodSelf-citationSaeed, A., Waris, A., Fuwad, A., Iqbal, J., Khan, J., AlQahtani, D., Gilani, O., Shah, U. H., & Initiative, A. D. N. (2024) · PLoS ONE · doi:10.1371/journal.pone.0314725 · Cited by 9
Liu, X., Chen, W., Du, W., Li, P., & Wang, X. (2025) · Frontiers in Digital Health · doi:10.3389/fdgth.2025.1583490 · Cited by 11
Tang, D., Liang, F., Gu, X., Jin, Y., Hu, X., Fen, L., & Yang, Y. (2025) · Scientific Reports · doi:10.1038/s41598-025-11142-3 · Cited by 9
“Its capabilities include quantifying the overall contribution of each feature, illustrating their specific influence on individual predictions, examining feature interactions, and analyzing the combined effects of feature dependencies 26 .”
Predicting the Geopolymerization Process of Fly-Ash-Based Geopolymer Using Machine Learning
Chen, K., Cheng, Y., Yu, M., Liu, L., Wang, Y., & Zhang, J. (2022) · Buildings · doi:10.3390/buildings12111792 · Cited by 9
“The difference between the f(x) and the base value represents the feature contribution [39].”
BackgroundAn Interpretable PyCaret Approach for Alzheimer's Disease Prediction
P., A., & GUNASUNDARI, R. (2024) · International Journal of Computational and Experimental Science and Engineering · doi:10.22399/ijcesen.655 · Cited by 11
Layer-Wise Relevance Propagation for Smart-Grid Stability Prediction
Erdem, T., & Eken, S. (2022) · Communications in computer and information science · doi:10.1007/978-3-031-04112-9_24 · Cited by 9
Kleiman, M. J., Ariko, T., Galvin, J. E., & Initiative, T. A. D. N. (2022) · Journal of Alzheimer s Disease · doi:10.3233/jad-220891 · Cited by 8
“Previous studies have examined multi-layered prediction algorithms, either by first focusing on binary then ternary classification [39] or by first screening then determining progression risk [40]; however, to our knowledge none have approached multi-stage screening through a cost-sensitive lens.”
Human-Centered Explainable AI at the Edge for eHealth
Dutta, J., & Puthal, D. (2023) · IEEE International Conference on Edge Computing and Communications (EDGE) · doi:10.1109/edge60047.2023.00044 · Cited by 9
Khastehband, S., Dabbaghi, K. G., Khosravirad, Z., Jamalnia, S., GhorbaniNia, R., Mahmoudikohani, F., & Zakeri, H. (2023) · Galen Medical Journal · doi:10.31661/gmj.v12i.3061 · Cited by 9
Combining Nonlinear Features of EEG and MRI to Diagnose Alzheimer’s Disease
Rad, E. M., Azarnoosh, M., Ghoshuni, M., & Khalilzadeh, M. (2024) · Annals of Data Science · doi:10.1007/s40745-024-00533-4 · Cited by 8
“Deep learning methods and machine learning techniques can be two effective and accurate for methods in the early diagnosis of Alzheimer’s disease [5].”
Xiaolin, L. I. U., Pu, X., Lu, C., Zhang, H., Li, T., Grieneisen, M. L., Li, J., Ma, N., Yan, C., Zhan, Y., et al. (2024) · Journal of Cleaner Production · doi:10.1016/j.jclepro.2024.144287 · Cited by 10
Chaudhari, P. A., & Khot, S. S. (2025) · Biomedical Signal Processing and Control · doi:10.1016/j.bspc.2025.107968 · Cited by 8
Muñoz-Ordóñez, J. F., Cobos, C., Vidal-Rojas, J.-C., & Herrera, F. (2025) · International Journal of Intelligent Systems · doi:10.1155/int/4934696 · Cited by 12
Khan, A. H., Ali, D., Ahmed, S., Alhumam, A., Khan, M. F., & Siddiqui, S. Y. (2025) · Scientific Reports · doi:10.1038/s41598-025-19395-8 · Cited by 8
Multimodal AI for Alzheimer Disease Diagnosis: Systematic Review of Datasets, Models, and Modalities
Yu, Z., Mulholland, A. J., Huang, T., & Liu, Q. (2026) · Journal of Medical Internet Research · doi:10.2196/85414 · Cited by 12
Moradi, F., van den Berg, M., Mirjebreili, S. M., Kosten, L., Verhoye, M., Amiri, M., & Keliris, G. A. (2023) · iScience · doi:10.1016/j.isci.2023.107454 · Cited by 9
Cross‐Dataset Evaluation of Dementia Longitudinal Progression Prediction Models
Zhang, C., An, L., Wulan, N., Nguyen, K., Orbán, C., Chen, P., Chen, C., Zhou, J. H., Liu, K., Yeo, B. T. T., et al. (2025) · Human Brain Mapping · doi:10.1002/hbm.70280 · Cited by 9
“For example, a typical mild cognitive impairment (MCI) progression task is to predict whether an MCI patient will develop dementia within 3 years (Basaia et al. 2019; El-Sappagh et al. 2021; Ocasio and Duong 2021).”
Wang, X., Ezeana, C. F., Wang, L., Puppala, M., Huang, Y., He, Y., Yu, X., Yin, Z., Zhao, H., Lai, E. C., et al. (2022) · Alzheimer s & Dementia Translational Research & Clinical Interventions · doi:10.1002/trc2.12351 · Cited by 7
Jemimah, S., Shehhi, A. A., & Initiative, F. T. A. D. N. (2023) · BMC Medical Genomics · doi:10.1186/s12920-023-01675-9 · Cited by 8
“Moreover, several studies [15–18] have employed SHapley Additive exPlana-tions (SHAP) [19], to understand model prediction and derive insights into disease markers and pathology.”
ResultImproving clinical efficiency in screening for cognitive impairment due to Alzheimer's
Ren, Y., Shahbaba, B., & Stark, C. E. L. (2023) · Alzheimer s & Dementia Diagnosis Assessment & Disease Monitoring · doi:10.1002/dad2.12494 · Cited by 8
Explainable AI-based Alzheimer’s Prediction and Management Using Multimodal DataPreprint
Jahan, S., Taher, K. A., Kaiser, M. S., Mahmud, M., Rahman, M. S., Hosen, A. S. M. S., & Ra, I.-H. (2022) · Preprints.org · doi:10.20944/preprints202203.0214.v1 · Cited by 8
Abbasi, A. F., Naveed, S., Asim, M. N., Sajjad, M., Vollmer, S. J., & Dengel, A. (2025) · bioRxiv (Cold Spring Harbor Laboratory) · doi:10.1101/2025.08.28.672795 · Cited by 8
“In terms of ML and DL models, our review identifies the widespread use of classical ML algorithms namely, SVM [150, 191, 210, 221, 279, 294], RF [127, 137, 164, 208, 235, 236, 299, 306], LR [120, 123, 125, 221, 294] alongside an increasing adoption of NN-based models [122, 141, 145, 148, 189 ?”
The disagreement dilemma in explainable AI: can bias reduction bridge the gap
Bhardwaj, N., & Parashar, G. (2025) · International Journal of Systems Assurance Engineering and Management · doi:10.1007/s13198-025-02712-9 · Cited by 7
Oso, T. A., Ahmed, M. M., Okesanya, O. J., Adebayo, U. O., Obadeyi, K. B., Othman, Z. K., & Lucero‐Prisno, D. E. (2025) · Journal of Alzheimer s Disease · doi:10.1177/13872877251407700 · Cited by 9
Explainable AI in Disease Diagnosis
Bedi, P., Thukral, A., & Dhiman, S. (2024) · Computational intelligence methods and applications · doi:10.1007/978-981-97-3705-5_5 · Cited by 7
Kumar, S., Yu, S., Michelson, A. P., Kannampallil, T., & Payne, P. (2024) · JAMIA Open · doi:10.1093/jamiaopen/ooae087 · Cited by 10
“49,58,59 Recent research on AD progression only identified the important features for a prediction, providing a snapshot of model explanations at a fixed timepoint.”
BackgroundPrediction of Cognitive Test Scores from Variable Length Multimodal Data in Alzheimer’s Disease
Morar, U., Martin, H., M., R. P., Izquierdo, W., Zarafshan, E., Forouzannezhad, P., Unger, E., Cabrerizo, M., Curiel, R. E., Rosselli, M., et al. (2023) · Cognitive Computation · doi:10.1007/s12559-023-10169-w · Cited by 7
“The authors in study [34] took a different approach.”
Mersha, M. A., Lamb, K., Wood, J., Alshami, A. M., & Kalita, J. K. (2024) · SSRN Electronic Journal · doi:10.2139/ssrn.4715286 · Cited by 7
Fah, H., Bohn, L., Greiner, R., & Dixon, R. A. (2025) · Frontiers in Aging Neuroscience · doi:10.3389/fnagi.2025.1542514 · Cited by 7
Detecting label noise in longitudinal Alzheimer’s data with explainable artificial intelligence
Sorino, P., Lombardi, A., Lofù, D., Colafiglio, T., Ferrara, A., Narducci, F., Sciascio, E. D., & Noia, T. D. (2025) · Brain Informatics · doi:10.1186/s40708-025-00261-2 · Cited by 6
“El-Sappagh et al. [25] integrated XAI techniques into their predictive framework, utilizing SHAP, decision trees, and fuzzy rule-based systems to enhance interpretability.”
Hussain, S. S., Xu, D., Shah, P. M., Khan, H., & Zeb, A. (2025) · Computerized Medical Imaging and Graphics · doi:10.1016/j.compmedimag.2025.102638 · Cited by 8
Bibi, M., Ahmad, R., Rizwan, A., Khan, A. N., Khan, Q. W., & Kim, D.-H. (2026) · IEEE Access · doi:10.1109/access.2025.3650610 · Cited by 9
“Studies have shown that XAI can enhance decision-making processes, as evidenced by frameworks developed for breast cancer treatment and Alzheimer’s disease diagnosis that offer interpretable, actionable insights through clustering and rule-based systems [14], [15].”
Alzheimer’s disease prediction via an explainable CNN using genetic algorithm and SHAP values
Zahedipour, M., Abadeh, M. S., & Shojaei, S. (2026) · PLoS ONE · doi:10.1371/journal.pone.0337800 · Cited by 6
“Another study proposed a multilayer multimodal detection and prediction model using MRI, PET, and genetic data with RF classifiers, achieving accuracies of 94.4% for AD detection and 86.8% for progression prediction, enhanced by SHAP and Decision Trees for explainability [28].”
InfluentialDeep learning for multisource medical information processing
Gezimati, M., & Singh, G. K. (2024) · Elsevier eBooks · doi:10.1016/b978-0-44-313233-9.00009-6 · Cited by 6
Hasan, F., Muhtar, M. S., Wu, D., Chen, P.-Y., Hsu, M., Nguyen, P., Chen, T., & Chiu, H. (2024) · Journal of Stroke and Cerebrovascular Diseases · doi:10.1016/j.jstrokecerebrovasdis.2024.107826 · Cited by 6
Advancements in Neurodegenerative Disease Diagnosis and Prediction: A Machine Learning Approach
Modi, S. K., Singla, S., Modi, P., & Kaur, G. K. (2025) · Lecture notes in networks and systems · doi:10.1007/978-981-97-7190-5_18 · Cited by 6
Explainable AI and Its Applications in Healthcare
Sarkar, A. (2022) · Intelligent systems reference library · doi:10.1007/978-3-031-12807-3_6 · Cited by 6
Explainable Artificial Intelligence: Concepts and Current Progression
Kangra, K., & Singh, J. (2022) · Studies in computational intelligence · doi:10.1007/978-3-031-18292-1_1 · Cited by 7
Mustafa, Y., & Luo, T. (2024) · Lecture notes in computer science · doi:10.1007/978-981-97-2259-4_6 · Cited by 6
Explainable Artificial Intelligence in Endocrinological Medical Research
Webb‐Robertson, B. (2021) · The Journal of Clinical Endocrinology & Metabolism · doi:10.1210/clinem/dgab237 · Cited by 6
Atf, Z., & Lewis, P. R. (2025) · Disability and Rehabilitation Assistive Technology · doi:10.1080/17483107.2025.2507684 · Cited by 5
Computer-Aided Decision Support Systems of Alzheimer's Disease Diagnosis - A Systematic Review
Günaydın, T., & Varlı, S. (2025) · Current Medical Imaging Formerly Current Medical Imaging Reviews · doi:10.2174/0115734056359358250516101749 · Cited by 5
Zarei, S., Saffar, M., Shalbaf, R., Hassani‐Abharian, P., & Shalbaf, A. (2025) · Physical and Engineering Sciences in Medicine · doi:10.1007/s13246-025-01618-x · Cited by 8
Explainable AI in Health Care: Trust and Transparency in AI-Powered Medical Diagnosis
Mohammed, Z. K. (2025) · Artificial intelligence · doi:10.5772/intechopen.1011279 · Cited by 9
Rahman, M. M., Calhoun, V. D., & Plis, S. (2026) · Imaging Neuroscience · doi:10.1162/imag.a.1129 · Cited by 16
Metadata
- Authors
- El-Sappagh, S., Alonso, J. M., Islam, S. M. R., Sultan, A. M., & Kwak, K. S.
- Affiliations
- Sejong University (KR)
- Inha University (KR)
- Corresponding author
- Kwak, Kyung Sup
- Venue
- Scientific Reports
- Published
- 2021-01-29
- Volume
- 11
- Issue
- 1
- Pages
- 2660-2660
- ISSN
- 2045-2322 (ISSN-L)
- PMC
- PMC7846613
- OpenAlex
- W3125069671
- Cited by
- 363
- References
- 108
- Citations by year
- 2026: 62 · 2025: 96 · 2024: 80 · 2023: 58 · 2022: 56 · 2021: 11
- FWCI
- 36.77
- Type
- journal article
- Language
- en
- Open access
- gold
- doi.org
- Locations
- Scientific Reports (publishedVersion, cc-by)
- PubMed Central (publishedVersion, cc-by)
- PubMed (publishedVersion)
- Aberdeen University Research Archive (Aberdeen University) (submittedVersion)
- LA Referencia (Red Federada de Repositorios Institucionales de Publicaciones Científicas) (submittedVersion, cc-by)
- DOAJ (DOAJ: Directory of Open Access Journals) (submittedVersion, cc-by-sa)
- Hispana (submittedVersion, cc-by)
- Repositorio institucional da Universidade de Santiago de Compostela (University of Santiago de Compostela) (submittedVersion, other-oa)
- Greater South Information System
- Funders
- National Research Foundation of Korea-Grant funded by the Korean Government (NRF-2017R1A2B2012337)
- Topics
- Health Sciences › Medicine › Psychiatry and Mental health › Dementia and Cognitive Impairment Research
- Health Sciences › Health Professions › Health Information Management › Artificial Intelligence in Healthcare
- Physical Sciences › Computer Science › Artificial Intelligence › Explainable Artificial Intelligence (XAI)
- Keywords
- Alzheimer's disease, Alzheimer's disease diagnosis, multimodal fusion, explainable AI, SHAP feature attribution, random forest, fuzzy rule-based systems, natural language explanations, clinical decision support, Alzheimer's Disease Neuroimaging Initiative, biomarker selection, model interpretability
- MeSH terms
- Aged, Aged, 80 and over, Alzheimer Disease, Artificial Intelligence, Brain, Female, Follow-Up Studies, Humans, Magnetic Resonance Imaging, Male, Middle Aged, Models, Neurological, Databases, Factual, Neuroimaging
About these checks
Registry, retraction, Cites and statistics results are computed, not judged, with one exception: a printed reference that no index lists is read once by a model before it counts as a citation error. Claims are extracted by a model and kept only when their quote appears verbatim in the text; each cited source is then checked, with a model’s help, for whether it says what the claim relies on. Those verdicts can be wrong — read the claim’s quote and the cited source before relying on one.
Statistics and arithmetic are recomputed, not judged.
Confidence bands are shown only for fields calibrated on our annotated test set. None is calibrated yet, so no band is shown.
What counts as a claim ›How we measure confidence ›How we check this ›
Are you an author, or do you see a problem with this page? Request a review
