

The DOI matches its Crossref record; 9 of the 9 references it cites were found in a registry or an index.
Multiple Transcriptomic Analyses Explore Potential Synaptic Biomarker Rabphilin-3A for Alzheimer's Disease
Overview
The claims and statistics of this paper haven’t been checked yet.
Run the check — free, no account needed. It reads the open-access text and checks the sources it cites.
Integrity signals
Registry
Cites
Statistics
Figures
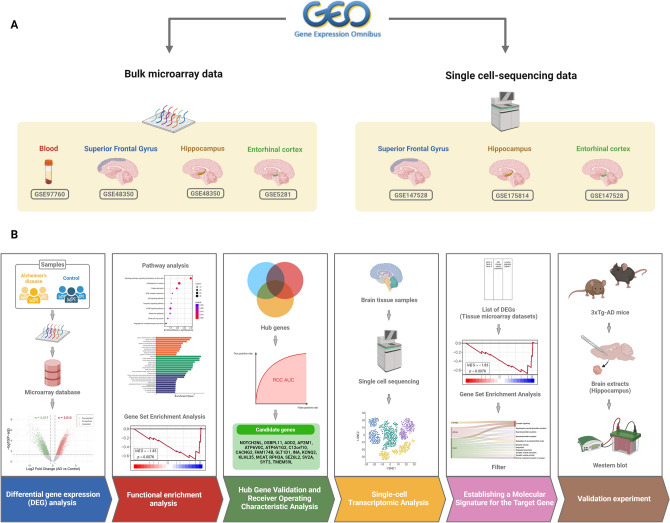
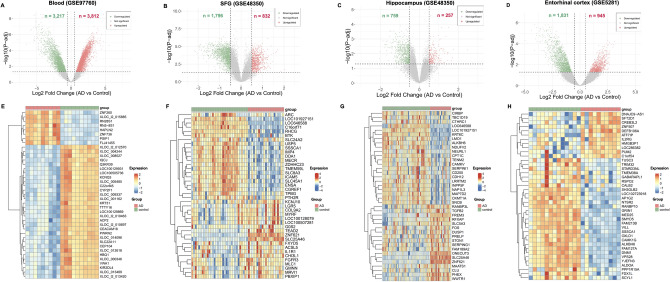
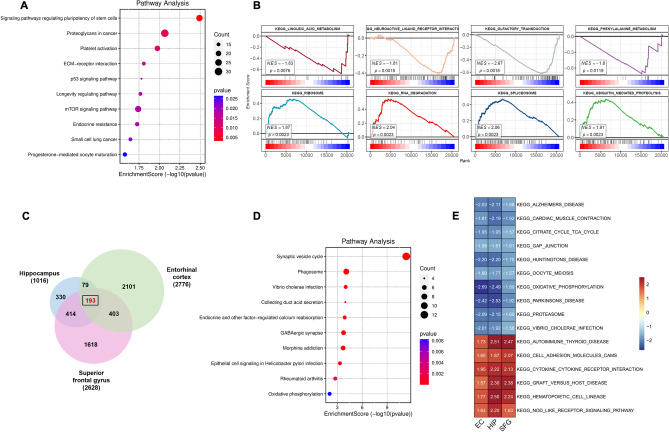
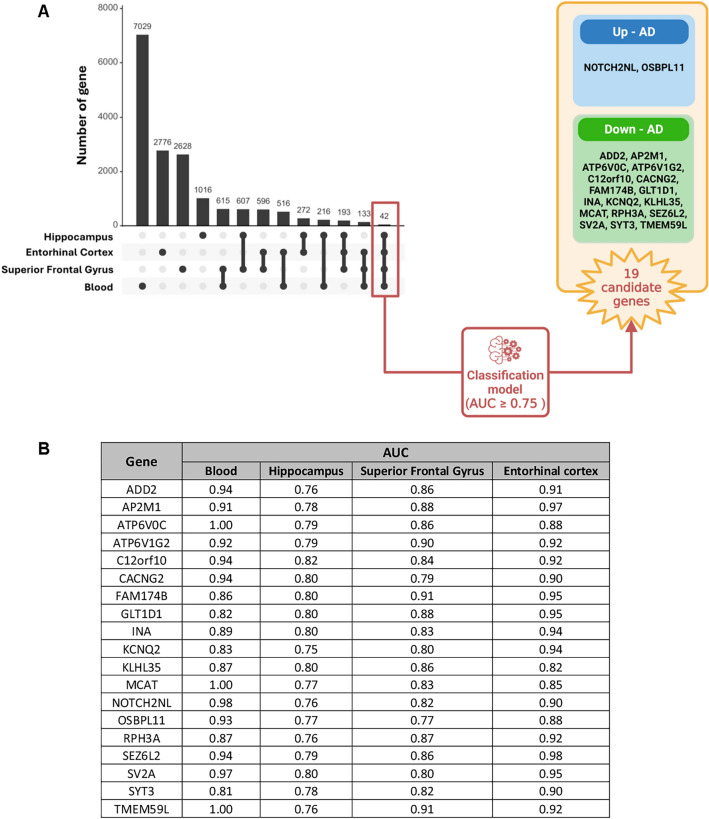
Verification
Claims the paper makes
The claims and statistics of this paper haven’t been checked yet.
Run the check — free, no account needed. It reads the open-access text and checks the sources it cites.
Claims other papers make about this one
Each is checked against this paper’s own text: does it say what the citing paper says it does?
The source backs part of the claim, not all of it — or backs it for a different population, condition or comparison.
In the citing paper
“Our findings, consistent with previous studies [72, 74–76], reinforce the connection between synaptic dysfunction and AD pathogenesis, suggesting that disruptions in synaptic integrity contribute to cortical thinning and cognitive decline.”
From Association of APOC1 with cortical atrophy during conversion to Alzheimer’s disease (2025) · cites this paper as [76]
Experimental — accuracy not yet measured
Self-check
Percentages, sums and reported differences re-computed from the paper’s own numbers.
The self-check needs the paper’s full text.
Citations
Cites
Subramanian, A., Tamayo, P., Mootha, V. K., Mukherjee, S., Ebert, B. L., Gillette, M. A., Paulovich, A., Pomeroy, S. L., Golub, T. R., Lander, E. S., et al. (2005) · Proceedings of the National Academy of Sciences · doi:10.1073/pnas.0506580102 · Cited by 53,625
2023 Alzheimer's disease facts and figures
(2023) · Alzheimer's & Dementia · doi:10.1002/alz.13016 · Cited by 3,212
Synergy between amyloid-β and tau in Alzheimer’s disease
Busche, M. A., & Hyman, B. T. (2020) · Nature Neuroscience · doi:10.1038/s41593-020-0687-6 · Cited by 1,242
Interaction between Aβ and Tau in the Pathogenesis of Alzheimer’s Disease
Zhang, H., Wei, W., Zhao, M., Ma, L., Jiang, X., Pei, H., Cao, Y., & Li, H. (2021) · International Journal of Biological Sciences · doi:10.7150/ijbs.57078 · Cited by 689 · cited 1×
“Indeed, Aβ accelerates tau phosphorylation and interferes with tau oligomerization 18 .”
BackgroundNot just amyloid: physiological functions of the amyloid precursor protein family
Müller, U. C., Deller, T., & Korte, M. (2017) · Nature Reviews Neuroscience · doi:10.1038/nrn.2017.29 · Cited by 634
Dejanovic, B., Huntley, M. A., De Mazière, A., Meilandt, W. J., Wu, T., Srinivasan, K., Jiang, Z., Gandham, V., Friedman, B. A., Ngu, H., et al. (2018) · Neuron · doi:10.1016/j.neuron.2018.10.014 · Cited by 517
Tau and neuroinflammation in Alzheimer’s disease: interplay mechanisms and clinical translation
Chen, Y., & Yu, Y. (2023) · Journal of Neuroinflammation · doi:10.1186/s12974-023-02853-3 · Cited by 516 · cited 1×
“On another hand, the interplay between Aβ and tau proteins in AD is complex and reciprocal, where Aβ accumulation induces tau hyperphosphorylation, exacerbating Aβ pathology and creating a feedback loop 45 .”
BackgroundCompilation of reported protein changes in the brain in Alzheimer's disease
Askenazi, M., Kavanagh, T., Pires, G., Ueberheide, B., Wisniewski, T., & Drummond, E. (2023) · Nature Communications · doi:10.1038/s41467-023-40208-x · Cited by 174
Zhou, Y., Xu, J., Hou, Y., Bekris, L., Leverenz, J. B., Pieper, A. A., Cummings, J., & Cheng, F. (2022) · Alzheimer's & Dementia: Translational Research & Clinical Interventions · doi:10.1002/trc2.12350 · Cited by 39
Research works printed but not linked: 55
- Wong, W. Economic burden of Alzheimer disease and managed care considerations. Am. J. Manag. Care 26, S177–S183. https://doi.org/10.37765/ajmc.2020.88482 (2020). · DOI
- Hampel, H. et al. The amyloid-β pathway in Alzheimer’s disease. Mol. Psychiatry 26, 5481–5503. https://doi.org/10.1038/s41380-021-01249-0 (2021). · DOI · Paper page
- Cho, Y., Bae, H.-G., Okun, E., Arumugam, T. V. & Jo, D.-G. Physiology and pharmacology of amyloid precursor protein. Pharmacol. Ther. 235, 108122. https://doi.org/10.1016/j.pharmthera.2022.108122 (2022). · DOI
- LaFerla, F. M., Green, K. N. & Oddo, S. Intracellular amyloid-β in Alzheimer’s disease. Nat. Rev. Neurosci. 8, 499–509. https://doi.org/10.1038/nrn2168 (2007). · DOI · Paper page
- Walsh, D. M. et al. Naturally secreted oligomers of amyloid beta protein potently inhibit hippocampal long-term potentiation in vivo. Nature 416, 535–539. https://doi.org/10.1038/416535a (2002). · DOI · Paper page
- Tsai, Y. F. et al. Ganglioside Hp-s1 analogue inhibits amyloidogenic toxicity in Alzheimer’s disease model cells. ACS Chem. Neurosci. 10, 528–536. https://doi.org/10.1021/acschemneuro.8b00406 (2019). · DOI
- Ting, L. L. et al. Expression of AHI1 rescues amyloidogenic pathology in Alzheimer’s disease model cells. Mol. Neurobiol. 56, 7572–7582. https://doi.org/10.1007/s12035-019-1587-1 (2019). · DOI
- Coronel, R. et al. Role of amyloid precursor protein (APP) and its derivatives in the biology and cell fate specification of neural stem cells. Mol. Neurobiol. 55, 7107–7117. https://doi.org/10.1007/s12035-018-0914-2 (2018). · DOI
- Gautam, V., D’Avanzo, C., Berezovska, O., Tanzi, R. E. & Kovacs, D. M. Synaptotagmins interact with APP and promote Aβ generation. Mol. Neurodegener. 10, 31. https://doi.org/10.1186/s13024-015-0028-5 (2015). · DOI
- Barbier, P. et al. Role of tau as a microtubule-associated protein: Structural and functional aspects. Front. Aging Neurosci. 11, 204. https://doi.org/10.3389/fnagi.2019.00204 (2019). · DOI
- Dehmelt, L. & Halpain, S. The MAP2/Tau family of microtubule-associated proteins. Genome Biol. 6, 204. https://doi.org/10.1186/gb-2004-6-1-204 (2005). · DOI · Paper page
- de Paula, V. J. R., Guimarães, F. M., Diniz, B. S. & Forlenza, O. V. Neurobiological pathways to Alzheimer’s disease: Amyloid-beta, TAU pro tein or both?. Dement. Neuropsychol. 3, 188–194. https://doi.org/10.1590/S1980-57642009DN30300003 (2009). · DOI
- Mamun, A. A., Uddin, M. S., Mathew, B. & Ashraf, G. M. Toxic tau: Structural origins of tau aggregation in Alzheimer’s disease. Neural Regen. Res. 15, 1417–1420. https://doi.org/10.4103/1673-5374.274329 (2020). · DOI
- Shafiei, S. S., Guerrero-Muñoz, M. J. & Castillo-Carranza, D. L. Tau oligomers: Cytotoxicity, propagation, and mitochondrial damage. Front. Aging Neurosci. 9, 83. https://doi.org/10.3389/fnagi.2017.00083 (2017). · DOI · Paper page
- Patow, G. et al. Whole-brain modeling of the differential influences of amyloid-beta and tau in Alzheimer’s disease. Alzheimer’s Res. Ther. 15, 210. https://doi.org/10.1186/s13195-023-01349-9 (2023). · DOI
- de Vries, L. E. et al. Gene-expression profiling of individuals resilient to Alzheimer’s disease reveals higher expression of genes related to metallothionein and mitochondrial processes and no changes in the unfolded protein response. Acta Neuropathol. Commun. 12, 68. https://doi.org/10.1186/s40478-024-01760-9 (2024). · DOI
- Aguzzoli Heberle, B. et al. Mapping medically relevant RNA isoform diversity in the aged human frontal cortex with deep long-read RNA-seq. Nat. Biotechnol. https://doi.org/10.1038/s41587-024-02245-9 (2024). · DOI
- Panitch, R. et al. Blood and brain transcriptome analysis reveals APOE genotype-mediated and immune-related pathways involved in Alzheimer disease. Alzheimer’s Res. Ther. 14, 30. https://doi.org/10.1186/s13195-022-00975-z (2022). · DOI
- Wang, M. et al. Guidelines for bioinformatics of single-cell sequencing data analysis in Alzheimer’s disease: Review, recommendation, implementation and application. Mol. Neurodegener. 17, 17. https://doi.org/10.1186/s13024-022-00517-z (2022). · DOI
- Beauchamp, A. et al. Whole-brain comparison of rodent and human brains using spatial transcriptomics. eLife 11, e79418. https://doi.org/10.7554/eLife.79418 (2022). · DOI
- Kanehisa, M. & Goto, S. KEGG: Kyoto encyclopedia of genes and genomes. Nucleic Acids Res. 28, 27–30. https://doi.org/10.1093/nar/28.1.27 (2000). · DOI · Paper page
- El-Baba, R. M. & Schury, M. P. Neuroanatomy, Frontal Cortex (StatPearls, 2020).
- Yang, A. et al. Associations of cortical iron accumulation with cognition and cerebral atrophy in Alzheimer’s disease. Quant. Imaging Med. Surg. 12, 4570 (2022). · DOI
- Yang, H. et al. Study of brain morphology change in Alzheimer’s disease and amnestic mild cognitive impairment compared with normal controls. Gen. Psychiatry 32, e100005 (2019). · DOI
- Igarashi, K. M. Entorhinal cortex dysfunction in Alzheimer’s disease. Trends Neurosci. 46, 124–136 (2023). · DOI
- Bottero, V., Powers, D., Yalamanchi, A., Quinn, J. P. & Potashkin, J. A. Key disease mechanisms linked to Alzheimer’s disease in the entorhinal cortex. Int. J. Mol. Sci. 22, 3915 (2021). · DOI
- Chen, Z. S. & Chan, H. Y. E. Transcriptional dysregulation in neurodegenerative diseases: Who tipped the balance of Yin Yang 1 in the brain?. Neural Regen. Res. 14, 1148–1151. https://doi.org/10.4103/1673-5374.251193 (2019). · DOI
- Salta, E. et al. Adult hippocampal neurogenesis in Alzheimer’s disease: A roadmap to clinical relevance. Cell Stem Cell 30, 120–136 (2023). · DOI
- Rao, Y. L. et al. Hippocampus and its involvement in Alzheimer’s disease: A review. 3 Biotech 12, 55 (2022). · DOI
- Li, C. et al. Synaptic targeting of rabphilin-3A, a synaptic vesicle Ca2+/phospholipid-binding protein, depends on rab3A/3C. Neuron 13, 885–898. https://doi.org/10.1016/0896-6273(94)90254-2 (1994). · DOI
- Ferrer-Orta, C. et al. Structural characterization of the Rabphilin-3A-SNAP25 interaction. Proc. Natl. Acad. Sci. USA 114, E5343–E5351. https://doi.org/10.1073/pnas.1702542114 (2017). · DOI
- Li, T., Cheng, Q., Wang, S. & Ma, C. Rabphilin 3A binds the N-peptide of SNAP-25 to promote SNARE complex assembly in exocytosis. eLife 11, e79926. https://doi.org/10.7554/eLife.79926 (2022). · DOI
- Deák, F. et al. Rabphilin regulates SNARE-dependent re-priming of synaptic vesicles for fusion. EMBO J. 25, 2856–2866. https://doi.org/10.1038/sj.emboj.7601165 (2006). · DOI
- Stanic, J. et al. Rabphilin 3A retains NMDA receptors at synaptic sites through interaction with GluN2A/PSD-95 complex. Nat. Commun. 6, 10181. https://doi.org/10.1038/ncomms10181 (2015). · DOI
- Pavinato, L. et al. Missense variants in RPH3A cause defects in excitatory synaptic function and are associated with a clinically variable neurodevelopmental disorder. Genet. Med. 25, 100922. https://doi.org/10.1016/j.gim.2023.100922 (2023). · DOI
- Tan, M. G. et al. Decreased rabphilin 3A immunoreactivity in Alzheimer’s disease is associated with Aβ burden. Neurochem. Int. 64, 29–36. https://doi.org/10.1016/j.neuint.2013.10.013 (2014). · DOI
- Smith, R. et al. Loss of SNAP-25 and rabphilin 3a in sensory-motor cortex in Huntington’s disease. J. Neurochem. 103, 115–123. https://doi.org/10.1111/j.1471-4159.2007.04703.x (2007). · DOI
- Remnestål, J. et al. Association of CSF proteins with tau and amyloid β levels in asymptomatic 70-year-olds. Alzheimer’s Res. Ther. 13, 54. https://doi.org/10.1186/s13195-021-00789-5 (2021). · DOI
- Wang, X.-L. & Li, L. Cell type-specific potential pathogenic genes and functional pathways in Alzheimer’s disease. BMC Neurol. 21, 381. https://doi.org/10.1186/s12883-021-02407-1 (2021). · DOI
- Yang, L. et al. Rabphilin-3A undergoes phase separation to regulate GluN2A mobility and surface clustering. Nat. Commun. 14, 379. https://doi.org/10.1038/s41467-023-36046-6 (2023). · DOI
- Ranasinghe, K. G. et al. Altered excitatory and inhibitory neuronal subpopulation parameters are distinctly associated with tau and amyloid in Alzheimer’s disease. eLife 11, e77850. https://doi.org/10.7554/eLife.77850 (2022). · DOI
- Szodorai, A. et al. APP anterograde transport requires Rab3A GTPase activity for assembly of the transport vesicle. J. Neurosci. 29, 14534–14544. https://doi.org/10.1523/jneurosci.1546-09.2009 (2009). · DOI
- Wang, Z. X., Tan, L. & Yu, J. T. Axonal transport defects in Alzheimer’s disease. Mol. Neurobiol. 51, 1309–1321. https://doi.org/10.1007/s12035-014-8810-x (2015). · DOI
- Shieh, J. C., Huang, P. T. & Lin, Y. F. Alzheimer’s disease and diabetes: Insulin signaling as the bridge linking two pathologies. Mol. Neurobiol. 57, 1966–1977. https://doi.org/10.1007/s12035-019-01858-5 (2020). · DOI
- Yang, Y. et al. Amyloid-β oligomers may impair SNARE-mediated exocytosis by direct binding to syntaxin 1a. Cell Rep. 12, 1244–1251. https://doi.org/10.1016/j.celrep.2015.07.044 (2015). · DOI · Paper page
- Naughton, B. J. et al. Blood genome-wide transcriptional profiles reflect broad molecular impairments and strong blood-brain links in Alzheimer’s disease. J. Alzheimers Dis. 43, 93–108 (2015). · DOI
- Berchtold, N. C. et al. Synaptic genes are extensively downregulated across multiple brain regions in normal human aging and Alzheimer’s disease. Neurobiol. Aging 34, 1653–1661 (2013). · DOI · Paper page
- Liang, W. S. et al. Gene expression profiles in anatomically and functionally distinct regions of the normal aged human brain. Physiol. Genomics 28, 311–322 (2007). · DOI
- Leng, K. et al. Molecular characterization of selectively vulnerable neurons in Alzheimer’s disease. Nat. Neurosci. 24, 276–287 (2021). · DOI · Paper page
- Soreq, L., Bird, H., Mohamed, W. & Hardy, J. Single-cell RNA sequencing analysis of human Alzheimer’s disease brain samples reveals neuronal and glial specific cells differential expression. PLoS One 18, e0277630. https://doi.org/10.1371/journal.pone.0277630 (2023). · DOI
- Smyth, G. K. Bioinformatics and Computational Biology Solutions Using R and Bioconductor 397–420 (Springer, 2005). · DOI · Paper page
- Subramanian, A. et al. Gene set enrichment analysis: A knowledge-based approach for interpreting genome-wide expression profiles. Proc. Natl. Acad. Sci. USA 102, 15545–15550. https://doi.org/10.1073/pnas.0506580102 (2005). · DOI · Paper page
- Robin, X. et al. pROC: An open-source package for R and S+ to analyze and compare ROC curves. BMC Bioinform. 12, 1–8 (2011). · DOI · Paper page
- Li, X.-W. et al. SCAD-Brain: A public database of single cell RNA-seq data in human and mouse brains with Alzheimer’s disease. Front. Aging Neurosci. 15, 1157792 (2023). · DOI
- Sanotra, M. R. et al. Acrolein adducts and responding autoantibodies correlate with metabolic disturbance in Alzheimer’s disease. Alzheimers Res. Ther. 15, 115. https://doi.org/10.1186/s13195-023-01261-2 (2023). · DOI
Cited by
Sorted by citations
Association of APOC1 with cortical atrophy during conversion to Alzheimer’s disease
Oh, S., Kim, S., Kim, J. P., Seo, S. W., Park, B.-Y., & Park, H. (2025) · GeroScience · doi:10.1007/s11357-025-01695-6 · Cited by 4
Metadata
- Authors
- Nguyen, D. P. Q., Pham, S., Jallow, A. W., Ho, N.-T., Le, B., Quang, H. T., Lin, Y.-F., & Lin, Y.-F.
- Venue
- Scientific Reports
- Published
- 2024-08-12
- Volume
- 14
- Issue
- 1
- ISSN
- 2045-2322
- PMC
- PMC11319786
- Cited by
- 14
- References
- 9
- Language
- en
- Licence
- Funders
- Taipei Medical University-Shuang Ho Hospital, Ministry of Health and Welfare (112FRP-29)
About these checks
Registry, retraction, Cites and statistics results are computed, not judged, with one exception: a printed reference that no index lists is read once by a model before it counts as a citation error. Claims are extracted by a model and kept only when their quote appears verbatim in the text; each cited source is then checked, with a model’s help, for whether it says what the claim relies on. Those verdicts can be wrong — read the claim’s quote and the cited source before relying on one.
Statistics and arithmetic are recomputed, not judged.
Confidence bands are shown only for fields calibrated on our annotated test set. None is calibrated yet, so no band is shown.
What counts as a claim ›How we measure confidence ›How we check this ›
Are you an author, or do you see a problem with this page? Request a review
