

The DOI matches its Crossref record; 73 of the 73 references it cites were found in a registry or an index.
Integrated multiomics analysis identifies potential biomarkers and therapeutic targets for autophagy associated AKI to CKD transition
Open accessPublished version of a preprint
Abstract
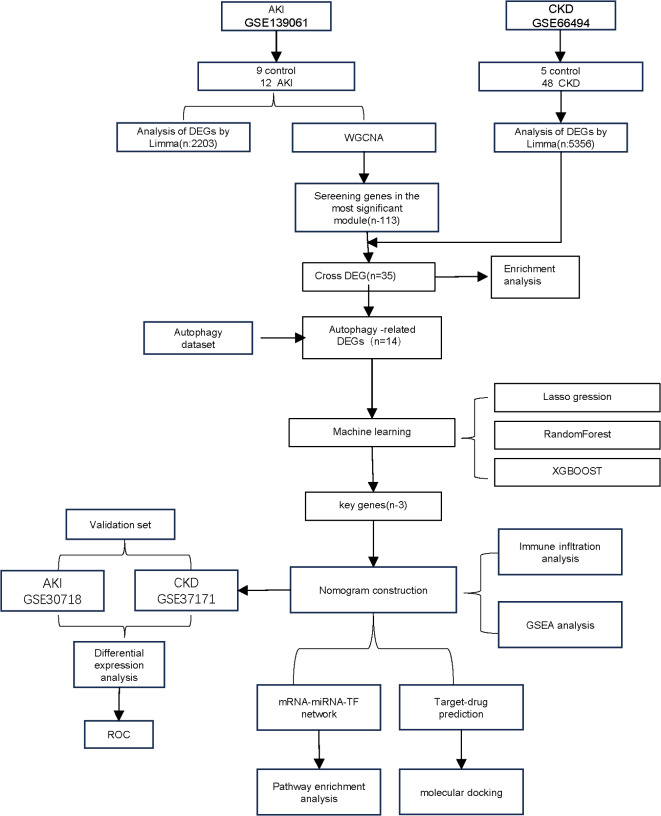
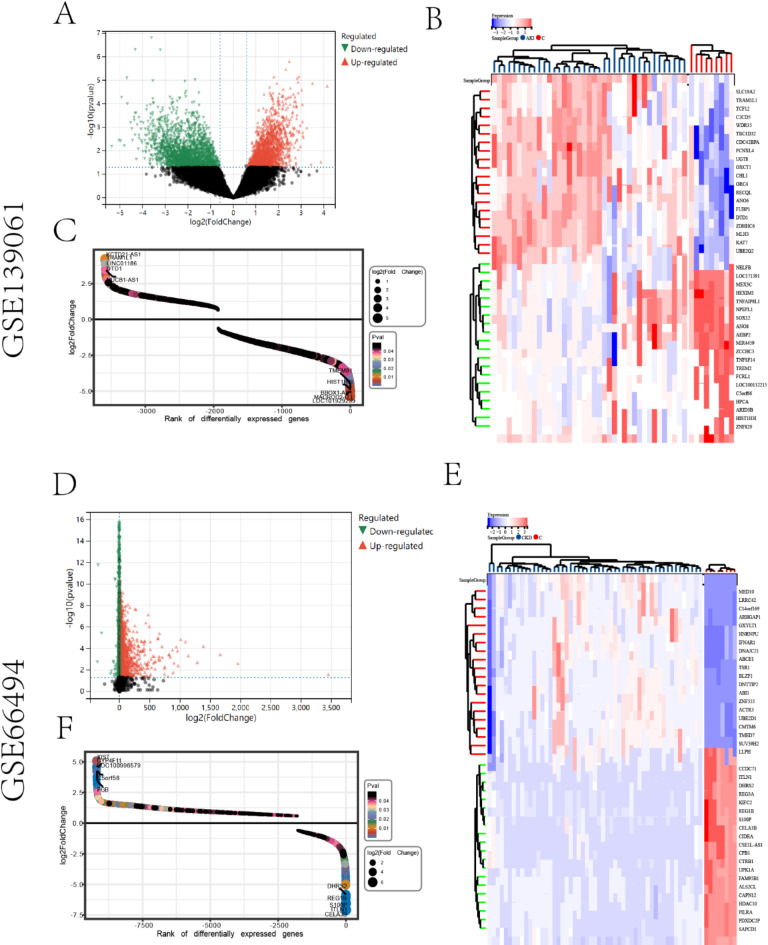
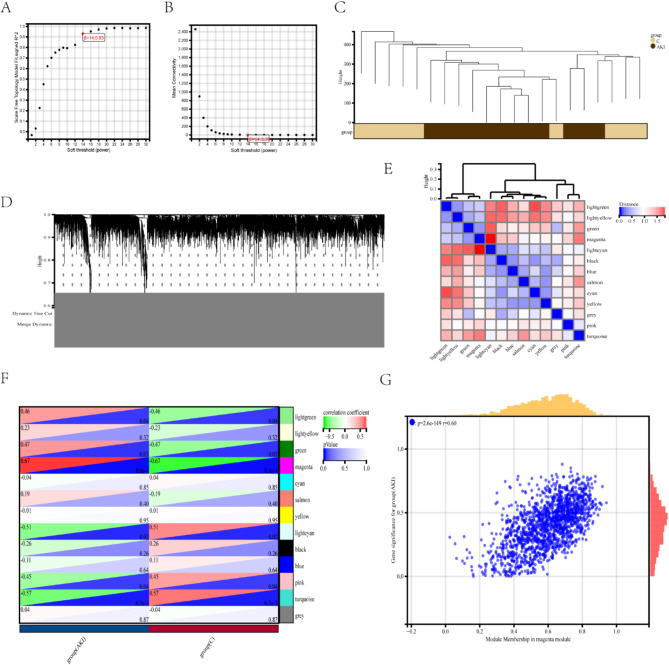
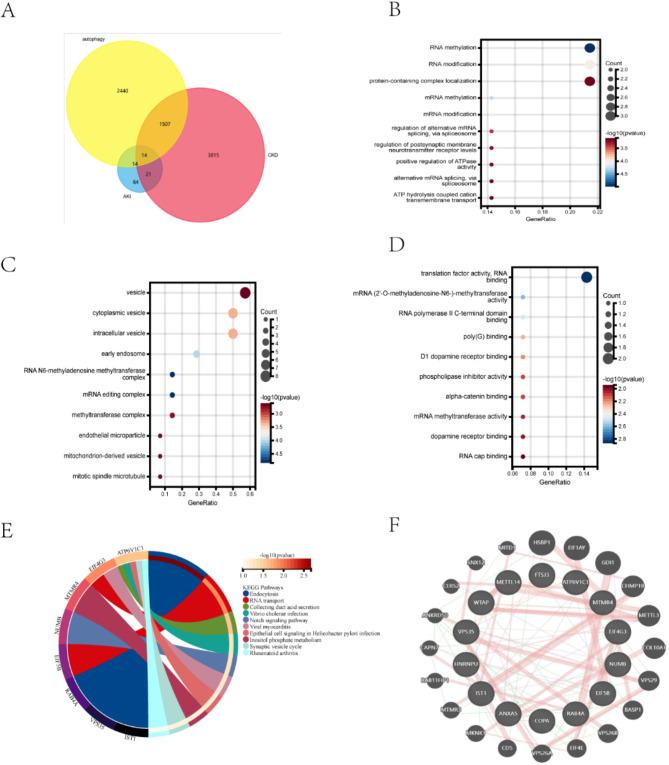
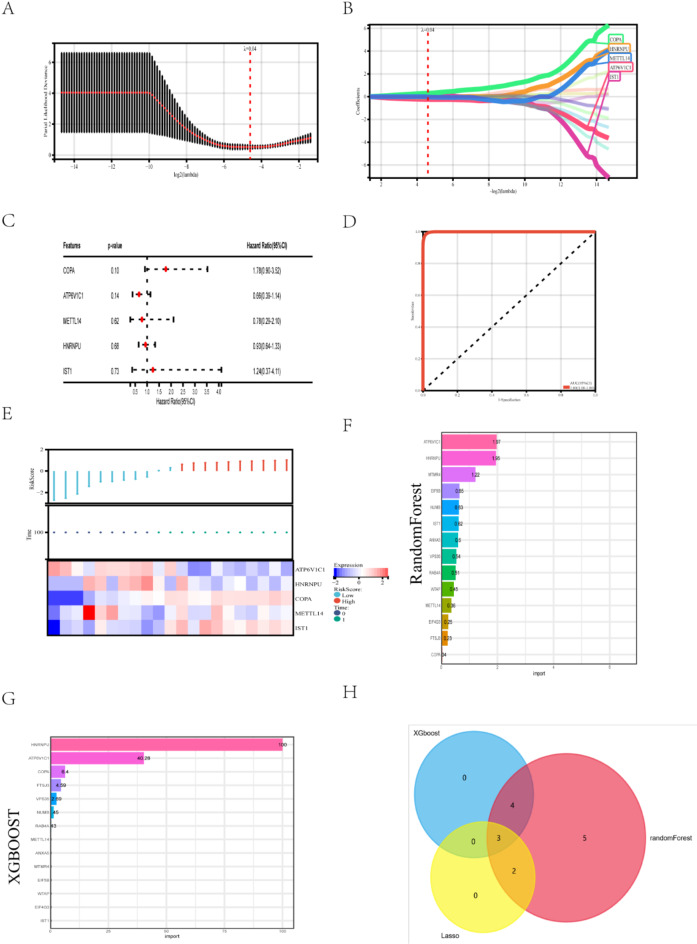
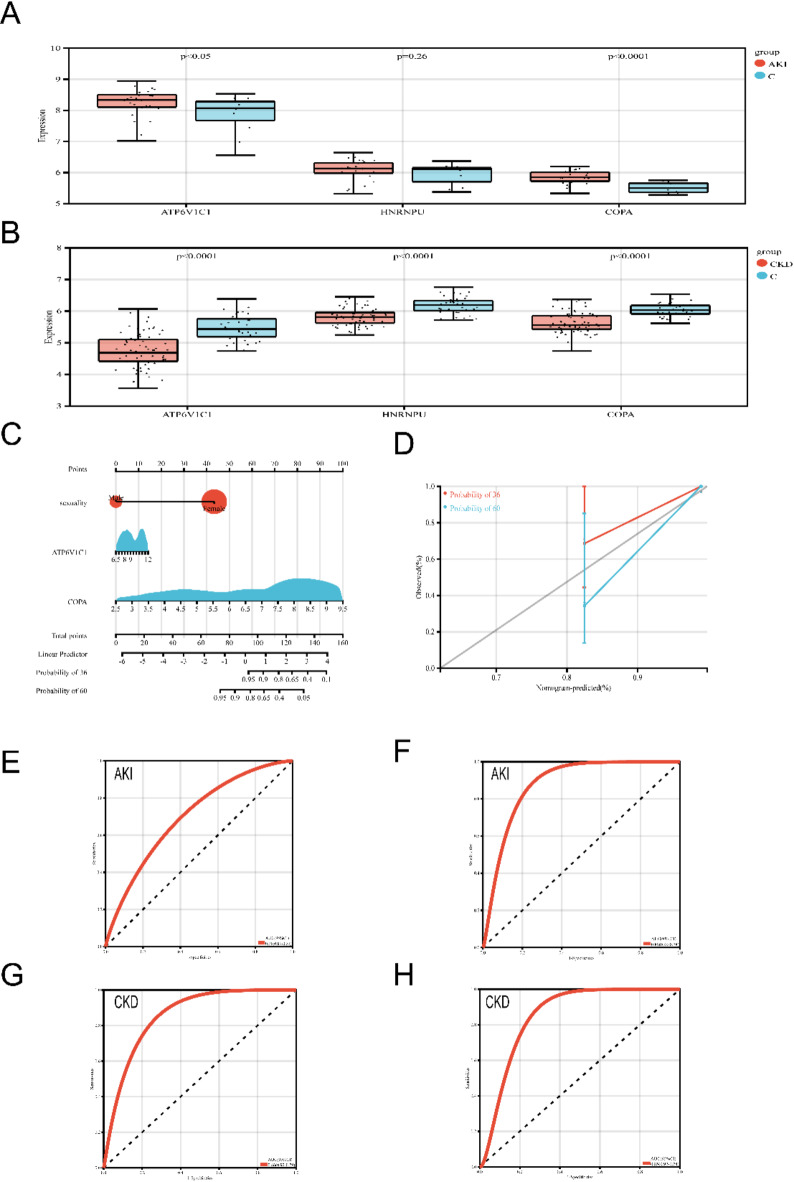
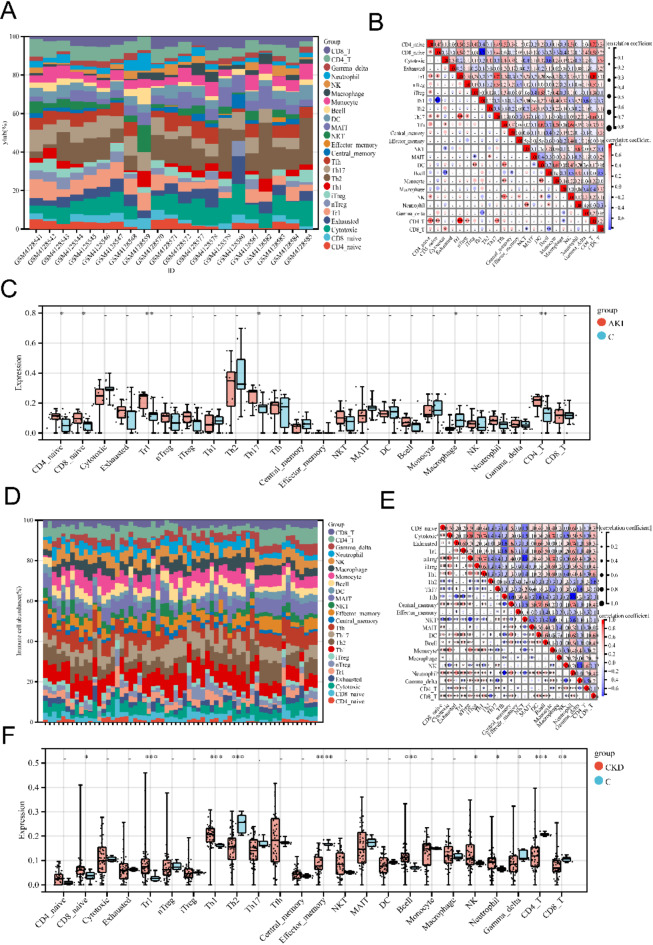
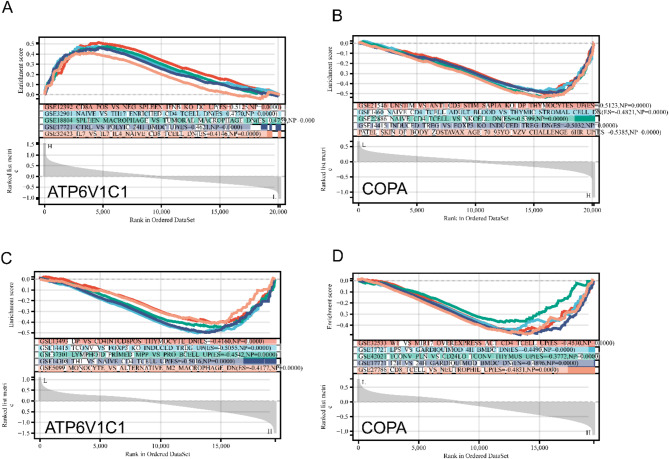
This study explored the relationship between acute kidney injury (AKI) and chronic kidney disease (CKD), focusing on autophagy-related genes and their immune infiltration during the transition from AKI to CKD. We performed weighted correlation network analysis (WGCNA) using two microarray datasets (GSE139061 and GSE66494) in the GEO database and identified autophagy signatures by Gene Ontology (GO) and Kyoto Encyclopedia of Genes and Genomes (KEGG), and GSEA enrichment analysis. Machine learning algorithms such as LASSO, random forest, and XGBoost were used to construct the diagnostic model, and the diagnostic performance of GSE30718 (AKI) and GSE37171 (CKD) was used as validation cohorts to evaluate its diagnostic performance. The study identified 14 autophagy candidate genes, among which ATP6V1C1 and COPA were identified as key biomarkers that were able to effectively distinguish between AKI and CKD. Immune cell infiltration and GSEA analysis revealed immune dysregulation in AKI, and these genes were associated with inflammation and immune pathways. Single-cell analysis showed that ATP6V1C1 and COPA were specifically expressed in AKI and CKD, which may be related to renal fibrosis. In addition, drug prediction and molecular docking analysis proposed SZ(+)-(S)-202-791 and PDE4 inhibitor 16 as potential therapeutic agents. In summary, this study provides new insights into the relationship between AKI and CKD and lays a foundation for the development of new treatment strategies.
Overview
The claims and statistics of this paper haven’t been checked yet.
Run the check — free, no account needed. It reads the open-access text and checks the sources it cites.
Integrity signals
Registry
Cites
Statistics
Figures
Verification
Claims the paper makes
The claims and statistics of this paper haven’t been checked yet.
Run the check — free, no account needed. It reads the open-access text and checks the sources it cites.
Self-check
Percentages, sums and reported differences re-computed from the paper’s own numbers.
The self-check needs the paper’s full text.
Citations
Cites
XGBoost: A Scalable Tree Boosting System
Chen, T., & Guestrin, C. (2016) · Proceedings of the 22nd ACM SIGKDD International Conference on Knowledge Discovery and Data Mining · doi:10.1145/2939672.2939785 · Cited by 54,569
Subramanian, A., Tamayo, P., Mootha, V. K., Mukherjee, S., Ebert, B. L., Gillette, M. A., Paulovich, A., Pomeroy, S. L., Golub, T. R., Lander, E. S., et al. (2005) · Proceedings of the National Academy of Sciences · doi:10.1073/pnas.0506580102 · Cited by 53,625
Highly accurate protein structure prediction with AlphaFold
Jumper, J., Evans, R., Pritzel, A., Green, T., Figurnov, M., Ronneberger, O., Tunyasuvunakool, K., Bates, R., Žídek, A., Potapenko, A., et al. (2021) · Nature · doi:10.1038/s41586-021-03819-2 · Cited by 43,764
limma powers differential expression analyses for RNA-sequencing and microarray studies
Ritchie, M. E., Phipson, B., Wu, D., Hu, Y., Law, C. W., Shi, W., & Smyth, G. K. (2015) · Nucleic Acids Research · doi:10.1093/nar/gkv007 · Cited by 40,458
KEGG: Kyoto Encyclopedia of Genes and Genomes
Kanehisa, M. (2000) · Nucleic Acids Research · doi:10.1093/nar/28.1.27 · Cited by 37,077
KEGG: Kyoto Encyclopedia of Genes and Genomes
Ogata, H., Goto, S., Sato, K., Fujibuchi, W., Bono, H., & Kanehisa, M. (1999) · Nucleic Acids Research · doi:10.1093/nar/27.1.29 · Cited by 31,232
WGCNA: an R package for weighted correlation network analysis
Langfelder, P., & Horvath, S. (2008) · BMC Bioinformatics · doi:10.1186/1471-2105-9-559 · Cited by 27,252
Regularization Paths for Generalized Linear Models via Coordinate Descent
Friedman, J., Hastie, T., & Tibshirani, R. (2010) · Journal of Statistical Software · doi:10.18637/jss.v033.i01 · Cited by 19,927
Open Babel: An open chemical toolbox
O'Boyle, N. M., Banck, M., James, C. A., Morley, C., Vandermeersch, T., & Hutchison, G. R. (2011) · Journal of Cheminformatics · doi:10.1186/1758-2946-3-33 · Cited by 10,939
NCBI GEO: archive for functional genomics data sets—update
Barrett, T., Wilhite, S. E., Ledoux, P., Evangelista, C., Kim, I. F., Tomashevsky, M., Marshall, K. A., Phillippy, K. H., Sherman, P. M., Holko, M., et al. (2012) · Nucleic Acids Research · doi:10.1093/nar/gks1193 · Cited by 10,418
The GeneCards suite: from gene data mining to disease genome sequence analyses
Stelzer, G., Rosen, N., Plaschkes, I., Zimmerman, S., Twik, M., Fishilevich, S., Stein, T. I., Nudel, R., Lieder, I., Mazor, Y., et al. (2016) · Current Protocols in Bioinformatics · doi:10.1002/cpbi.5 · Cited by 5,550
Rosa, S. D., Samoni, S., Villa, G., & Ronco, C. (2017) · Blood Purification · doi:10.1159/000452650 · Cited by 5,040
Warde-Farley, D., Donaldson, S. L., Comes, O., Zuberi, K., Badrawi, R., Chao, P., Franz, M., Grouios, C., Kazi, F., Lopes, C. T., et al. (2010) · Nucleic Acids Research · doi:10.1093/nar/gkq537 · Cited by 4,835
Gene Ontology Consortium: going forward
The Gene Ontology Consortium (2015) · Nucleic Acids Research · doi:10.1093/nar/gku1179 · Cited by 3,492
Ligand docking and binding site analysis with PyMOL and Autodock/Vina
Seeliger, D., & de Groot, B. L. (2010) · Journal of Computer-Aided Molecular Design · doi:10.1007/s10822-010-9352-6 · Cited by 2,623
Acute Kidney Injury and Chronic Kidney Disease as Interconnected Syndromes
Chawla, L. S., Eggers, P. W., Star, R. A., & Kimmel, P. L. (2014) · New England Journal of Medicine · doi:10.1056/nejmra1214243 · Cited by 2,069
The HDOCK server for integrated protein–protein docking
Yan, Y., Tao, H., He, J., & Huang, S. (2020) · Nature Protocols · doi:10.1038/s41596-020-0312-x · Cited by 1,956
Kidney Injury Molecule-1 (KIM-1): A novel biomarker for human renal proximal tubule injury
Han, W. K., Bailly, V., Abichandani, R., Thadhani, R., & Bonventre, J. V. (2002) · Kidney International · doi:10.1046/j.1523-1755.2002.00433.x · Cited by 1,929
A single–cell type transcriptomics map of human tissues
Karlsson, M., Zhang, C., Méar, L., Zhong, W., Digre, A., Katona, B., Sjöstedt, E., Butler, L., Odeberg, J., Dusart, P., et al. (2021) · Science Advances · doi:10.1126/sciadv.abh2169 · Cited by 1,768
Mishra, J., Ma, Q., Prada, A., Mitsnefes, M., Zahedi, K., Yang, J., Barasch, J., & Devarajan, P. (2003) · Journal of the American Society of Nephrology · doi:10.1097/01.asn.0000088027.54400.c6 · Cited by 1,749
Sangerbox: A comprehensive, interaction‐friendly clinical bioinformatics analysis platform
Shen, W., Song, Z., Zhong, X., Huang, M., Shen, D., Gao, P., Qian, X., Wang, M., He, X., Wang, T., et al. (2022) · iMeta · doi:10.1002/imt2.36 · Cited by 1,144
A Clinical Score to Predict Acute Renal Failure after Cardiac Surgery
Thakar, C. V., Arrigain, S., Worley, S., Yared, J.-P., & Paganini, E. P. (2005) · Journal of the American Society of Nephrology · doi:10.1681/asn.2004040331 · Cited by 1,067
miRNet 2.0: network-based visual analytics for miRNA functional analysis and systems biology
Chang, L., Zhou, G., Soufan, O., & Xia, J. (2020) · Nucleic Acids Research · doi:10.1093/nar/gkaa467 · Cited by 907
Mitochondria ROS and mitophagy in acute kidney injury
Su, L., Zhang, J., Gomez, H., Kellum, J. A., & Peng, Z. (2022) · Autophagy · doi:10.1080/15548627.2022.2084862 · Cited by 851
Zuk, A., & Bonventre, J. V. (2016) · Annual Review of Medicine · doi:10.1146/annurev-med-050214-013407 · Cited by 739
Linkermann, A., Chen, G., Dong, G., Kunzendorf, U., Krautwald, S., & Dong, Z. (2014) · Journal of the American Society of Nephrology · doi:10.1681/asn.2014030262 · Cited by 578
Increased risk of death and de novo chronic kidney disease following reversible acute kidney injury
Bucaloiu, I. D., Kirchner, H. L., Norfolk, E. R., Hartle, J. E., & Perkins, R. M. (2012) · Kidney International · doi:10.1038/ki.2011.405 · Cited by 565
See, E. J., Jayasinghe, K., Glassford, N., Bailey, M., Johnson, D. W., Polkinghorne, K. R., Toussaint, N. D., & Bellomo, R. (2019) · Kidney International · doi:10.1016/j.kint.2018.08.036 · Cited by 532
Autophagy in proximal tubules protects against acute kidney injury
Jiang, M., Wei, Q., Dong, G., Komatsu, M., Su, Y., & Dong, Z. (2012) · Kidney International · doi:10.1038/ki.2012.261 · Cited by 477
Sabbisetti, V. S., Waikar, S. S., Antoine, D. J., Smiles, A., Wang, C., Ravisankar, A., Ito, K., Sharma, S., Ramadesikan, S., Lee, M., et al. (2014) · Journal of the American Society of Nephrology · doi:10.1681/asn.2013070758 · Cited by 465
Kidney injury molecule-1 (KIM-1): a urinary biomarker and much more
Bonventre, J. V. (2009) · Nephrology Dialysis Transplantation · doi:10.1093/ndt/gfp010 · Cited by 450
DGIdb 2.0: mining clinically relevant drug–gene interactions
Wagner, A. H., Coffman, A. C., Ainscough, B. J., Spies, N. C., Skidmore, Z. L., Campbell, K. M., Krysiak, K., Pan, D., McMichael, J. F., Eldred, J. M., et al. (2016) · Nucleic Acids Research · doi:10.1093/nar/gkv1165 · Cited by 413
Baylor-Hopkins Center for Mendelian Genomics, Watkin, L. B., Jessen, B., Wiszniewski, W., Vece, T. J., Jan, M., Sha, Y., Thamsen, M., Santos-Cortez, R. L. P., Lee, K., et al. (2015) · Nature Genetics · doi:10.1038/ng.3279 · Cited by 388
KIM-1–mediated phagocytosis reduces acute injury to the kidney
Yang, L., Brooks, C. R., Xiao, S., Sabbisetti, V., Yeung, M. Y., Hsiao, L.-L., Ichimura, T., Kuchroo, V., & Bonventre, J. V. (2015) · Journal of Clinical Investigation · doi:10.1172/jci75417 · Cited by 366
James, M. T., Hemmelgarn, B. R., Wiebe, N., Pannu, N., Manns, B. J., Klarenbach, S. W., & Tonelli, M. (2010) · The Lancet · doi:10.1016/s0140-6736(10)61271-8 · Cited by 353
Burley, S. K., Berman, H. M., Christie, C., Duarte, J. M., Feng, Z., Westbrook, J., Young, J., & Zardecki, C. (2018) · Protein Science · doi:10.1002/pro.3331 · Cited by 293
Autophagy plays a critical role in kidney tubule maintenance, aging and ischemia-reperfusion injury
Liu, S., Hartleben, B., Kretz, O., Wiech, T., Igarashi, P., Mizushima, N., Walz, G., & Huber, T. B. (2012) · Autophagy · doi:10.4161/auto.19419 · Cited by 271
Cellular and molecular pathways of renal repair after acute kidney injury
Kumar, S. (2018) · Kidney International · doi:10.1016/j.kint.2017.07.030 · Cited by 271
Livingston, M. J., Shu, S., Fan, Y., Li, Z., Jiao, Q., Yin, X., Venkatachalam, M. A., & Dong, Z. (2022) · Autophagy · doi:10.1080/15548627.2022.2072054 · Cited by 249
Mitochondrial dysfunction and the AKI-to-CKD transition
Jiang, M., Bai, M., Lei, J., Xie, Y., Xu, S., Jia, Z., & Zhang, A. (2020) · American Journal of Physiology-Renal Physiology · doi:10.1152/ajprenal.00285.2020 · Cited by 226
Diagnostic Value of Urinary Kidney Injury Molecule 1 for Acute Kidney Injury: A Meta-Analysis
Shao, X., Tian, L., Xu, W., Zhang, Z., Wang, C., Qi, C., Ni, Z., & Mou, S. (2014) · PLoS ONE · doi:10.1371/journal.pone.0084131 · Cited by 213
Acute Kidney Injury: Medical Causes and Pathogenesis
Turgut, F. H., Awad, A. S., & Abdel‐Rahman, E. M. (2023) · Journal of Clinical Medicine · doi:10.3390/jcm12010375 · Cited by 209
New Autophagy Reporter Mice Reveal Dynamics of Proximal Tubular Autophagy
Li, L., Wang, Z. V., Hill, J. A., & Lin, F. (2014) · Journal of the American Society of Nephrology · doi:10.1681/asn.2013040374 · Cited by 206
A reference tissue atlas for the human kidney
Hansen, J., Sealfon, R. S. G., Menon, R., Eadon, M. T., Lake, B. B., Steck, B., Anjani, K., Parikh, S. V., Sigdel, T. K., Zhang, G., et al. (2022) · Science Advances · doi:10.1126/sciadv.abn4965 · Cited by 181
Miao, Y., Xia, M., Luo, M., Luo, T., Yang, M., & Guo, A. (2021) · Bioinformatics · doi:10.1093/bioinformatics/btab711 · Cited by 172
Mori, H., Inoki, K., Masutani, K., Wakabayashi, Y., Komai, K., Nakagawa, R., Guan, K., & Yoshimura, A. (2009) · Biochemical and Biophysical Research Communications · doi:10.1016/j.bbrc.2009.04.136 · Cited by 165
Choi, M. E. (2019) · Annual Review of Physiology · doi:10.1146/annurev-physiol-021119-034658 · Cited by 153
Can nomograms be superior to other prediction tools?
Shariat, S. F., Umberto Capitanio, A., Claudio Jeldres, A., & Karakiewicz, P. I. (2008) · British Journal of Urology · doi:10.1111/j.1464-410x.2008.08073.x · Cited by 150
Transition from acute kidney injury to chronic kidney disease: mechanisms, models, and biomarkers
Zhang, T., Widdop, R. E., & Ricardo, S. D. (2024) · American Journal of Physiology-Renal Physiology · doi:10.1152/ajprenal.00184.2024 · Cited by 117
Analysis of pulmonary features and treatment approaches in the COPA syndrome
Tsui, J. L., Estrada, O., Deng, Z., Wang, K. M., Law, C. S., Elicker, B. M., Jones, K. D., Dell, S., Guðmundsson, G., Hansdóttir, S., et al. (2018) · ERJ Open Research · doi:10.1183/23120541.00017-2018 · Cited by 114
The STAT1/HMGB1/NF-κB pathway in chronic inflammation and kidney injury after cisplatin exposure
Fu, Y., Yu, X., Wang, Y., Liu, Z., Yang, D., Zha, J., Tang, C., Cai, J., Chen, G., & Dong, Z. (2023) · Theranostics · doi:10.7150/thno.81406 · Cited by 113
Self-citationFrom AKI to CKD: Maladaptive Repair and the Underlying Mechanisms
Wang, Z., & Zhang, C. (2022) · International Journal of Molecular Sciences · doi:10.3390/ijms231810880 · Cited by 105
STING Operation at the ER/Golgi Interface
Taguchi, T., Mukai, K., Takaya, E., & Shindo, R. (2021) · Frontiers in Immunology · doi:10.3389/fimmu.2021.646304 · Cited by 104
Autophagy Induces Prosenescent Changes in Proximal Tubular S3 Segments
Baisantry, A., Bhayana, S., Rong, S., Ermeling, E., Wrede, C., Hegermann, J., Pennekamp, P., Sörensen-Zender, I., Haller, H., Melk, A., et al. (2016) · Journal of the American Society of Nephrology · doi:10.1681/asn.2014111059 · Cited by 97
Ritter, U., & Moll, H. (2000) · European Journal of Immunology · doi:10.1002/1521-4141(200011)30:11<3147::aid-immu3147>3.0.co;2-j · Cited by 96
Autophagy in Acute Kidney Injury and Repair
He, L., Livingston, M. J., & Dong, Z. (2014) · Nephron Clinical Practice · doi:10.1159/000363677 · Cited by 91
Yu, B., Jin, L., Yao, X., Zhang, Y., Zhang, G., Wang, F., Su, X., Fang, Q., Liang, X., Yang, Y. A., et al. (2023) · Theranostics · doi:10.7150/thno.84655 · Cited by 81
Autophagy and its therapeutic potential in diabetic nephropathy
Han, Y.-P., Liu, L., Yan, J.-L., Chen, M., Meng, X., Zhou, X., & Qian, L.-B. (2023) · Frontiers in Endocrinology · doi:10.3389/fendo.2023.1139444 · Cited by 72
Gameiro, J., Fonseca, J. A., Dias, J. M., Milho, J., Rosa, R., Jorge, S. C., & Lopes, J. A. (2018) · BMC Nephrology · doi:10.1186/s12882-018-1073-4 · Cited by 59
Chen, Y., Liao, L., Wang, B., & Wu, Z. H. (2024) · Frontiers in Immunology · doi:10.3389/fimmu.2024.1332279 · Cited by 50
Menon, S., Symons, J. M., & Selewski, D. T. (2023) · Pediatrics in Review · doi:10.1542/pir.2021-005438 · Cited by 47
Interleukin-1 accounts for intrarenal Th17 cell activation during ureteral obstruction
Pindjáková, J., Hanley, S. A., Duffy, M. M., Sutton, C. E., Weidhofer, G. A., Miller, M. N., Nath, K. A., Mills, K. H. G., Ceredig, R., & Griffin, M. D. (2011) · Kidney International · doi:10.1038/ki.2011.348 · Cited by 46
Hathaway‐Schrader, J. D., Poulides, N. A., Carson, M. D., Kirkpatrick, J. E., Warner, A. J., Swanson, B. A., Taylor, E. V., Chew, M. E., Reddy, S. V., Liu, B., et al. (2020) · JBMR Plus · doi:10.1002/jbm4.10338 · Cited by 35
Tanemoto, F., & Mimura, I. (2022) · Pharmaceuticals · doi:10.3390/ph15020123 · Cited by 35
Kumrah, R., Mathew, B., Vignesh, P., Singh, S., & Rawat, A. K. (2019) · The Application of Clinical Genetics · doi:10.2147/tacg.s153600 · Cited by 24
Yao, X., Chen, H., Xu, B., Lü, J., Gu, J., Chen, F., Ju, M., & Sun, X. (2020) · Gene · doi:10.1016/j.gene.2020.145261 · Cited by 17
Deng, Y., Liu, K., Qiu, Q.-X., Tang, Z.-Y., Que, R.-M., Li, D.-K., Gu, X., Zhou, G., Wu, Y.-F., Zhou, L., et al. (2023) · Frontiers in Immunology · doi:10.3389/fimmu.2023.1126348 · Cited by 17
Li, X., Zhou, X., Ping, X., Zhao, X. Y., Kang, H., Zhang, Y., Ma, Y., Ge, H., Liu, L., Li, R., et al. (2024) · Inflammation · doi:10.1007/s10753-024-01993-9 · Cited by 13
Novel biomarkers related to oxidative stress and immunity in chronic kidney disease
Bai, F., Wang, C., Fan, X., Fang, L., Li, L., Zhang, X., Yu, K., Liu, L., Guo, L., & Yang, X. (2024) · Heliyon · doi:10.1016/j.heliyon.2024.e27754 · Cited by 10
Carpentieri, G., Cecchetti, S., Bocchinfuso, G., Radio, F. C., Leoni, C., Onesimo, R., Calligari, P. A., Pietrantoni, A., Ciolfi, A., Ferilli, M., et al. (2024) · Human Genetics and Genomics Advances · doi:10.1016/j.xhgg.2024.100349 · Cited by 9
Identification and validation of autophagy-related genes in Kawasaki disease
Zhu, H.-Y., Xu, B., Hu, C.-S., Li, A., & Liao, Q. (2023) · Hereditas · doi:10.1186/s41065-023-00278-9 · Cited by 7
Zhao, Q. J., Ma, J., Xiao, J., Feng, Z., & Liu, H. (2024) · World Journal of Emergency Medicine · doi:10.5847/wjem.j.1920-8642.2024.026 · Cited by 5
Metadata
- Authors
- Wang, Y., & Li, Q.
- Affiliations
- Affiliated Hospital of Hebei University (CN)
- People's Liberation Army Air Force (CN)
- Corresponding author
- Li, Qiang
- Venue
- Scientific Reports
- Published
- 2025-04-21
- Volume
- 15
- Issue
- 1
- Pages
- 13687-13687
- ISSN
- 2045-2322 (ISSN-L)
- PMC
- PMC12012120
- OpenAlex
- W4409619675
- Cited by
- 1
- References
- 73
- Citations by year
- 2026: 1
- FWCI
- 0.69
- Type
- journal article
- Language
- en
- Open access
- gold
- doi.org
- Licence
- cc-by-nc-nd
- creativecommons.org/licenses/by-nc-nd/4.0 (tdm)
- creativecommons.org/licenses/by-nc-nd/4.0 (vor)
- Locations
- Scientific Reports (publishedVersion, cc-by-nc-nd)
- Research Square (acceptedVersion, cc-by)
- PubMed Central (publishedVersion, cc-by-nc-nd)
- PubMed (publishedVersion)
- DOAJ (DOAJ: Directory of Open Access Journals) (submittedVersion, cc-by-sa)
- Topics
- Health Sciences › Medicine › Nephrology › Acute Kidney Injury Research
- Life Sciences › Biochemistry, Genetics and Molecular Biology › Cell Biology › Autophagy in Disease and Therapy
- Health Sciences › Medicine › Nephrology › Chronic Kidney Disease and Diabetes
- Keywords
- acute kidney injury, chronic kidney disease, autophagy, AKI-to-CKD transition, biomarkers, therapeutic target, COPA, immune cell infiltration, renal fibrosis, inflammation, drug prediction, molecular docking
- MeSH terms
- Multiomics, Autophagy, Humans, Biomarkers, Gene Expression Profiling, Renal Insufficiency, Chronic, Gene Regulatory Networks, Acute Kidney Injury, Molecular Docking Simulation, Gene Ontology
About these checks
Registry, retraction, Cites and statistics results are computed, not judged, with one exception: a printed reference that no index lists is read once by a model before it counts as a citation error. Claims are extracted by a model and kept only when their quote appears verbatim in the text; each cited source is then checked, with a model’s help, for whether it says what the claim relies on. Those verdicts can be wrong — read the claim’s quote and the cited source before relying on one.
Statistics and arithmetic are recomputed, not judged.
Confidence bands are shown only for fields calibrated on our annotated test set. None is calibrated yet, so no band is shown.
What counts as a claim ›How we measure confidence ›How we check this ›
Are you an author, or do you see a problem with this page? Request a review
Data sources
Bibliographic data: Semantic Scholar, OpenAlex, Crossref.
Contains information from the Semantic Scholar Academic Graph Datasets, made available under the ODC Attribution License (ODC-BY 1.0).
Semantic Scholar’s data is described in: Kinney, R., et al. (2023). The Semantic Scholar Open Data Platform. arXiv:2301.10140.
