CoChat

Deep transfer learning and data augmentation improve glucose levels prediction in type 2 diabetes patients

Open access

The DOI matches its Crossref record; 65 of the 65 references it cites were found in a registry or an index.

Abstract

Accurate prediction of blood glucose variations in type 2 diabetes (T2D) will facilitate better glycemic control and decrease the occurrence of hypoglycemic episodes as well as the morbidity and mortality associated with T2D, hence increasing the quality of life of patients. Owing to the complexity of the blood glucose dynamics, it is difficult to design accurate predictive models in every circumstance, i.e., hypo/normo/hyperglycemic events. We developed deep-learning methods to predict patient-specific blood glucose during various time horizons in the immediate future using patient-specific every 30-min long glucose measurements by the continuous glucose monitoring (CGM) to predict future glucose levels in 5 min to 1 h. In general, the major challenges to address are (1) the dataset of each patient is often too small to train a patient-specific deep-learning model, and (2) the dataset is usually highly imbalanced given that hypo- and hyperglycemic episodes are usually much less common than normoglycemia. We tackle these two challenges using transfer learning and data augmentation, respectively. We systematically examined three neural network architectures, different loss functions, four transfer-learning strategies, and four data augmentation techniques, including mixup and generative models. Taken together, utilizing these methodologies we achieved over 95% prediction accuracy and 90% sensitivity for a time period within the clinically useful 1 h prediction horizon that would allow a patient to react and correct either hypoglycemia and/or hyperglycemia. We have also demonstrated that the same network architecture and transfer-learning methods perform well for the type 1 diabetes OhioT1DM public dataset.

Overview

The claims and statistics of this paper haven’t been checked yet.

Free: it reads the open-access text and checks the first 5 claims that cite a source we can check. Create a free account to check every claim.

A few free checks a day · papers already verified open instantly · results are public

Integrity signals

Registry

Crossref · 10.1038/s41746-021-00480-x

Cites

65 of 65 references verified0 citation errors · 0 not checkable

Statistics

Figures

Fig. 1 Patient-specific prediction of diabetic blood glucose. We use the patient’s blood glucose levels (every 5-min measurements) during several time periods in the past (e.g., 30 min) along with key and widely available patient’s personal data to predict the patient’s blood glucose level in the future (e.g., 30 min later). In particular, we aim to detect hyperglycemia (HYPER, blood glucose level > 180 mg/dL) and hypoglycemia (HYPO, blood glucose level < 80 mg/dL). NORMO, normoglycemia, 80 mg/dL ≤ blood glucose level ≤ 180 mg/dL.
Fig. 1 Patient-specific prediction of diabetic blood glucose. We use the patient’s blood glucose levels (every 5-min measurements) during several time periods in the past (e.g., 30 min) along with key and widely available patient’s personal data to predict the patient’s blood glucose level in the future (e.g., 30 min later). In particular, we aim to detect hyperglycemia (HYPER, blood glucose level > 180 mg/dL) and hypoglycemia (HYPO, blood glucose level < 80 mg/dL). NORMO, normoglycemia, 80 mg/dL ≤ blood glucose level ≤ 180 mg/dL.CC BY · PubMed Central
Fig. 2 Prediction accuracy comparison among different architectures (RNN, CNN, and SAN) with respect to the number of training data from the target patient in two classification tasks. a to c Prediction accuracy of the binary classification, i.e., identifying the neural network output as hypoglycemia or no hypoglycemia, using a RNN, b CNN, and c SAN. d to f Prediction accuracy of the three-class classification, i.e., identifying the neural network output as hypoglycemia or normoglycemia or hyperglycemia, using d RNN, e CNN, and f SAN. The data from a target patient is divided into two parts, one is for training and the other is for testing, and the prediction horizon is fixed at 30 min. The accuracy of Transfer3 is lower compared to other transfer-learning methods. Here, CNN Pretrain and Transfer2 as well as SAN Pretrain show the best performance. Error bars (standard deviation, s.d.) are computed over all patients’ results.
Fig. 2 Prediction accuracy comparison among different architectures (RNN, CNN, and SAN) with respect to the number of training data from the target patient in two classification tasks. a to c Prediction accuracy of the binary classification, i.e., identifying the neural network output as hypoglycemia or no hypoglycemia, using a RNN, b CNN, and c SAN. d to f Prediction accuracy of the three-class classification, i.e., identifying the neural network output as hypoglycemia or normoglycemia or hyperglycemia, using d RNN, e CNN, and f SAN. The data from a target patient is divided into two parts, one is for training and the other is for testing, and the prediction horizon is fixed at 30 min. The accuracy of Transfer3 is lower compared to other transfer-learning methods. Here, CNN Pretrain and Transfer2 as well as SAN Pretrain show the best performance. Error bars (standard deviation, s.d.) are computed over all patients’ results.CC BY · PubMed Central
Fig. 3 Prediction accuracy for two classification tasks given different prediction horizons using the best CNN model. Prediction accuracy for a binary classification, i.e., identifying the neural network output as hypoglycemia or no hypoglycemia, and b three-class classification, i.e., identifying the neural network output as hypoglycemia or normoglycemia or hypoglycemia, given different prediction horizons. No statistical significance is observed for binary classification. *p-value ≤ 0.05; **p-value ≤ 0.01; ***p-value ≤ 0.001, in comparison to the prediction horizon at 5 min; +p-value ≤ 0.05; ++p-value ≤ 0.01; +++p-value ≤ 0.001, in comparison to the prediction horizon at 10 min and #p-value ≤ 0.05; ##p-value ≤ 0.01; ###p-value ≤ 0.001, in comparison to the prediction horizon at 15 min. Error bars (standard deviation, s.d.) are computed over all patients’ results.
Fig. 3 Prediction accuracy for two classification tasks given different prediction horizons using the best CNN model. Prediction accuracy for a binary classification, i.e., identifying the neural network output as hypoglycemia or no hypoglycemia, and b three-class classification, i.e., identifying the neural network output as hypoglycemia or normoglycemia or hypoglycemia, given different prediction horizons. No statistical significance is observed for binary classification. *p-value ≤ 0.05; **p-value ≤ 0.01; ***p-value ≤ 0.001, in comparison to the prediction horizon at 5 min; +p-value ≤ 0.05; ++p-value ≤ 0.01; +++p-value ≤ 0.001, in comparison to the prediction horizon at 10 min and #p-value ≤ 0.05; ##p-value ≤ 0.01; ###p-value ≤ 0.001, in comparison to the prediction horizon at 15 min. Error bars (standard deviation, s.d.) are computed over all patients’ results.CC BY · PubMed Central
Fig. 4 ROC curves for two classification tasks given prediction horizons at 5, 30, and 60 min using the best CNN model. a, b Examples of the ROC curves for the prediction horizon at 5 min, in a binary classification and b three-class classification. c, d Examples of the ROC curves for the prediction horizon at 30 min, in c binary classification and d three-class classification. e, f Examples of the ROC curves for the prediction horizon at 60 min, in e binary classification and f three-class classification. AUC, area under the ROC curve. Binary classification denotes predicting hypoglycemia vs. no hypoglycemia. In three-class classification, we iterated over the labels (HYPO for “hypoglycemia”, NORMO for “normoglycemia” and HYPER for “hyperglycemia”) to compute the ROC curves. The results by Transfer2 is comparable to those by Pretrain while those by Transfer3 are worse than Transfer1 and Transfer2, hence we only show the results of Pretrain and Transfer1 for brevity.
Fig. 4 ROC curves for two classification tasks given prediction horizons at 5, 30, and 60 min using the best CNN model. a, b Examples of the ROC curves for the prediction horizon at 5 min, in a binary classification and b three-class classification. c, d Examples of the ROC curves for the prediction horizon at 30 min, in c binary classification and d three-class classification. e, f Examples of the ROC curves for the prediction horizon at 60 min, in e binary classification and f three-class classification. AUC, area under the ROC curve. Binary classification denotes predicting hypoglycemia vs. no hypoglycemia. In three-class classification, we iterated over the labels (HYPO for “hypoglycemia”, NORMO for “normoglycemia” and HYPER for “hyperglycemia”) to compute the ROC curves. The results by Transfer2 is comparable to those by Pretrain while those by Transfer3 are worse than Transfer1 and Transfer2, hence we only show the results of Pretrain and Transfer1 for brevity.CC BY · PubMed Central
Fig. 5 Regression performance of the best CNN model on the original dataset (no augmentation on the training dataset), using four different loss functions. a Performance comparison between four loss functions, i.e., mean squared error (MSE), relative mean squared error (REL. MSE), mean absolute error (MAE) and relative mean absolute error (REL. MAE) in terms of four prediction scores, i.e., sensitivity, positive predictive value (PPV), specificity and negative predictive value (NPV). The results suggest that the relative mean absolute error (REL. MAE) serves as the best loss function in that it maintains good and balanced performance regarding the four scores shown. Hence, we keep the REL. MAE as the loss function for the subsequent analysis. Error bars (standard deviation, s.d.) are computed over all patients’ results. b True blood glucose values measured by CGM vs. the predicted blood glucose values using REL. MAE as the loss function. The blue scatter points denotes the measurement-prediction pairs. The black diagonal line denotes the perfect prediction. The red lines denote the hypoglycemia threshold 80 mg/dL.
Fig. 5 Regression performance of the best CNN model on the original dataset (no augmentation on the training dataset), using four different loss functions. a Performance comparison between four loss functions, i.e., mean squared error (MSE), relative mean squared error (REL. MSE), mean absolute error (MAE) and relative mean absolute error (REL. MAE) in terms of four prediction scores, i.e., sensitivity, positive predictive value (PPV), specificity and negative predictive value (NPV). The results suggest that the relative mean absolute error (REL. MAE) serves as the best loss function in that it maintains good and balanced performance regarding the four scores shown. Hence, we keep the REL. MAE as the loss function for the subsequent analysis. Error bars (standard deviation, s.d.) are computed over all patients’ results. b True blood glucose values measured by CGM vs. the predicted blood glucose values using REL. MAE as the loss function. The blue scatter points denotes the measurement-prediction pairs. The black diagonal line denotes the perfect prediction. The red lines denote the hypoglycemia threshold 80 mg/dL.CC BY · PubMed Central
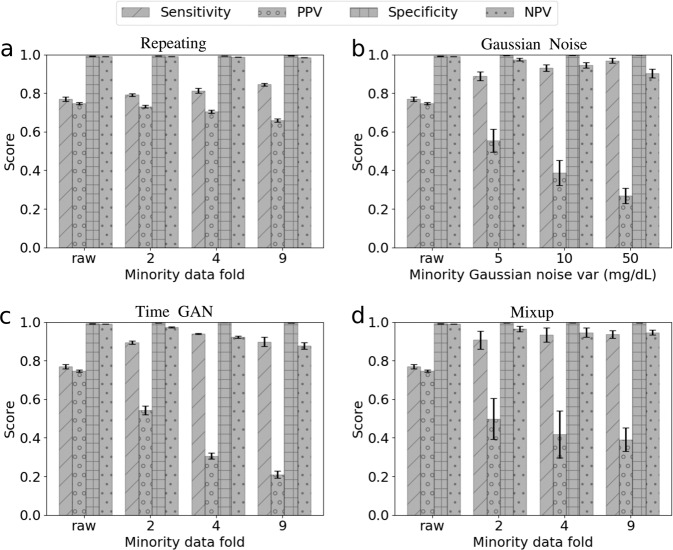
Fig. 6 Predictive scores by different data augmentation methods and different folds of minority data augmentation. Hypoglycemia (the minority class, also the positive class) samples in the training data is augmented with a oversampling by repeating, b Gaussian noise infusion, i.e., the size of the minority training data is doubled by adding a copy of the raw minority data contaminated by Gaussian noises of different levels, c TimeGAN, and d mixup (α = 2), while “no hypoglycemia” (majority class, also the negative class) samples remain intact. The minority data fold represents the number of copies of hypoglycemia samples in the training data after data augmentation. “Raw” denotes no data augmentation on the training dataset; twofold denotes that the raw minority data is kept in the training data and another copy of minority data is generated by either repeating or synthesizing in each training epoch. The mean and standard deviation of the classification metrics are obtained with five different runs. A table recording the detailed numerical results can be found in Supplementary Table 5. Error bars (standard deviation, s.d.) are computed over all patients’ results.
Fig. 6 Predictive scores by different data augmentation methods and different folds of minority data augmentation. Hypoglycemia (the minority class, also the positive class) samples in the training data is augmented with a oversampling by repeating, b Gaussian noise infusion, i.e., the size of the minority training data is doubled by adding a copy of the raw minority data contaminated by Gaussian noises of different levels, c TimeGAN, and d mixup (α = 2), while “no hypoglycemia” (majority class, also the negative class) samples remain intact. The minority data fold represents the number of copies of hypoglycemia samples in the training data after data augmentation. “Raw” denotes no data augmentation on the training dataset; twofold denotes that the raw minority data is kept in the training data and another copy of minority data is generated by either repeating or synthesizing in each training epoch. The mean and standard deviation of the classification metrics are obtained with five different runs. A table recording the detailed numerical results can be found in Supplementary Table 5. Error bars (standard deviation, s.d.) are computed over all patients’ results.CC BY · PubMed Central
Fig. 7 Sensitivity analysis of the prediction horizon on three predictive scores with twofold mixup data augmentation on minority training data. We compare the performance of our CNN model trained on the raw training dataset and on the training dataset augmented by two mixup models, one with α = 0.4 and the other with α = 2 for the Beta distribution Beta(α, α) implemented in mixup. The performance of each model is calibrated in terms of a prediction accuracy, b positive predictive value (PPV, the precision of the positive class), and c sensitivity (recall of the positive class). A table for the detailed numerical results is shown in Supplementary Table 6. Hypoglycemia (the minority class, also the positive class) samples in the training data is augmented with twofold mixup. The purple-shaded bars denote the predictive scores by mixup (α = 0.4), the red-shaded bars denote those by mixup (α = 2), and the gray-shaded bars denote those by the raw training data (no data augmentation). Error bars (standard deviation, s.d.) are computed over all patients’ results.
Fig. 7 Sensitivity analysis of the prediction horizon on three predictive scores with twofold mixup data augmentation on minority training data. We compare the performance of our CNN model trained on the raw training dataset and on the training dataset augmented by two mixup models, one with α = 0.4 and the other with α = 2 for the Beta distribution Beta(α, α) implemented in mixup. The performance of each model is calibrated in terms of a prediction accuracy, b positive predictive value (PPV, the precision of the positive class), and c sensitivity (recall of the positive class). A table for the detailed numerical results is shown in Supplementary Table 6. Hypoglycemia (the minority class, also the positive class) samples in the training data is augmented with twofold mixup. The purple-shaded bars denote the predictive scores by mixup (α = 0.4), the red-shaded bars denote those by mixup (α = 2), and the gray-shaded bars denote those by the raw training data (no data augmentation). Error bars (standard deviation, s.d.) are computed over all patients’ results.CC BY · PubMed Central
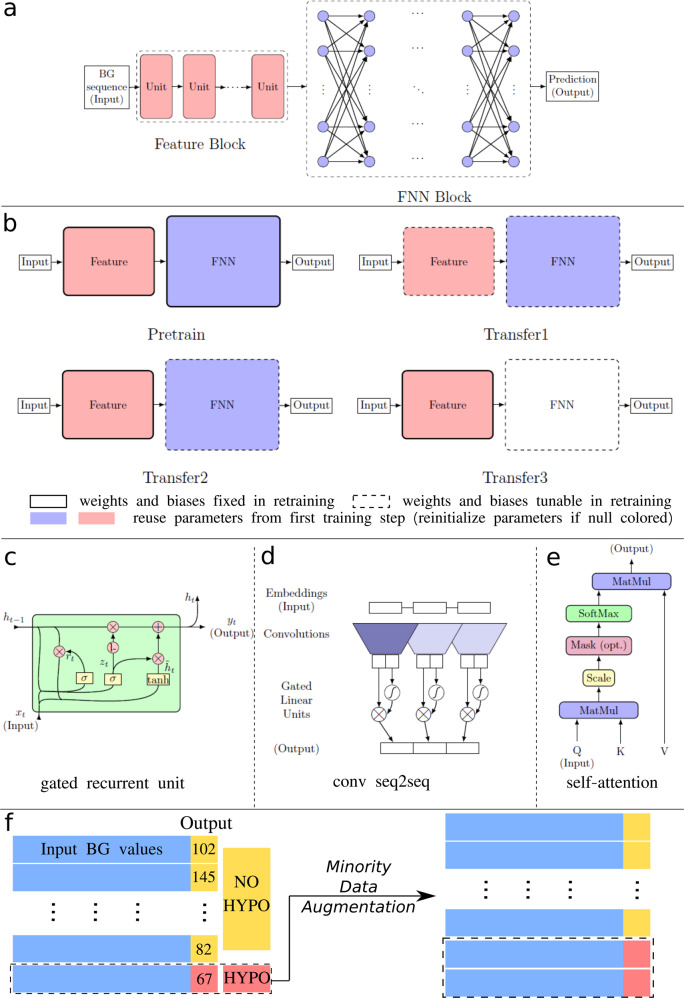
Fig. 8 Neural network architectures, transfer-learning methods, and data preprocessing. a The general structure of the neural networks implemented, consisting of a feature block and a FNN block. The unit in the feature block is model-specific, for example, when referring to the RNN model, the units are GRUs. b Transfer-learning methods implemented, where colored blocks represent reusing neural network parameters (weights and biases) inherited from the pre-training step, the null-colored block in Transfer3 represents re-initializing the network parameters of the FNN block. Blocks bounded with solid lines represent those blocks, of which the network parameters are frozen during retraining step. c–e Representations of each unit used in different types of neural networks. c A gated recurrent unit (GRU) used in the RNN models. d A convolutional sequence to sequence (conv seq2seq) unit used in the CNN models. e A self-attention unit used in the SAN models. More details of transfer learning can be found in Table 3. f Data pre-processing methods employed to deal with data imbalance, the minority data (sequences with hypoglycemia labels) are oversampled to increase model sensitivity for hypoglycemia detection. Output BG values greater then 80 mg/dL are labeled with “no hypoglycemia” (NO HYPO) and those smaller than 80 mg/dL are labeled with “hypoglycemia” (HYPO).
Fig. 8 Neural network architectures, transfer-learning methods, and data preprocessing. a The general structure of the neural networks implemented, consisting of a feature block and a FNN block. The unit in the feature block is model-specific, for example, when referring to the RNN model, the units are GRUs. b Transfer-learning methods implemented, where colored blocks represent reusing neural network parameters (weights and biases) inherited from the pre-training step, the null-colored block in Transfer3 represents re-initializing the network parameters of the FNN block. Blocks bounded with solid lines represent those blocks, of which the network parameters are frozen during retraining step. c–e Representations of each unit used in different types of neural networks. c A gated recurrent unit (GRU) used in the RNN models. d A convolutional sequence to sequence (conv seq2seq) unit used in the CNN models. e A self-attention unit used in the SAN models. More details of transfer learning can be found in Table 3. f Data pre-processing methods employed to deal with data imbalance, the minority data (sequences with hypoglycemia labels) are oversampled to increase model sensitivity for hypoglycemia detection. Output BG values greater then 80 mg/dL are labeled with “no hypoglycemia” (NO HYPO) and those smaller than 80 mg/dL are labeled with “hypoglycemia” (HYPO).CC BY · PubMed Central

Verification

Claims the paper makes

The claims and statistics of this paper haven’t been checked yet.

Free: it reads the open-access text and checks the first 5 claims that cite a source we can check. Create a free account to check every claim.

A few free checks a day · papers already verified open instantly · results are public

Self-check

Percentages, sums and reported differences re-computed from the paper’s own numbers.

The self-check needs the paper’s full text.

Citations

Cites

Show all 65 references

Research works printed but not linked: 13

  1. van den Oord, A. et al. WaveNet: a generative model for raw audio. 9th ISCA Speech Synthesis Workshop 125.
  2. Zhu, T., Li, K., Herrero, P., Chen, J. & Georgiou, P. in A Deep Learning Algorithm for Personalized Blood Glucose Prediction. 64–78 (KHD@ IJCAI, 2018).
  3. Chung, J., Gulcehre, C., Cho, K. & Bengio, Y. Empirical evaluation of gated recurrent neural networks on sequence modeling. NIPS 2014 Workshop on Deep Learning, December 2014 (2014).
  4. Zhang, H., Cisse, M., Dauphin, Y. N. & Lopez-Paz, D. Mixup: beyond empirical risk minimization. In International Conference on Learning Representations (Proceedings of Machine Learning Research, Stockholmsmässan, Stockholm, Sweden. 2018).
  5. Yoon, J., Jarrett, D. & van der Schaar, M. Time-series generative adversarial networks. 33rd Conference on Neural Information Processing Systems (NeurIPS 2019) 5508–5518 (Vancouver, Canada, 2019).
  6. Wu, S., Zhang, H., Valiant, G. & Re, C. the generalization effects of linear transformations in data augmentation. International Conference on Machine Learning 10410–10420 (PMLR, 2020).
  7. Rajpurkar, P., Hannun, A. Y., Haghpanahi, M., Bourn, C. & Ng, A. Y. Cardiologist-level arrhythmia detection with convolutional neural networks. Preprint at https://arxiv.org/abs/1707.01836arXiv (2017).
  8. Khadem, H., Nemat, H., Elliott, J. & Benaissa, M. In (eds Bach, K., Bunescu, R., Marling, C. & Wiratunga, N.) Knowledge Discovery in Healthcare Data 2020, Vol. 2675, 152–156 (CEUR Workshop Proceedings, 2020).
  9. Bevan, R. & Coenen, F. In (eds Bach, K., Bunescu, R., Marling, C. & Wiratunga, N.) Knowledge Discovery in Healthcare Data 2020, Vol. 2675, 100–104 (CEUR Workshop Proceedings, 2020).
  10. Joedicke, D. et al. In (eds Bach, K., Bunescu, R., Marling, C. & Wiratunga, N.) Knowledge Discovery in Healthcare Data 2020, Vol. 2675, 147–151 (CEUR Workshop Proceedings, 2020).
  11. Ma, N. et al. In (eds Bach, K., Bunescu, R., Marling, C. & Wiratunga, N.) Knowledge Discovery in Healthcare Data 2020, Vol. 2675, 157–161 (CEUR Workshop Proceedings, 2020).
  12. Bahdanau, D., Cho, K. & Bengio, Y. Neural machine translation by jointly learning to align and translate. 3rd International Conference on Learning Representations, ICLR 2015
  13. Conference date: 07-05-2015 through 09-05-2015 (2015).

Cited by

See all 152

Metadata

Authors
Deng, Y., Lu, L., Aponte, L., Angelidi, A. M., Novak, V., Karniadakis, G. E., & Mantzoros, C. S.
Affiliations
  • Brown University (US)
  • University of Pennsylvania (US)
  • Beth Israel Deaconess Medical Center (US)
Corresponding author
  • Karniadakis, George Em
  • Mantzoros, Christos S.
Venue
npj Digital Medicine
Published
2021-07-14
Volume
4
Issue
1
Pages
109-109
ISSN
2398-6352 (ISSN-L)
OpenAlex
W3178109510
Cited by
152
References
63
Citations by year
2026: 30 · 2025: 41 · 2024: 35 · 2023: 28 · 2022: 16 · 2021: 2
FWCI
15.10
Type
journal article
Language
en
Open access
Licence
Locations
  • npj Digital Medicine (publishedVersion, cc-by)
  • PubMed Central (publishedVersion, cc-by)
  • PubMed (publishedVersion)
  • DOAJ (DOAJ: Directory of Open Access Journals) (submittedVersion, cc-by-sa)
Funders
  • U.S. Department of Health & Human Services | NIH | National Heart, Lung, and Blood Institute (R01HL154150, U01HL142518)
  • U.S. Department of Health & Human Services | NIH | National Institute of Diabetes and Digestive and Kidney Diseases (DK081913)
  • U.S. Department of Health & Human Services | NIH | National Institute on Aging (1R01-AG-0287601)
Topics
  • Health Sciences › Medicine › Endocrinology, Diabetes and Metabolism › Diabetes Management and Research
  • Physical Sciences › Computer Science › Artificial Intelligence › Machine Learning in Healthcare
  • Health Sciences › Health Professions › Health Information Management › Artificial Intelligence in Healthcare
Keywords
type 2 diabetes, blood glucose prediction, continuous glucose monitoring, transfer learning, data augmentation, patient-specific prediction, hypoglycemia, hyperglycemia, class imbalance, mixup, generative models, type 1 diabetes, neural network architecture, loss functions

About these checks

Registry, retraction, Cites and statistics results are computed, not judged, with one exception: a printed reference that no index lists is read once by a model before it counts as a citation error. Claims are extracted by a model and kept only when their quote appears verbatim in the text; each cited source is then checked, with a model’s help, for whether it says what the claim relies on. Those verdicts can be wrong — read the claim’s quote and the cited source before relying on one.

Statistics and arithmetic are recomputed, not judged.

Confidence bands are shown only for fields calibrated on our annotated test set. None is calibrated yet, so no band is shown.

What counts as a claim ›How we measure confidence ›How we check this ›

Are you an author, or do you see a problem with this page? Request a review

How to cite

Cite CoChat for the checks on this page, and the paper for its own findings.

This page
CoChat. (2026). Citation check: Deep transfer learning and data augmentation improve glucose levels prediction in type 2 diabetes patients. https://app.cochat.ai/papers/10.1038/s41746-021-00480-x
The paper
Deng, Y., Lu, L., Aponte, L., Angelidi, A. M., Novak, V., Karniadakis, G. E., & Mantzoros, C. S. (2021). Deep transfer learning and data augmentation improve glucose levels prediction in type 2 diabetes patients. npj Digital Medicine. https://doi.org/10.1038/s41746-021-00480-x

Data sources

Bibliographic data: Semantic Scholar, OpenAlex, Crossref.

Contains information from the Semantic Scholar Academic Graph Datasets, made available under the ODC Attribution License (ODC-BY 1.0).

Semantic Scholar’s data is described in: Kinney, R., et al. (2023). The Semantic Scholar Open Data Platform. arXiv:2301.10140.