Cited by 104Non-Invasive Vital Sign MonitoringElectrical and Bioimpedance TomographyAdvanced Sensor and Energy Harvesting Materials

The DOI matches its Crossref record; 40 of the 40 references it cites were found in a registry or an index.

Continuous cuffless blood pressure monitoring with a wearable ring bioimpedance device

Open access

Abstract

Smart rings provide unique opportunities for continuous physiological measurement. They are easy to wear, provide little burden in comparison to other smart wearables, are suitable for nocturnal settings, and can be sized to provide ideal contact between the sensors and the skin at all times. Continuous measuring of blood pressure (BP) provides essential diagnostic and prognostic value for cardiovascular health management. However, conventional ambulatory BP measurement devices operate using an inflating cuff that is bulky, intrusive, and impractical for frequent or continuous measurements. We introduce ring-shaped bioimpedance sensors leveraging the deep tissue sensing ability of bioimpedance while introducing no sensitivity to skin tones, unlike optical modalities. We integrate unique human finger finite element model with exhaustive experimental data from participants and derive optimum design parameters for electrode placement and sizes that yields highest sensitivity to arterial volumetric changes, with no discrimination against varying skin tones. BP is constructed using machine learning algorithms. The ring sensors are used to estimate arterial BP showing peak correlations of 0.81, and low error (systolic BP: 0.11 ± 5.27 mmHg, diastolic BP: 0.11 ± 3.87 mmHg) for >2000 data points and wide BP ranges (systolic: 89-213 mmHg and diastolic: 42-122 mmHg), highlighting the significant potential use of bioimpedance ring for accurate and continuous estimation of BP.

Overview

The claims and statistics of this paper haven’t been checked yet.

Run the check — free, no account needed. It reads the open-access text and checks the sources it cites.

A few free checks a day · papers already verified open instantly · results are public

Integrity signals

Registry

Crossref · 10.1038/s41746-023-00796-w

Cites

40 of 40 references verified0 citation errors · 0 not checkable

Statistics

Figures

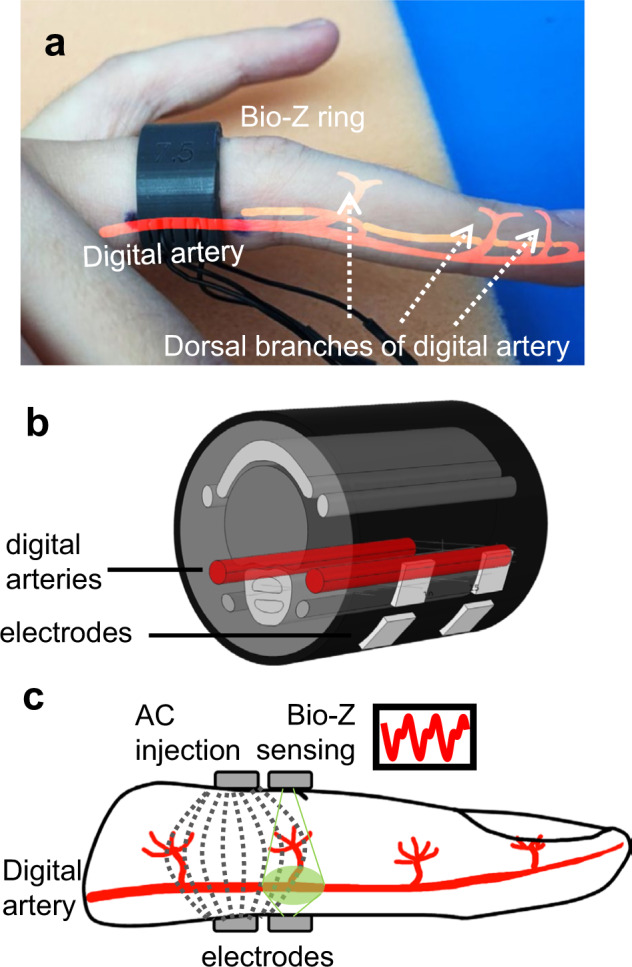
Fig. 1 Bioimpedance (Bio-Z) ring sensor for arterial blood flow and pressure sensing. a A fabricated ring example custom fit to user’s finger size. b The finite element model of the human finger used in guiding ring design. c Cross-section of the four electrode bioimpedance sensing, with dashed lines representing high frequency alternating current (AC) distribution within the finger, and green area shows sensitive area for Bio-Z sensing electrodes.
Fig. 1 Bioimpedance (Bio-Z) ring sensor for arterial blood flow and pressure sensing. a A fabricated ring example custom fit to user’s finger size. b The finite element model of the human finger used in guiding ring design. c Cross-section of the four electrode bioimpedance sensing, with dashed lines representing high frequency alternating current (AC) distribution within the finger, and green area shows sensitive area for Bio-Z sensing electrodes.CC BY · PubMed Central
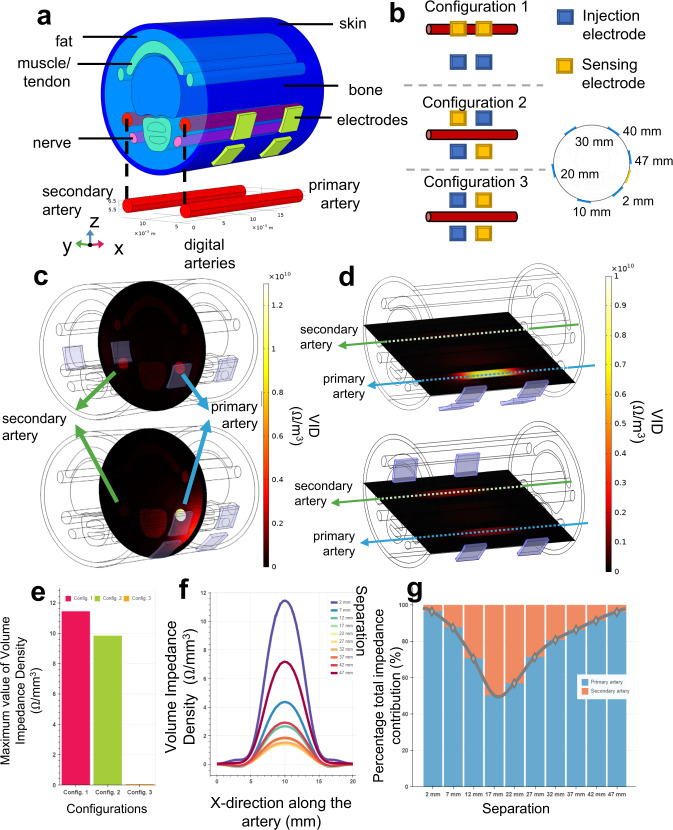
Fig. 2 Finite element model of the finger and its electrical simulations. a Three-dimensional finger model scaled for US-7 ring form factor, with six different tissue layers (i.e., skin, fat, bone, artery, nerve, muscle) and metal electrodes with complex electrical characteristics defined for each material type. b Three electrode configurations that exhausts possible combinations of electrical current injection and voltage sensing electrodes used in 4-point bioimpedance sensing. c, d Volume impedance density (VID) surface plots for y-z (vertical cut of the artery from the middle point) and x-y planes (horizontal cut along the artery), respectively, where top plots and bottom plots show the VID with 22 mm and 2 mm electrode separation. In both cases, the primary artery VID contribution is higher with smaller electrode separation, shown as in brighter color. e Maximum values of the VID measured from the primary artery for different configurations (Config.), where the highest value obtained with Configuration 1 (pink) compared to Configurations 2 (green) and 3 (orange). f VID distribution along the primary artery for different electrode separations. The highest values are obtained with 2 mm electrode separation. Colors indicate the separation. g Percentage total impedance distribution between the primary (blue) and secondary (orange) arteries calculated from the volume integral of the VID measured per artery. In agreement with other analysis types, the highest specificity for the primary artery is achieved with 2 mm separation.
Fig. 2 Finite element model of the finger and its electrical simulations. a Three-dimensional finger model scaled for US-7 ring form factor, with six different tissue layers (i.e., skin, fat, bone, artery, nerve, muscle) and metal electrodes with complex electrical characteristics defined for each material type. b Three electrode configurations that exhausts possible combinations of electrical current injection and voltage sensing electrodes used in 4-point bioimpedance sensing. c, d Volume impedance density (VID) surface plots for y-z (vertical cut of the artery from the middle point) and x-y planes (horizontal cut along the artery), respectively, where top plots and bottom plots show the VID with 22 mm and 2 mm electrode separation. In both cases, the primary artery VID contribution is higher with smaller electrode separation, shown as in brighter color. e Maximum values of the VID measured from the primary artery for different configurations (Config.), where the highest value obtained with Configuration 1 (pink) compared to Configurations 2 (green) and 3 (orange). f VID distribution along the primary artery for different electrode separations. The highest values are obtained with 2 mm electrode separation. Colors indicate the separation. g Percentage total impedance distribution between the primary (blue) and secondary (orange) arteries calculated from the volume integral of the VID measured per artery. In agreement with other analysis types, the highest specificity for the primary artery is achieved with 2 mm separation.CC BY · PubMed Central
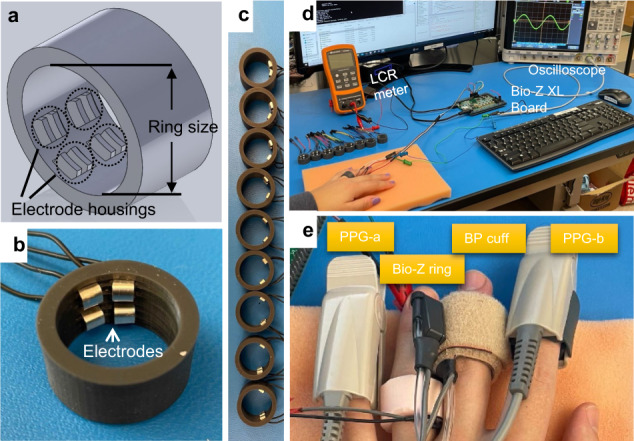
Fig. 3 Bioimpedance ring-sensor. a 3-D SolidWorks design of the ring. b An example US-7 ring with 2 mm electrode separation. c A total of nine different electrode separation rings (2 mm to 18 mm, with 2 mm step). d Experimental setup used in assessing bioimpedance signal quality acquired with ring sensor. Bio-Z XL board is used for bioimpedance signal acquisition with data sent to PC for post-processing through a USB communication. The LCR meter is used to ensure good electrode-skin contact prior to experimentation. Oscilloscope is used to check the presence of saturation during the signal acquisition. e Different sensors on the same hand are used for blood pressure (BP) experiments. Bio-Z ring sensor is worn on the ring finger, with the Finapres NOVA BP cuff on the middle finger providing reference BP values. Photoplethysmography (PPG) sensors, PPG-a and PPG-b, are connected to the Bio-Z XL board and Finapres NOVA device respectively, and used for synchronization of BP beats with ring sensor bioimpedance features.
Fig. 3 Bioimpedance ring-sensor. a 3-D SolidWorks design of the ring. b An example US-7 ring with 2 mm electrode separation. c A total of nine different electrode separation rings (2 mm to 18 mm, with 2 mm step). d Experimental setup used in assessing bioimpedance signal quality acquired with ring sensor. Bio-Z XL board is used for bioimpedance signal acquisition with data sent to PC for post-processing through a USB communication. The LCR meter is used to ensure good electrode-skin contact prior to experimentation. Oscilloscope is used to check the presence of saturation during the signal acquisition. e Different sensors on the same hand are used for blood pressure (BP) experiments. Bio-Z ring sensor is worn on the ring finger, with the Finapres NOVA BP cuff on the middle finger providing reference BP values. Photoplethysmography (PPG) sensors, PPG-a and PPG-b, are connected to the Bio-Z XL board and Finapres NOVA device respectively, and used for synchronization of BP beats with ring sensor bioimpedance features.CC BY · PubMed Central
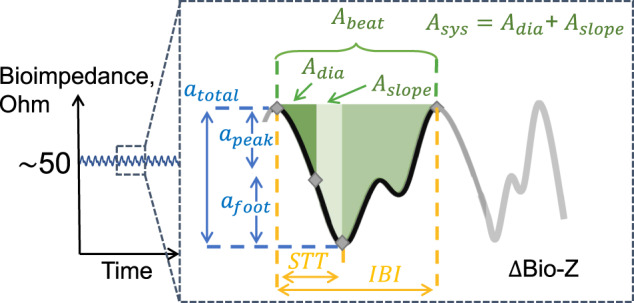
Fig. 4 Bioimpedance signal illustration during a cardiac cycle and the corresponding bioimpedance feature definitions used in blood pressure correlation analysis. The amplitude features are shown in blue color, the timing features are shown in yellow color (STT: slope transit time, IBI: inter-beat intervals), and the area features are shown in green color. We named the feature pertaining to the area between the diastolic point and the maximum slope point as Adia, the area between the maximum slope point and the systolic point as Aslope, and the area between the diastolic and the systolic point as Asys.
Fig. 4 Bioimpedance signal illustration during a cardiac cycle and the corresponding bioimpedance feature definitions used in blood pressure correlation analysis. The amplitude features are shown in blue color, the timing features are shown in yellow color (STT: slope transit time, IBI: inter-beat intervals), and the area features are shown in green color. We named the feature pertaining to the area between the diastolic point and the maximum slope point as Adia, the area between the maximum slope point and the systolic point as Aslope, and the area between the diastolic and the systolic point as Asys.CC BY · PubMed Central
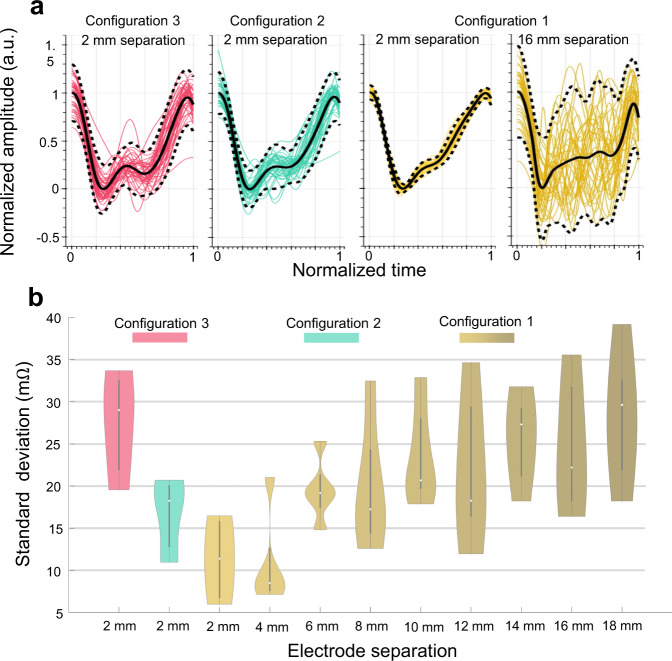
Fig. 5 Bioimpedance signal consistency analysis results for different electrode configurations and sizes for data collected from N = 5 participants. a Bioimpedance signals over an example 30-seconds trial for different electrode configurations, visualizing the signal consistency over a constant period. The highest consistency is achieved with 2 mm ring separation using Configuration 1 (yellow) compared to Configuration 2 (green) and 3 (pink). b Violin plots for standard deviation (SD) metric used for signal consistency analysis calculated with different electrode configurations and separations. Violin plots include SD values averaged for all the trials of each participant and combined together. Box plots show the median and the Q25 and Q75 ranges. Colors used to identify separations and configurations. Here 2 mm and 4 mm electrode separations with Configuration 1 yield the lowest SD values indicating a higher overall bioimpedance signal consistency.
Fig. 5 Bioimpedance signal consistency analysis results for different electrode configurations and sizes for data collected from N = 5 participants. a Bioimpedance signals over an example 30-seconds trial for different electrode configurations, visualizing the signal consistency over a constant period. The highest consistency is achieved with 2 mm ring separation using Configuration 1 (yellow) compared to Configuration 2 (green) and 3 (pink). b Violin plots for standard deviation (SD) metric used for signal consistency analysis calculated with different electrode configurations and separations. Violin plots include SD values averaged for all the trials of each participant and combined together. Box plots show the median and the Q25 and Q75 ranges. Colors used to identify separations and configurations. Here 2 mm and 4 mm electrode separations with Configuration 1 yield the lowest SD values indicating a higher overall bioimpedance signal consistency.CC BY · PubMed Central
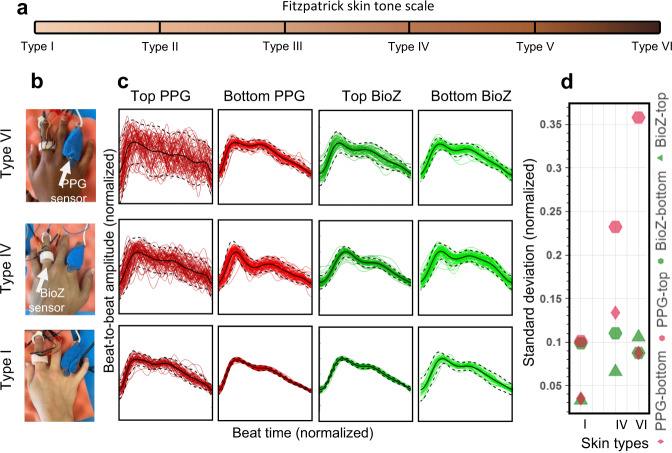
Fig. 6 Comparison of arterial pulse wave captured with bioimpedance and PPG sensors for varying skin tones. a Fitzpatrick skin tone scale. In this study, we used Type I (pale white), Type IV (moderate brown), and Type VI (dark brown) skin types. b Bioimpedance (BioZ) ring sensor and Nellcor Maxfast PPG sensor (660 nm–red) placed at index and ring fingers respectively to capture simultaneous blood pressure pulse wave. During the measurements, the PPG sensor is wrapped around the finger with a self-adherent cohesive bandage to establish tight fit contact with the skin. c Normalized waveforms captured in two different scenarios placed on top of the skin, that is darker (plots at first and third columns) when compared to the placement on the bottom with a lighter skin tone (plots at second and fourth columns), from three participants with three skin types I, IV and VI. d Standard deviation values from the normalized beats with respect to the normalized average beat for different sensors and placements for different skin types. The results show a clear degradation in signal consistency for PPG sensor when the skin color gets darker, whereas no significant correlation was observed for bioimpedance sensor.
Fig. 6 Comparison of arterial pulse wave captured with bioimpedance and PPG sensors for varying skin tones. a Fitzpatrick skin tone scale. In this study, we used Type I (pale white), Type IV (moderate brown), and Type VI (dark brown) skin types. b Bioimpedance (BioZ) ring sensor and Nellcor Maxfast PPG sensor (660 nm–red) placed at index and ring fingers respectively to capture simultaneous blood pressure pulse wave. During the measurements, the PPG sensor is wrapped around the finger with a self-adherent cohesive bandage to establish tight fit contact with the skin. c Normalized waveforms captured in two different scenarios placed on top of the skin, that is darker (plots at first and third columns) when compared to the placement on the bottom with a lighter skin tone (plots at second and fourth columns), from three participants with three skin types I, IV and VI. d Standard deviation values from the normalized beats with respect to the normalized average beat for different sensors and placements for different skin types. The results show a clear degradation in signal consistency for PPG sensor when the skin color gets darker, whereas no significant correlation was observed for bioimpedance sensor.CC BY · PubMed Central
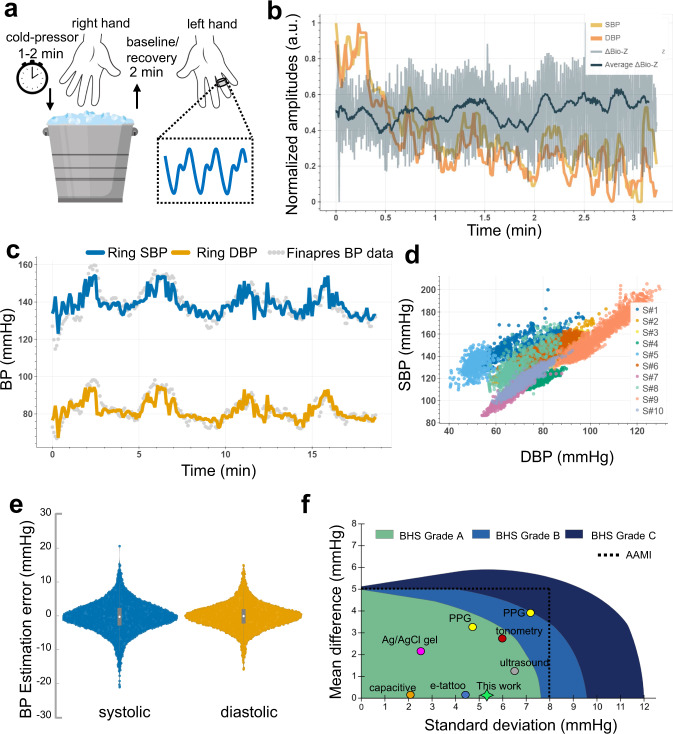
Fig. 7 Bioimpedance ring sensor systolic (SBP) and diastolic (DBP) blood pressure results. a Visualization of cold-pressor test to induce blood pressure variations. b SBP (yellow line) and DBP (orange line) beats, and corresponding bioimpedance signal (gray line) and its mean (dark blue line) for a single trial collected at the participant’s recovery from hand-grip/cold-pressor test. c SBP (blue line) and DBP (orange line) estimations with bioimpedance ring sensor in reference to gold-standard Finapres finger BP cuff measurements (gray circles) for a single participant (S#3). d SBP and DBP value distributions for all participants, showing the wide range of blood pressure values used in evaluation. Colors represent data from different participants. e Violin plots for SBP (blue) and DBP (orange) estimations errors with ring sensors in comparison to reference Finapres BP. The gray box plot shows the median, and 25th and 75th quartiles. f Comparison of related work with this work for cuffless BP estimation and their classification based on the AAMI and BHS standards. Green, light blue, and dark blue areas represent Grade A, Grade B, and Grade C classifications for the BHS standard. Dashed black line represents the error limits set by the AAMI standard.
Fig. 7 Bioimpedance ring sensor systolic (SBP) and diastolic (DBP) blood pressure results. a Visualization of cold-pressor test to induce blood pressure variations. b SBP (yellow line) and DBP (orange line) beats, and corresponding bioimpedance signal (gray line) and its mean (dark blue line) for a single trial collected at the participant’s recovery from hand-grip/cold-pressor test. c SBP (blue line) and DBP (orange line) estimations with bioimpedance ring sensor in reference to gold-standard Finapres finger BP cuff measurements (gray circles) for a single participant (S#3). d SBP and DBP value distributions for all participants, showing the wide range of blood pressure values used in evaluation. Colors represent data from different participants. e Violin plots for SBP (blue) and DBP (orange) estimations errors with ring sensors in comparison to reference Finapres BP. The gray box plot shows the median, and 25th and 75th quartiles. f Comparison of related work with this work for cuffless BP estimation and their classification based on the AAMI and BHS standards. Green, light blue, and dark blue areas represent Grade A, Grade B, and Grade C classifications for the BHS standard. Dashed black line represents the error limits set by the AAMI standard.CC BY · PubMed Central
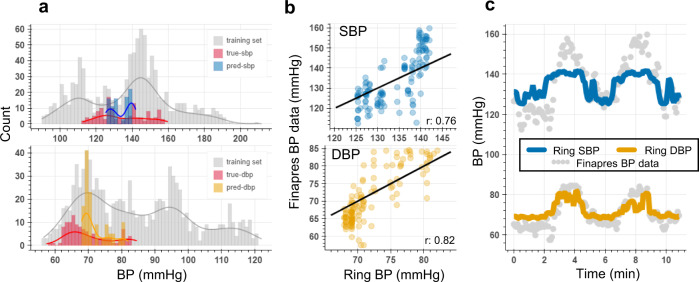
Fig. 8 Bioimpedance ring sensor leave-one-subject-out analysis for systolic (SBP) and diastolic (DBP) blood pressure estimation. a SBP (top) and DBP (bottom) data distribution training set involving participants S#6, S#7, and S#9 shown in gray color, true SBP, and DBP values in the test set for S#8’s’data shown in red color, and predicted SBP (blue) and DBP (orange) values for S#8’s data. b Correlation plots for SBP and DBP between true and predicted BP points, showing high correlation values (r represents Pearson’s correlation coefficient between true and predicted BP values). c Time traces for SBP (blue line) and DBP (orange line) estimations with bioimpedance ring sensor for S#8, and the reference BP values (gray circles), where the model was trained on three other participants’ data.
Fig. 8 Bioimpedance ring sensor leave-one-subject-out analysis for systolic (SBP) and diastolic (DBP) blood pressure estimation. a SBP (top) and DBP (bottom) data distribution training set involving participants S#6, S#7, and S#9 shown in gray color, true SBP, and DBP values in the test set for S#8’s’data shown in red color, and predicted SBP (blue) and DBP (orange) values for S#8’s data. b Correlation plots for SBP and DBP between true and predicted BP points, showing high correlation values (r represents Pearson’s correlation coefficient between true and predicted BP values). c Time traces for SBP (blue line) and DBP (orange line) estimations with bioimpedance ring sensor for S#8, and the reference BP values (gray circles), where the model was trained on three other participants’ data.CC BY · PubMed Central

Verification

Claims the paper makes

The claims and statistics of this paper haven’t been checked yet.

Run the check — free, no account needed. It reads the open-access text and checks the sources it cites.

A few free checks a day · papers already verified open instantly · results are public

Claims other papers make about this one

Each is checked against this paper’s own text: does it say what the citing paper says it does?

Self-check

Percentages, sums and reported differences re-computed from the paper’s own numbers.

The self-check needs the paper’s full text.

Citations

Cites

Show all 40 references

Research works printed but not linked: 2

  1. Grimnes, S. & Martinsen, O. G. Bioimpedance and bioelectricity basics. (Academic press, 2011).
  2. Kireev, D. et al. Continuous cuffless monitoring of arterial blood pressure via graphene bioimpedance tattoos. Nat. Nanotechnol. 17, 864–870 (2022). · DOI

Cited by

Sorted by citations

See all 104

Metadata

Authors
Sel, K., Osman, D., Huerta, N., Edgar, A., Pettigrew, R. I., & Jafari, R.
Affiliations
Texas A&M University (US)
Corresponding author
Jafari, Roozbeh
Venue
npj Digital Medicine
Published
2023-03-30
Volume
6
Issue
1
Pages
59-59
ISSN
2398-6352 (ISSN-L)
OpenAlex
W4361279210
Cited by
100
References
40
Citations by year
2026: 23 · 2025: 41 · 2024: 25 · 2023: 11
FWCI
7.88
Type
journal article
Language
en
Open access
Locations
  • npj Digital Medicine (publishedVersion, cc-by)
  • PubMed Central (publishedVersion, cc-by)
  • PubMed (publishedVersion)
  • DOAJ (DOAJ: Directory of Open Access Journals) (submittedVersion, cc-by-sa)
Funders
  • U.S. Department of Health & Human Services | NIH | National Heart, Lung, and Blood Institute (1R01HL151240)
  • U.S. Department of Health & Human Services | NIH | National Institute of Biomedical Imaging and Bioengineering (1R01EB028106)
Topics
  • Physical Sciences › Engineering › Biomedical Engineering › Non-Invasive Vital Sign Monitoring
  • Physical Sciences › Engineering › Electrical and Electronic Engineering › Electrical and Bioimpedance Tomography
  • Physical Sciences › Engineering › Biomedical Engineering › Advanced Sensor and Energy Harvesting Materials
Keywords
cuffless blood pressure measurement, bioimpedance, smart rings, continuous blood pressure estimation, electrode placement optimization, cardiovascular monitoring

About these checks

Registry, retraction, Cites and statistics results are computed, not judged, with one exception: a printed reference that no index lists is read once by a model before it counts as a citation error. Claims are extracted by a model and kept only when their quote appears verbatim in the text; each cited source is then checked, with a model’s help, for whether it says what the claim relies on. Those verdicts can be wrong — read the claim’s quote and the cited source before relying on one.

Statistics and arithmetic are recomputed, not judged.

Confidence bands are shown only for fields calibrated on our annotated test set. None is calibrated yet, so no band is shown.

What counts as a claim ›How we measure confidence ›How we check this ›

Are you an author, or do you see a problem with this page? Request a review