CoChat

An integrative data-driven model simulating C. elegans brain, body and environment interactions

Open access
Zhao, Mengdi, Wang, Ning, Jiang, Xinrui, Ma, Xiaoyang, Ma, Haixin, He, Gan, Du, Kai, Ma, Lei, Huang, Tiejun · 2024 · Nature Computational Science

Published version of a preprint

The DOI matches its Crossref record; 72 of the 72 references it cites were found in a registry or an index.

Abstract

The behavior of an organism is influenced by the complex interplay between its brain, body and environment. Existing data-driven models focus on either the brain or the body–environment. Here we present BAAIWorm, an integrative data-driven model of Caenorhabditis elegans, which consists of two submodels: the brain model and the body–environment model. The brain model was built by multicompartment models with realistic morphology, connectome and neural population dynamics based on experimental data. Simultaneously, the body–environment model used a lifelike body and a three-dimensional physical environment. Through the closed-loop interaction between the two submodels, BAAIWorm reproduced the realistic zigzag movement toward attractors observed in C. elegans. Leveraging this model, we investigated the impact of neural system structure on both neural activities and behaviors. Consequently, BAAIWorm can enhance our understanding of how the brain controls the body to interact with its surrounding environment. BAAIWorm is an integrative data-driven model of C. elegans that simulates interactions between the brain, body and environment. The biophysically detailed neuronal model is capable of replicating the zigzag movement observed in this species.

Overview

The claims and statistics of this paper haven’t been checked yet.

Free: it reads the open-access text and checks the first 5 claims that cite a source we can check. Create a free account to check every claim.

A few free checks a day · papers already verified open instantly · results are public

Integrity signals

Registry

Crossref · 10.1038/s43588-024-00738-w

Cites

72 of 72 references verified0 citation errors · 0 not checkable

Statistics

Figures

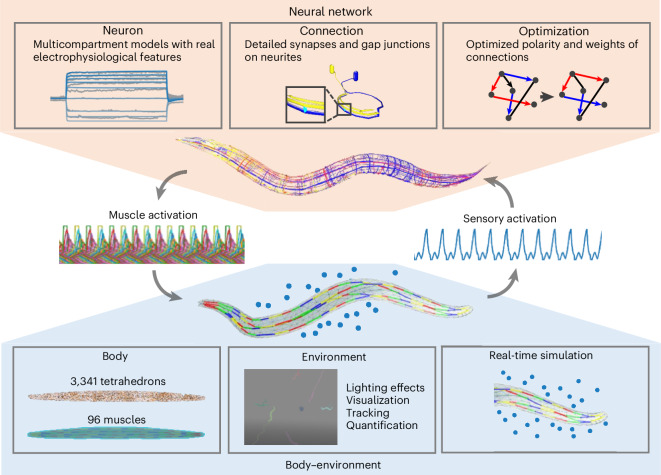
Fig. 1 Overview of BAAIWorm. BAAIWorm comprises two submodels: the neural network model and the body–environment model. The neural network model is biophysically detailed. Its neuron models are multicompartmental, exhibiting electrophysiological features similar to real C. elegans neurons. These neuron models are connected by synapses and gap junctions on neurites. An optimization tool is used to tune the weights and polarities of these connections. The body–environment model consists of a biomechanical body, a 3D fluid environment and a real-time simulation engine. The soft body is constructed using 3,341 tetrahedrons, with 96 muscles arranged from head to tail as actuators. The large-scale 3D environment allows the integration of various agents and elements including C. elegans, Escherichia coli (food) and fluid, and it provides a range of auxiliary tools for various lighting effects, visualization, tracking and behavior analysis. Real-time simulation is achieved through a FEM solver and simplified hydrodynamics. To achieve foraging behavior in C. elegans, the neural network senses the attractor’s concentration in the environment, performs neural computations to control muscles’ contraction and relaxation, and ultimately deforms the body to propel it toward the attractor.
Fig. 1 Overview of BAAIWorm. BAAIWorm comprises two submodels: the neural network model and the body–environment model. The neural network model is biophysically detailed. Its neuron models are multicompartmental, exhibiting electrophysiological features similar to real C. elegans neurons. These neuron models are connected by synapses and gap junctions on neurites. An optimization tool is used to tune the weights and polarities of these connections. The body–environment model consists of a biomechanical body, a 3D fluid environment and a real-time simulation engine. The soft body is constructed using 3,341 tetrahedrons, with 96 muscles arranged from head to tail as actuators. The large-scale 3D environment allows the integration of various agents and elements including C. elegans, Escherichia coli (food) and fluid, and it provides a range of auxiliary tools for various lighting effects, visualization, tracking and behavior analysis. Real-time simulation is achieved through a FEM solver and simplified hydrodynamics. To achieve foraging behavior in C. elegans, the neural network senses the attractor’s concentration in the environment, performs neural computations to control muscles’ contraction and relaxation, and ultimately deforms the body to propel it toward the attractor.CC BY-NC-ND · PubMed Central
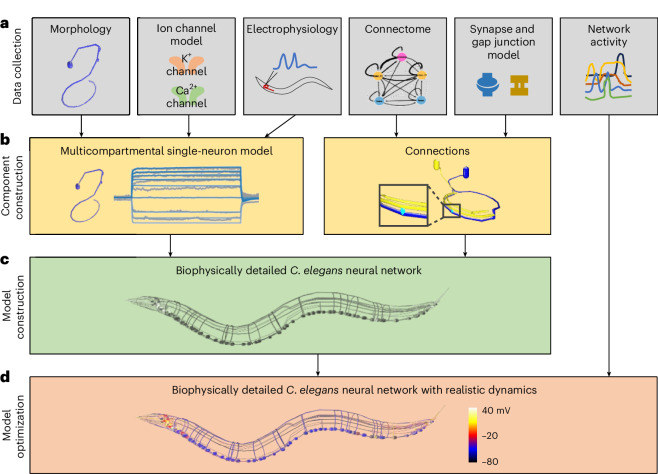
Fig. 2 Construction of biophysically detailed neural network model of C. elegans. a, Experimental data collection to constrain models. These data include neural morphologies, ion channel models, electrophysiological recordings of single neurons, connectome, connection models and neural network activities. b, The construction of multicompartmental neuron models and connection models (synapses and gap junctions). c, The biophysically detailed C. elegans neural network model without functional neural activities. d, Optimization of the biophysically detailed C. elegans neural network model to achieve realistic network dynamics. Neurons are color-coded to represent membrane potential.
Fig. 2 Construction of biophysically detailed neural network model of C. elegans. a, Experimental data collection to constrain models. These data include neural morphologies, ion channel models, electrophysiological recordings of single neurons, connectome, connection models and neural network activities. b, The construction of multicompartmental neuron models and connection models (synapses and gap junctions). c, The biophysically detailed C. elegans neural network model without functional neural activities. d, Optimization of the biophysically detailed C. elegans neural network model to achieve realistic network dynamics. Neurons are color-coded to represent membrane potential.CC BY-NC-ND · PubMed Central
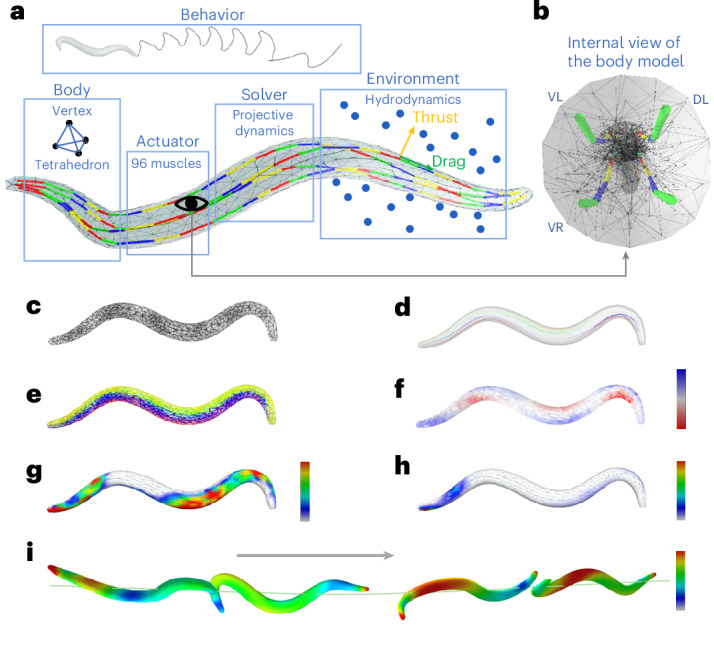
Fig. 3 A biomechanical body model of C. elegans. a, A schematic diagram of the C. elegans body model. The body was composed of tetrahedrons. Ninety-six muscle cells along four muscle strings served as actuators for soft-body deformation. Different colors on muscles indicate distinct muscle cells. The body was situated in a large 3D fluid environment and could move in the environment. Projective dynamics functions were used as the soft-body solver, and simplified hydrodynamics calculated thrust force and drag force on the body surface. b, An internal view of the body model, consisting of four muscle strings: VR, VL, DR and DL. c, The triangulated tetrahedron mesh of the body. d, Four muscle strings: VR (green), VL (yellow), DR (red) and DL (blue). The color intensity reflects the strength of muscle contraction, with high intensity indicating contraction and transparent intensity indicating relaxation. e, Tetrahedrons driven by four muscle strings: VR (green), VL (yellow), DR (red) and DL (blue). f, Deformation of the soft body. Blue tetrahedrons are increasing their volume whereas red ones are decreasing. g,h, The thrust force (g) and drag force (h) on the body surface. Red indicates strong force, and blue indicates weak force. i, Positions and velocities of the body at four moments. The body was moving from left to right. Color indicates velocities, with red representing fast and blue representing slow.
Fig. 3 A biomechanical body model of C. elegans. a, A schematic diagram of the C. elegans body model. The body was composed of tetrahedrons. Ninety-six muscle cells along four muscle strings served as actuators for soft-body deformation. Different colors on muscles indicate distinct muscle cells. The body was situated in a large 3D fluid environment and could move in the environment. Projective dynamics functions were used as the soft-body solver, and simplified hydrodynamics calculated thrust force and drag force on the body surface. b, An internal view of the body model, consisting of four muscle strings: VR, VL, DR and DL. c, The triangulated tetrahedron mesh of the body. d, Four muscle strings: VR (green), VL (yellow), DR (red) and DL (blue). The color intensity reflects the strength of muscle contraction, with high intensity indicating contraction and transparent intensity indicating relaxation. e, Tetrahedrons driven by four muscle strings: VR (green), VL (yellow), DR (red) and DL (blue). f, Deformation of the soft body. Blue tetrahedrons are increasing their volume whereas red ones are decreasing. g,h, The thrust force (g) and drag force (h) on the body surface. Red indicates strong force, and blue indicates weak force. i, Positions and velocities of the body at four moments. The body was moving from left to right. Color indicates velocities, with red representing fast and blue representing slow.CC BY-NC-ND · PubMed Central
Fig. 4 Quantification of the body’s behavior. a, A schematic diagram of TBRCS to quantify behavior stably. The standard body and SBCS are depicted on the left. The target body and TBRCS are illustrated on the right. Matching points (magenta dots) are positioned on both the standard and target body. The magenta lines link the corresponding points on two body. The transformation matrix M is obtained through singular value decomposition, enabling the conversion from SBCS to TBRCS. The trajectory of the target body center (orange line) exhibits a zigzag pattern, whereas the trajectory of TBRCS (green line) is smooth. b, Tracking body movement with TBRCS. Seventeen tracking points were defined on the surface of both the standard body and the target body. The magenta lines represent relative positions, while the blue arrows indicate relative velocities. Coordinate systems of the head on standard body and target body are drawn out to display translation and rotation of the head on target body. c, Trajectories of 17 tracking points on the body. d, Steering angle θ of the body. The velocity vector is depicted as the yellow arrow, and the X, Y and Z axes of TBRCS are represented by red, green and blue arrows, respectively. θ is defined as the angle between the red arrow and the yellow arrow and remains stable over time. e,f, Relative positions (e) and velocities (f) of 17 tracking points on the body during the movement. Source data
Fig. 4 Quantification of the body’s behavior. a, A schematic diagram of TBRCS to quantify behavior stably. The standard body and SBCS are depicted on the left. The target body and TBRCS are illustrated on the right. Matching points (magenta dots) are positioned on both the standard and target body. The magenta lines link the corresponding points on two body. The transformation matrix M is obtained through singular value decomposition, enabling the conversion from SBCS to TBRCS. The trajectory of the target body center (orange line) exhibits a zigzag pattern, whereas the trajectory of TBRCS (green line) is smooth. b, Tracking body movement with TBRCS. Seventeen tracking points were defined on the surface of both the standard body and the target body. The magenta lines represent relative positions, while the blue arrows indicate relative velocities. Coordinate systems of the head on standard body and target body are drawn out to display translation and rotation of the head on target body. c, Trajectories of 17 tracking points on the body. d, Steering angle θ of the body. The velocity vector is depicted as the yellow arrow, and the X, Y and Z axes of TBRCS are represented by red, green and blue arrows, respectively. θ is defined as the angle between the red arrow and the yellow arrow and remains stable over time. e,f, Relative positions (e) and velocities (f) of 17 tracking points on the body during the movement. Source dataCC BY-NC-ND · PubMed Central
Fig. 5 The closed-loop 3D simulation of C. elegans locomotion behavior. a, The information flow diagram of the closed-loop interaction between the neural network model and the body–environment model. b, A comparison of the C. elegans trajectory during forward locomotion in the simulation (left) and the experiment (right). c, The input current injected to sensory neurons during locomotion. d, Left: the neural network model of C. elegans. Right: the membrane potentials of all the motor neurons in the model during locomotion. e. Left: the body model with 96 muscle cells. Right: the activation signals of all muscle cells during locomotion. Panel b (right) reproduced with permission from ref. 44, Elsevier. Source data
Fig. 5 The closed-loop 3D simulation of C. elegans locomotion behavior. a, The information flow diagram of the closed-loop interaction between the neural network model and the body–environment model. b, A comparison of the C. elegans trajectory during forward locomotion in the simulation (left) and the experiment (right). c, The input current injected to sensory neurons during locomotion. d, Left: the neural network model of C. elegans. Right: the membrane potentials of all the motor neurons in the model during locomotion. e. Left: the body model with 96 muscle cells. Right: the activation signals of all muscle cells during locomotion. Panel b (right) reproduced with permission from ref. 44, Elsevier. Source dataCC BY-NC-ND · PubMed Central
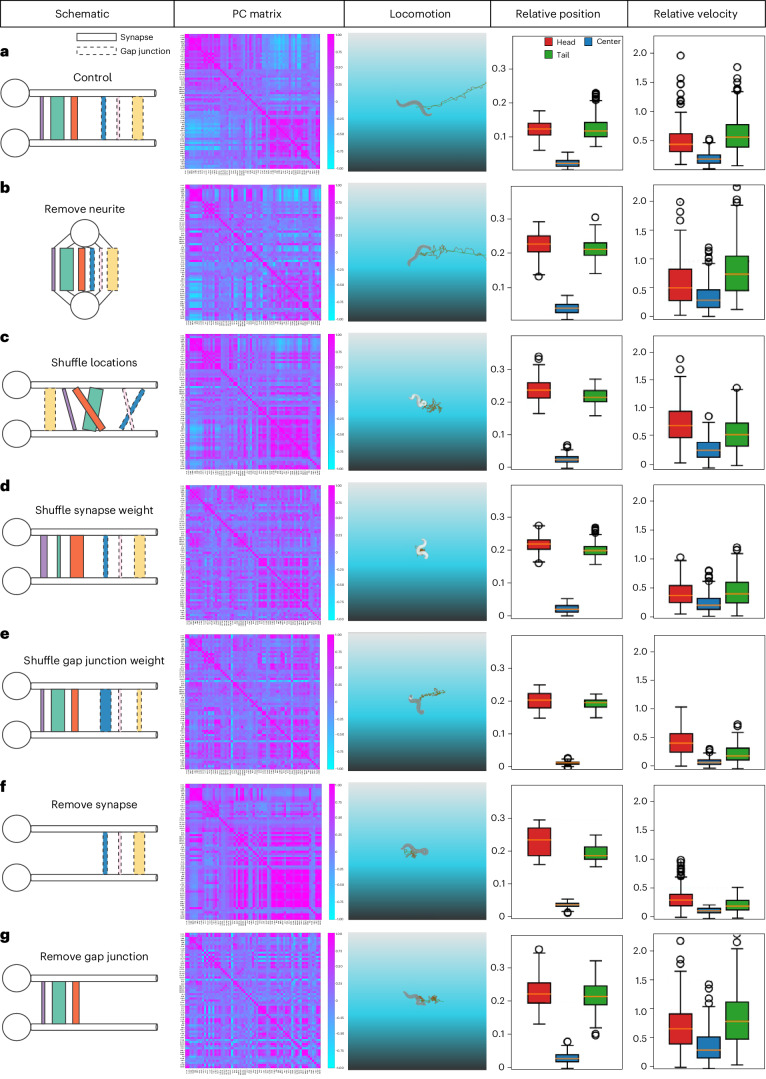
Fig. 6 Synthetic perturbation of on the neural network model in BAAIWorm. a, Column 1: a schematic diagram illustrating connections between two neurons in the neural network model. The ball and stick denote soma and neurite, respectively. The rectangles with solid and dashed lines indicate synapses and gap junctions. The rectangles with different colors represent different connections. The width of rectangles signifies connection weights. The depicted connections between this neuron pair represent all connections in the neural network model. Column 2: a Pearson correlation matrix of neurons during simulation of the neural network model. Column 3: locomotion behavior of the C. elegans body controlled by the neural network model in column 1. Columns 4 and 5: the relative position and velocity of 3D tracking points on the head (red), center (blue) and tail (green) of the C. elegans body during movement (Euclidean distance). n = 200, time step 0.1 s. Each point represents one relative velocity exported at each time step. These data are replicable using our code once the random seed is fixed, regardless of the number of replications. The bottom, middle and top lines of the box plot respectively indicate the 25th, 50th (median) and 75th percentiles. The whiskers extend to the minima and maxima within 1.5 times the range between the 25th and 75th percentiles from the bottom and top bounds of the box plot. Flier points are those past the end of the whiskers. b–g, Diagrams represented as in (a), but with different perturbation types: removal of neurites from all neurons in the neural network model, relocating connections onto the soma (b); shuffling the location of connections on neurites while fixing source and target neurons (c); shuffling the weights of synapses while fixing their locations (d); shuffling the weights of gap junctions while fixing their locations (e); removal of all synapses in the neural network model (f); and removal of all gap junctions in the neural network model (g). These perturbations are sequenced on the basis of their distance to the control group in terms of the Pearson correlation matrix (b: closest, g: farthest). Source data
Fig. 6 Synthetic perturbation of on the neural network model in BAAIWorm. a, Column 1: a schematic diagram illustrating connections between two neurons in the neural network model. The ball and stick denote soma and neurite, respectively. The rectangles with solid and dashed lines indicate synapses and gap junctions. The rectangles with different colors represent different connections. The width of rectangles signifies connection weights. The depicted connections between this neuron pair represent all connections in the neural network model. Column 2: a Pearson correlation matrix of neurons during simulation of the neural network model. Column 3: locomotion behavior of the C. elegans body controlled by the neural network model in column 1. Columns 4 and 5: the relative position and velocity of 3D tracking points on the head (red), center (blue) and tail (green) of the C. elegans body during movement (Euclidean distance). n = 200, time step 0.1 s. Each point represents one relative velocity exported at each time step. These data are replicable using our code once the random seed is fixed, regardless of the number of replications. The bottom, middle and top lines of the box plot respectively indicate the 25th, 50th (median) and 75th percentiles. The whiskers extend to the minima and maxima within 1.5 times the range between the 25th and 75th percentiles from the bottom and top bounds of the box plot. Flier points are those past the end of the whiskers. b–g, Diagrams represented as in (a), but with different perturbation types: removal of neurites from all neurons in the neural network model, relocating connections onto the soma (b); shuffling the location of connections on neurites while fixing source and target neurons (c); shuffling the weights of synapses while fixing their locations (d); shuffling the weights of gap junctions while fixing their locations (e); removal of all synapses in the neural network model (f); and removal of all gap junctions in the neural network model (g). These perturbations are sequenced on the basis of their distance to the control group in terms of the Pearson correlation matrix (b: closest, g: farthest). Source dataCC BY-NC-ND · PubMed Central

Verification

Claims the paper makes

The claims and statistics of this paper haven’t been checked yet.

Free: it reads the open-access text and checks the first 5 claims that cite a source we can check. Create a free account to check every claim.

A few free checks a day · papers already verified open instantly · results are public

Self-check

Percentages, sums and reported differences re-computed from the paper’s own numbers.

The self-check needs the paper’s full text.

Citations

Cites

Show all 72 references

Research works printed but not linked: 1

  1. Sheng, K. et al. Distilling multi-scale neural mechanisms from diverse unlabeled experimental data using deep domain-adaptive inference framework. Preprint at bioRxiv https://www.biorxiv.org/content/10.1101/2022.10.03.510694v2 (2023). · doi:10.1101/2022.10.03.510694v2

Cited by

See all 29

Metadata

Authors
Zhao, M., Wang, N., Jiang, X., Ma, X., Ma, H., He, G., Du, K., Ma, L., & Huang, T.
Affiliations
  • Beijing Academy of Artificial Intelligence (CN)
  • Peking University (CN)
Venue
Nature Computational Science
Published
2024-12-16
Volume
4
Issue
12
Pages
978-990
ISSN
2662-8457 (ISSN-L)
OpenAlex
W4405419531
Cited by
29
References
72
Citations by year
2026: 18 · 2025: 11
FWCI
7.03
Type
journal article
Language
en
Open access
Licence
Locations
  • Nature Computational Science (publishedVersion, cc-by-nc-nd)
  • Research Square (acceptedVersion, cc-by)
  • PubMed Central (publishedVersion, cc-by-nc-nd)
  • PubMed (publishedVersion)
Topics
  • Life Sciences › Neuroscience › Cognitive Neuroscience › Neural dynamics and brain function
  • Life Sciences › Neuroscience › Cellular and Molecular Neuroscience › Neurobiology and Insect Physiology Research
  • Social Sciences › Education › Undergraduate Neuroscience Education and Research
Keywords
Caenorhabditis elegans, brain-body-environment interaction, connectome, multicompartment neuron models, neural population dynamics, attractor behavior, closed-loop simulation, locomotor activity
MeSH terms
Animals, Behavior, Animal, Brain, Computer Simulation, Environment, Models, Neurological, Caenorhabditis elegans, Connectome

About these checks

Registry, retraction, Cites and statistics results are computed, not judged, with one exception: a printed reference that no index lists is read once by a model before it counts as a citation error. Claims are extracted by a model and kept only when their quote appears verbatim in the text; each cited source is then checked, with a model’s help, for whether it says what the claim relies on. Those verdicts can be wrong — read the claim’s quote and the cited source before relying on one.

Statistics and arithmetic are recomputed, not judged.

Confidence bands are shown only for fields calibrated on our annotated test set. None is calibrated yet, so no band is shown.

What counts as a claim ›How we measure confidence ›How we check this ›

Are you an author, or do you see a problem with this page? Request a review

How to cite

Cite CoChat for the checks on this page, and the paper for its own findings.

This page
CoChat. (2026). Citation check: An integrative data-driven model simulating C. elegans brain, body and environment interactions. https://app.cochat.ai/papers/10.1038/s43588-024-00738-w
The paper
Zhao, M., Wang, N., Jiang, X., Ma, X., Ma, H., He, G., Du, K., Ma, L., & Huang, T. (2024). An integrative data-driven model simulating C. elegans brain, body and environment interactions. Nature Computational Science. https://doi.org/10.1038/s43588-024-00738-w

Data sources

Bibliographic data: Semantic Scholar, OpenAlex, Crossref.

Contains information from the Semantic Scholar Academic Graph Datasets, made available under the ODC Attribution License (ODC-BY 1.0).

Semantic Scholar’s data is described in: Kinney, R., et al. (2023). The Semantic Scholar Open Data Platform. arXiv:2301.10140.