

The DOI matches its Crossref record; 102 of the 102 references it cites were found in a registry or an index; 81 of the 110 sources its claims cite were checked for support.
Personalized machine learning guided intervention for optimizing lifestyle behaviors in depression: a pilot study
Open accessAbstract
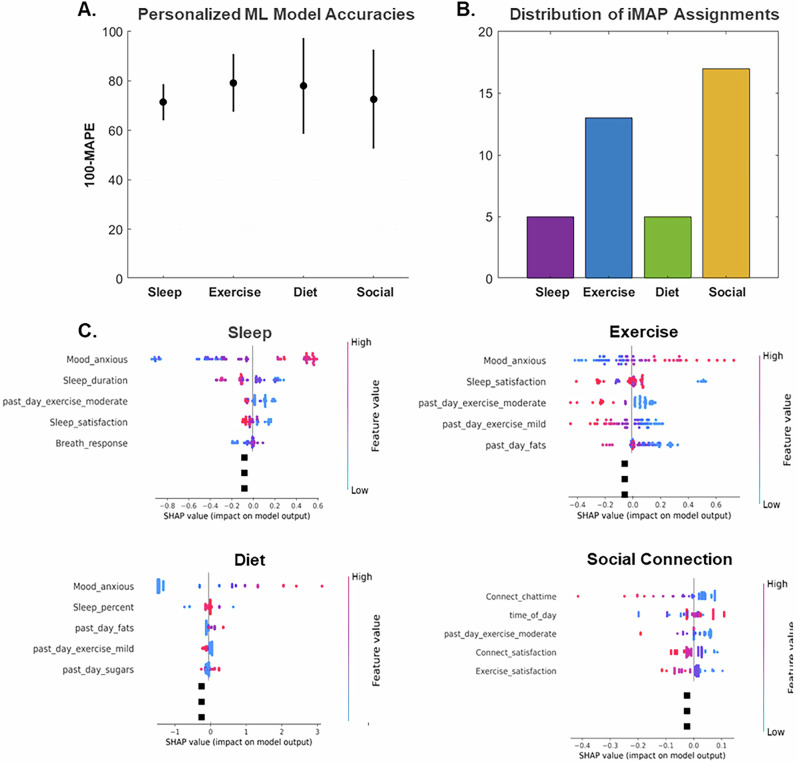
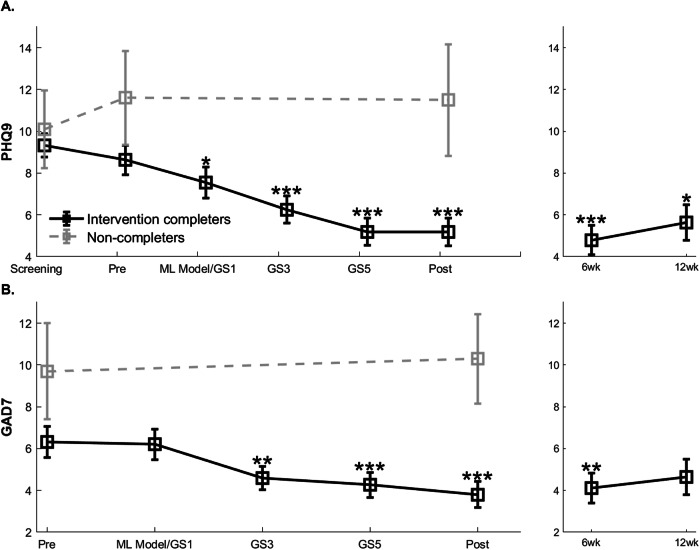
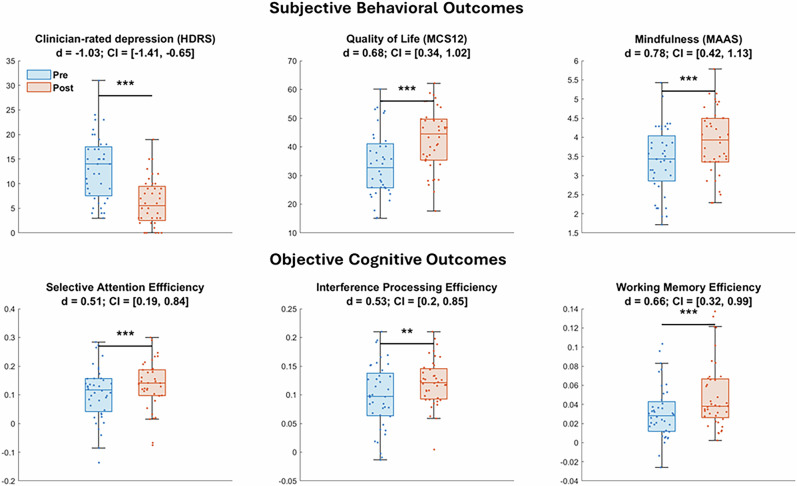
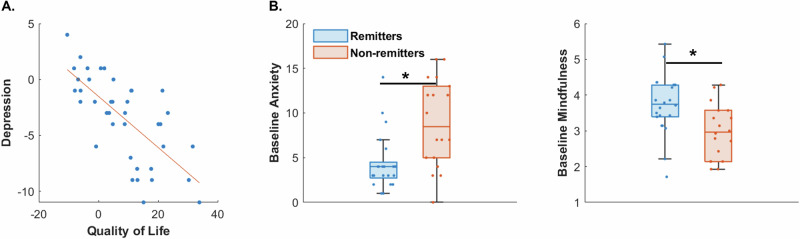
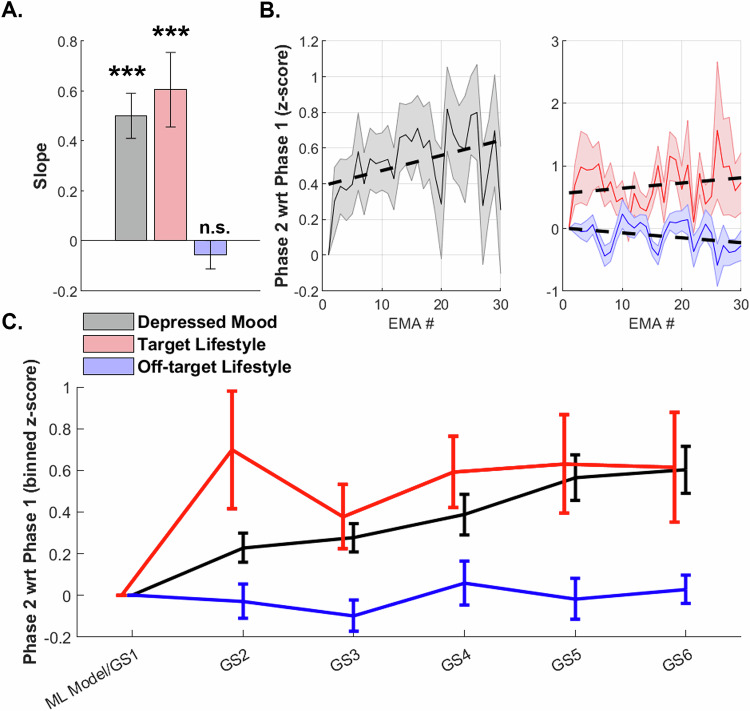
Personalized data-driven interventions for depression are much needed. Here, we leveraged N-of-1 machine learning (ML) to optimally target behavioral lifestyle interventions for depression. 50 individuals with mild-to-moderate depression enrolled in the single-arm, open-label Personalized Mood Augmentation (PerMA) pilot clinical trial (NCT05662254). Participants completed a two-week digital monitoring phase using smartphone-based ecological momentary assessments (EMAs, 4×/day) plus smartwatch tracking of mood and lifestyle factors (sleep/exercise/diet/social connection). Personalized ML models were generated from these data to identify lifestyle factors most predictive of individual mood, and results were translated to individualized mood augmentation plans (iMAPs) implemented by participants for six weeks with once-a-week health coach guidance. Intervention completers (n = 40) showed significant reduction in depression symptoms (primary outcome self-rated PHQ9 −3.5 ± 3.8, Cohen’s d = −0.89, CI [−1.25 −0.53], p < 0.001; clinician-rated HDRS −7.2 ± 6.8, d = −1.03, CI [−1.41 −0.65], p < 1E-6) with benefits sustained up to 12-week follow-up. Co-morbid anxiety was also significantly reduced (GAD7: d = −0.85, CI [−1.2, −0.49], p < 0.001) and quality of life improved (d = 0.68, CI [0.33, 1.02], p < 0.001). Additionally, objective cognitive measures impacted in depression including selective attention (d = 0.51, CI [0.18, 0.84], p < 0.001), interference processing (d = 0.53, CI [0.2, 0.85], p < 0.01) and working memory (d = 0.66, CI [0.31, 0.99], p < 0.001) showed significant enhancement. EMA tracking confirmed that improvement in depressed mood was specifically predicted by improvement in individually targeted lifestyles (β = 0.4 ± 0.09, p < 0.0005). Finally, decision algorithms and a large-language-model (LLM) could match human coach-led iMAP assignment with up to 95% accuracy. The PerMA trial presents a personalized lifestyle intervention approach for depression and merits scale-up and RCT testing to establish clinical efficacy. PERMA was registered with ClinicalTrials.gov under registry number NCT05662254.
Overview
CoChat Summary
## TL;DR
This single-arm pilot study tested a personalized, machine-learning-guided lifestyle intervention for 50 people with mild-to-moderate depression. In 40 intervention completers, depression, anxiety, quality of life, mindfulness, and several cognitive measures improved, but the authors note that a randomized controlled trial is still needed.
## Key findings
- Among trial completers (n = 40), PHQ9 depression scores declined significantly from pre- to post-intervention by −3.5 ± 3.8 with d = −0.89 and p < 1E-13; 22/40 (55%) reached remission (PHQ9 < 5) post-intervention.
- Depression improvement was sustained at follow-up: 6 weeks d = −1.06 (n = 28) and 12 weeks d = −0.52 (n = 22).
- Anxiety also improved in completers: GAD7 changed by −2.5 ± 3 with d = −0.85 and p < 1E-5; improvement persisted at 6 weeks (d = −0.59) but not 12 weeks (d = −0.3, p = 0.16).
- Secondary outcomes improved post-intervention in completers: HDRS d = −1.03, MCS12 d = 0.68, MAAS d = 0.78, and cognition improved for selective attention (d = 0.51), interference processing (d = 0.53), and working memory (d = 0.66); emotion bias did not improve (p = 0.3).
- EMA analyses found that improvement in depressed mood was linked to improvement in the individually targeted lifestyle domain: the regression coefficient for the target-domain slope was β = 0.4 ± 0.09, p < 0.0005, while the off-target slope was not significant (p > 0.1).
- Automated assignment methods matched human coach decisions well: the naïve decision algorithm matched in 87.5% of cases (35/40), the LLM in 92.5%, and the fine-tuned decision algorithm in 95%.
## Methods
- Design: Single-arm, open-label pilot trial (PerMA; NCT05662254) with two phases: about 2 weeks of digital monitoring followed by 6 weeks of individualized coach-guided intervention.
- Sample/data: 50 adults from the San Diego community with mild-to-moderate depression (PHQ9 5–17; mean age 43.3 ± 16.1, 12 males); data collection ran from Winter 2022–Fall 2024. Participants completed smartphone EMAs and wore a smartwatch; total digital monitoring aimed for 60 EMA sessions.
- Analysis: Personalized N-of-1 ML models used SHAP to rank lifestyle predictors of depressed mood and guide intervention domain assignment (sleep, exercise, diet, social connection). Outcomes were tested mainly with Friedman repeated-measures tests, signed-rank tests, robust linear regression, ANOVA/paired tests, and effect sizes reported as Cohen’s d with 95% CIs.
## Limitations
- The paper explicitly states the primary limitation is the lack of a randomized control group, so it cannot establish a causal intervention effect.
- The authors also state a modest sample size of 40 completers; this limits statistical power and generalizability.
- Evident from the text: the study is single-arm and open-label, so results may be influenced by expectancy, regression to the mean, or other non-specific effects; follow-up data were also incomplete (30% and 45% missing at 6 and 12 weeks, respectively).
Model-written summary. Check it against the paper before relying on it.
Integrity signals
Registry
Cites
Statistics
Figures

Verification
Claims the paper makes
26 Valid · 3 Not valid · 6 Not checked · 68 Own results and interpretations
Some cited sources support this claim and some don’t — read each source’s verdict below.
In the paper
“Yet, of note, all of these personalized intervention studies use predictive models based on multi-subject data.”
§ Personalized machine learning guided intervention for optimizing lifestyle behaviors in depression: a pilot study > Introduction
What the sources say
- Disputedcites [20] Xiao S, Gaier ED, Mazow ML, Stout AU, Travers DA, Angjeli E, et al. Improved adherence and treatment outcomes with an engaging, personalized digital therapeutic in amblyopia. Sci. Rep. 2020;10:8328. sourceExperimental — accuracy not yet measured
The Results – Therapeutic Design, ‘Computational algorithms’ section describes personalization through patient-selected videos and a prescription identifying the amblyopic eye. It says the treatment protocol was the same for all patients, rather than describing a predictive model based on multi-subject data. No page number is available in our copy. (LLM, conf=0.86)
Checked by a reasoning model — may be wrong.
- Not checked — no full text of the sourcecites [21] Kulzer B, Daenschel W, Daenschel I, Schramm W, Messinger D, Weissmann J, et al. Integrated personalized diabetes management improves glycemic control in patients with insulin-treated type 2 diabetes: results of the PDM-ProValue study program. Diabetes Res. Clin. Pract. 2018;144:200–12. source
- Partly supportedcites [22] Linn AJ, van Dijk L, van Weert J, Gebeyehu BG, van Bodegraven AA, Smit EG. Creating a synergy effect: a cluster randomized controlled trial testing the effect of a tailored multimedia intervention on patient outcomes. Patient Educ. Couns. 2018;101:1419–26. sourceExperimental — accuracy not yet measured
The Introduction and Conclusion describe this study as testing a tailored intervention, and the Discussion says its content was tailored to patients’ self-reported adherence barriers. The paper does not say that its intervention used a predictive model based on multi-subject data, or establish that all personalized intervention studies do so. (LLM, conf=0.84)
- Disputedcites [23] Chiang P-H, Wong M, Dey S. Using wearables and machine learning to enable personalized lifestyle recommendations to improve blood pressure. IEEE J. Transl. Eng. Health Med. 2021;9:1–13. sourceExperimental — accuracy not yet measured
The Results and Discussion, under “Experiment Setting,” says each person’s blood-pressure–lifestyle model was trained only on that person’s data. The Conclusion also describes personalized recommendations based on an individual model, making this study a counterexample to the claim that all such studies use models trained on multi-subject data. (LLM, conf=0.92)
Checked by a reasoning model — may be wrong.
- Partly supportedcites [24] van Bronswijk SC, DeRubeis RJ, Lemmens L, Peeters F, Keefe JR, Cohen ZD, et al. Precision medicine for long-term depression outcomes using the Personalized Advantage Index approach: cognitive therapy or interpersonal psychotherapy? Psychol. Med. 2021;51:279–89. sourceExperimental — accuracy not yet measured
The Methods (Statistical analyses) describe a personalized treatment model trained on data from multiple participants: each individual's outcomes were predicted using model weights from the other four groups of the sample. The Introduction names other multivariate approaches, but our copy does not establish that all personalized intervention studies use models based on multi-subject data. (LLM, conf=0.83)
- Not checked — no full text of the sourcecites [25] Nye A, Delgadillo J, Barkham M. Efficacy of personalized psychological interventions: a systematic review and meta-analysis. J. Consult. Clin. Psychol. 2023;91:389–97. source
plain- Asserted: passes — The authors put it forward as true.
- Checkable: passes — It can be checked against evidence.
- Load-bearing: passes — The paper’s conclusions depend on it.
- Based: passes — The paper gives a reason why it holds.
- Disputed
The cited sources support only part of this claim — read each source’s verdict below.
In the paper
“Consequently, a single lifestyle treatment domain is unlikely to be universally beneficial, and these studies fail to account for individual differences that may favor one behavioral health solution over another [17–19].”
§ Personalized machine learning guided intervention for optimizing lifestyle behaviors in depression: a pilot study > Introduction
What the sources say
- Supportedcites [17] Shah RV, Grennan G, Zafar-Khan M, Alim F, Dey S, Ramanathan D, et al. Personalized machine learning of depressed mood using wearables. Transl. Psychiatry. 2021;11:338. source
The Introduction (page not provided) says that not all lifestyle interventions work for all depressed patients and that responses to the same behavioral recommendations vary substantially between individuals. The Discussion (page not provided) contrasts this variability with standard treatment studies and advocates personalized protocols. (LLM, conf=0.88)
- Supportedcites [18] Nan J, Herbert MS, Purpura S, Henneken AN, Ramanathan D, Mishra J. Personalized machine learning-based prediction of wellbeing and empathy in healthcare professionals. Sensors. 2024;24:2640. source
The Introduction says previous interventions focused on group-level effects even though factors affecting wellbeing vary by individual, so personalized plans may identify more effective interventions. The Discussion gives a concrete example: targeting social connection would likely be suboptimal for 3 of 12 participants. (LLM, conf=0.90)
- Partly supportedcites [19] Wittenborn AK, Hosseinichimeh N. Exploring personalized psychotherapy for depression: a system dynamics approach. PLoS One. 2022;17:e0276441. sourceExperimental — accuracy not yet measured
The Introduction says responses to depression treatment vary widely and that a poor response to one treatment does not predict a poor response to another. The Discussion supports selecting psychotherapy for heterogeneous patients. The paper does not, however, establish that the behavioral-intervention studies described in the citing sentence assigned treatments homogeneously or failed to account for individual differences across lifestyle treatment domains. (LLM, conf=0.84)
plain- Asserted: passes — The authors put it forward as true.
- Checkable: passes — It can be checked against evidence.
- Load-bearing: passes — The paper’s conclusions depend on it.
- Based: passes — The paper gives a reason why it holds.
- Supported
The cited sources support only part of this claim — read each source’s verdict below.
In the paper
“Consequently, a single lifestyle treatment domain is unlikely to be universally beneficial, and these studies fail to account for individual differences that may favor one behavioral health solution over another [17–19].”
§ Personalized machine learning guided intervention for optimizing lifestyle behaviors in depression: a pilot study > Introduction
What the sources say
- Supportedcites [17] Shah RV, Grennan G, Zafar-Khan M, Alim F, Dey S, Ramanathan D, et al. Personalized machine learning of depressed mood using wearables. Transl. Psychiatry. 2021;11:338. source
The Introduction says that sleep, activity, mindfulness, and dietary interventions can benefit depressed patients, but that not all interventions work for all patients. It attributes this to substantial individual variability in response, supporting the claim that no single lifestyle treatment domain is likely to benefit everyone. (LLM, conf=0.93)
- Partly supportedcites [18] Nan J, Herbert MS, Purpura S, Henneken AN, Ramanathan D, Mishra J. Personalized machine learning-based prediction of wellbeing and empathy in healthcare professionals. Sensors. 2024;24:2640. sourceExperimental — accuracy not yet measured
The Introduction says that the factors affecting poor wellbeing vary by individual, and the Discussion says a social-connection intervention would likely be suboptimal for 3 of 12 participants. That supports the concern about a universally beneficial lifestyle domain, but the paper studies predictors of wellbeing in healthcare professionals, not the effectiveness of lifestyle treatments for depression. Page numbers are unavailable in our copy. (LLM, conf=0.86)
- Partly supportedcites [19] Wittenborn AK, Hosseinichimeh N. Exploring personalized psychotherapy for depression: a system dynamics approach. PLoS One. 2022;17:e0276441. sourceExperimental — accuracy not yet measured
The Introduction (page not provided) says responses to depression treatment vary widely and that poor response to one treatment does not predict poor response to another. This supports the general point that one treatment will not benefit everyone, but the paper addresses psychotherapy, not lifestyle treatment domains. (LLM, conf=0.85)
hedged- Asserted: passes — The authors put it forward as true.
- Checkable: passes — It can be checked against evidence.
- Load-bearing: passes — The paper’s conclusions depend on it.
- Based: passes — The paper gives a reason why it holds.
- Supported
The cited sources support only part of this claim — read each source’s verdict below.
In the paper
“Yet, a major limitation of these homogenously assigned (non-personalized) behavioral intervention studies is the heterogeneity across individuals of the specific lifestyle factors most closely linked to their depression.”
§ Personalized machine learning guided intervention for optimizing lifestyle behaviors in depression: a pilot study > Introduction
What the sources say
- Supportedcites [17] Shah RV, Grennan G, Zafar-Khan M, Alim F, Dey S, Ramanathan D, et al. Personalized machine learning of depressed mood using wearables. Transl. Psychiatry. 2021;11:338. source
The Introduction says the same behavioral recommendations do not work for all depressed patients because of substantial interindividual variability, motivating tailored treatment. The Discussion adds that personalized models revealed distinct predictors of depression for different individuals and that this variability is a problem for standard treatment studies. (LLM, conf=0.90)
- Partly supportedcites [18] Nan J, Herbert MS, Purpura S, Henneken AN, Ramanathan D, Mishra J. Personalized machine learning-based prediction of wellbeing and empathy in healthcare professionals. Sensors. 2024;24:2640. sourceExperimental — accuracy not yet measured
The Introduction says group-level interventions can miss individual differences, and the Discussion reports that the lifestyle features predicting wellbeing varied across participants. But this study modeled wellbeing and empathy in healthcare professionals, not which lifestyle factors were most closely linked to each person's depression; depressed mood was a predictor, not the outcome. (LLM, conf=0.90)
- Partly supportedcites [19] Wittenborn AK, Hosseinichimeh N. Exploring personalized psychotherapy for depression: a system dynamics approach. PLoS One. 2022;17:e0276441. sourceExperimental — accuracy not yet measured
The Introduction and Discussion (page numbers unavailable) describe widely varying responses to psychotherapy and support tailoring treatment to heterogeneous patients. The paper examines differences in stressors and rumination, but does not identify variation in specific lifestyle factors as a major limitation of uniformly assigned behavioral-intervention studies. (LLM, conf=0.84)
plainstates an association- Asserted: passes — The authors put it forward as true.
- Checkable: passes — It can be checked against evidence.
- Load-bearing: passes — The paper’s conclusions depend on it.
- Based: passes — The paper gives a reason why it holds.
- Supported
The cited sources that could be checked couldn’t confirm or dispute this claim.
In the paper
“We opted for 60-session models to minimize participant burden, as prior comparisons with 120-session models showed no significant gain in accuracy (MAPE difference = 1.5%, p = 0.3) [17].”
§ Personalized machine learning guided intervention for optimizing lifestyle behaviors in depression: a pilot study > Methods > Study procedure
What the sources say
- Could not verifycites [17] Shah RV, Grennan G, Zafar-Khan M, Alim F, Dey S, Ramanathan D, et al. Personalized machine learning of depressed mood using wearables. Transl. Psychiatry. 2021;11:338. sourceExperimental — accuracy not yet measured
The Methods (ML pipeline; page unavailable) report 120 planned MindLog assessments and an average of 93 completed per participant. The Results report MAPE for different modeling strategies, but our copy does not report a 60-versus-120-session comparison or the claimed 1.5% difference and p = 0.3 (searched: 60 sessions, 120-session comparison, and those statistics). (LLM, conf=0.76)
plain- Asserted: passes — The authors put it forward as true.
- Checkable: passes — It can be checked against evidence.
- Load-bearing: passes — The paper’s conclusions depend on it.
- Based: passes — The paper gives a reason why it holds.
- Could not verify
50 more claims · 9 with their cited sources checked
Create a free account to see all 103 claims and to verify the 1 reference still open.
- Probably not a substantial claim. 19
- It may state two separate claims as one. 36
- The quote only partly states this claim. 1
Self-check
Percentages, sums and reported differences re-computed from the paper’s own numbers.
Self-check results appear here once an independent check has confirmed them.
Cited works that were retracted
Works this paper cites that were later retracted, from the retraction notices publishers deposit. Major when the notice came out before this paper was published.
Rated major: it would touch a result — a value a result rests on, reported and recomputed p-values on opposite sides of the significance level, two passages that conflict with no sign which is right, or a cited work retracted before this paper was published.
In the paper
“Livingston G, Huntley J, Sommerlad A, Ames D, Ballard C, Banerjee S, et al. Dementia prevention, intervention, and care: 2020 report of the lancet commission. Lancet. 2020;396:413–46.”
Cited work 10.1016/s0140-6736(20)30367-6 · retracted 2023-05-01 · notice 10.1016/s2468-2667(23)00083-x · this paper published 2026-05-19
Citations
Cites
1 retracted
Dementia prevention, intervention, and care: 2020 report of the Lancet Commission
Livingston, G., Huntley, J., Sommerlad, A., Ames, D., Ballard, C., Banerjee, S., Brayne, C., Burns, A., Cohen-Mansfield, J., Cooper, C., et al. (2020) · The Lancet · doi:10.1016/s0140-6736(20)30367-6 · Cited by 10,430
RetractedThe PHQ-9: Validity of a brief depression severity measure
Kroenke, K., Spitzer, R. L., & Williams, J. B. W. (2001) · Journal of General Internal Medicine · doi:10.1046/j.1525-1497.2001.016009606.x · Cited by 44,910
Statistical power analyses using G∗Power 3.1: tests for correlation and regression analyses
Faul, F., Erdfelder, E., Buchner, A., & Lang, A.-G. (2009) · Behavior Research Methods · doi:10.3758/brm.41.4.1149 · Cited by 37,615 · cited 1×
“Participants also completed once-a-day EMAs (same as those in phase 1) over the 6 weeks to track progress.”
Hamilton, M. (1960) · Journal of Neurology, Neurosurgery & Psychiatry · doi:10.1136/jnnp.23.1.56 · Cited by 32,817 · cited 1×
“…at pre-and post-intervention time-points, outcome scores were acquired for clinician-rated depression on the Hamilton Depression Rating Scale (HDRS [48]), self-rated quality of life reported on the Short Form 12 Mental Component Summary (MCS12 [49]), and mindfulness self-rated per the Mindful…”
A Brief Measure for Assessing Generalized Anxiety Disorder: The GAD-7
Spitzer, R. L., Kroenke, K., Williams, J. B. W., & Löwe, B. (2006) · Archives of Internal Medicine · doi:10.1001/archinte.166.10.1092 · Cited by 31,765
The Montreal Cognitive Assessment, MoCA: a brief screening tool for mild cognitive impairment
Nasreddine, Z. S., Phillips, N. A., Bédirian, V., Charbonneau, S., Whitehead, V., Collin, I., Cummings, J. L., & Chertkow, H. (2005) · Journal of the American Geriatrics Society · doi:10.1111/j.1532-5415.2005.53221.x · Cited by 25,553 · cited 1×
“For participants 60 years of age and older, we additionally conducted the Montreal Cognitive Assessment (MoCA) and con fi rmed normal scores ≥ 26 [40].”
Statistical Power Analysis for the Behavioral Sciences
Cohen, J. (2013) · doi:10.4324/9780203771587 · Cited by 25,373
The benefits of being present: Mindfulness and its role in psychological well-being
Brown, K. W., & Ryan, R. M. (2003) · Journal of Personality and Social Psychology · doi:10.1037/0022-3514.84.4.822 · Cited by 13,448 · cited 1×
“If shown to be effective, such a personalized approach can be a promising way to remotely deliver scalable treatment for depression that is optimized to individual lifestyles.”
The Structured Clinical Interview for DSM-III-R (SCID): I: History, Rationale, and Description
Spitzer, R. L. (1992) · Archives of General Psychiatry · doi:10.1001/archpsyc.1992.01820080032005 · Cited by 4,336
Cognition and Depression: Current Status and Future Directions
Gotlib, I. H., & Joormann, J. (2010) · Annual Review of Clinical Psychology · doi:10.1146/annurev.clinpsy.121208.131305 · Cited by 2,420 · cited 2×
“Notably, while depression can be associated with cognitive de fi cits [31 – 37], there has been a lack of intervention studies in depression showing robust cognitive bene fi ts.”
Cited by
Individualized machine-learning predictions of pain intensity in chronic low back pain
Herbert, M. S., Nan, J., Fishbein, J. N., Bulls, H. W., Bustamante, S., Fikingas, S., Wang, Y., Ramanathan, D., & Mishra, J. (2026) · Journal of Pain · doi:10.1016/j.jpain.2026.106456
Self-citation
Metadata
- Authors
- Nan, J., Purpura, S., Jaiswal, S., Afshar, H., Maric, V., Manchanda, J. K., Taylor, C. T., Ramanathan, D., & Mishra, J.
- Affiliations
- University of California San Diego (US)
- Corresponding author
- Nan, Jason
- Mishra, Jyoti
- ORCID
- Venue
- NPP—Digital Psychiatry and Neuroscience
- Published
- 2026-05-19
- Volume
- 4
- Issue
- 1
- ISSN
- 2948-1570 (ISSN-L)
- PMC
- PMC13184138
- OpenAlex
- W7161581526
- Cited by
- 1
- References
- 92
- Citations by year
- 2026: 1
- FWCI
- 5.88
- Type
- journal article
- Language
- en
- Open access
- gold
- doi.org
- Licence
- cc-by
- creativecommons.org/licenses/by/4.0 (tdm)
- creativecommons.org/licenses/by/4.0 (vor)
- Locations
- NPP—Digital Psychiatry and Neuroscience (publishedVersion, cc-by)
- PubMed Central (publishedVersion, cc-by)
- PubMed (publishedVersion)
- DOAJ (DOAJ: Directory of Open Access Journals) (submittedVersion, cc-by-sa)
- Funders
- Hope for Depression Research Foundation (N/A)
- Topics
- Social Sciences › Psychology › Applied Psychology › Digital Mental Health Interventions
- Social Sciences › Psychology › Experimental and Cognitive Psychology › Mental Health Research Topics
- Social Sciences › Psychology › Experimental and Cognitive Psychology › Anxiety, Depression, Psychometrics, Treatment, Cognitive Processes
- Keywords
- depression, personalized interventions, lifestyle modification, ecological momentary assessment, health coaching, large language models, anxiety comorbidity, quality of life, cognitive function, sleep, physical activity, diet, social connectedness, digital mental health, PHQ-9, Hamilton Depression Rating Scale, GAD-7, working memory, selective attention
About these checks
Registry, retraction, Cites and statistics results are computed, not judged, with one exception: a printed reference that no index lists is read once by a model before it counts as a citation error. Claims are extracted by a model and kept only when their quote appears verbatim in the text; each cited source is then checked, with a model’s help, for whether it says what the claim relies on. Those verdicts can be wrong — read the claim’s quote and the cited source before relying on one.
The claim verdicts this report counts are experimental: their accuracy is not yet measured.
A language model drew the claims from the paper on 2026-10-09, under version 3 of the claim definition (model deepseek-v4.1-flash, prompt extract-v3).
A second model labelled each claim on 2026-10-09 (model jev-1.13-20260917, definition revision gold-guideline-v0.2).
Cited sources are checked with a language model’s help (gpt-6-sol).
Statistics and arithmetic are recomputed, not judged.
Confidence bands are shown only for fields calibrated on our annotated test set. None is calibrated yet, so no band is shown.
What counts as a claim ›How we measure confidence ›How we check this ›
Are you an author, or do you see a problem with this page? Request a review
How to cite
Cite CoChat for the checks on this page, and the paper for its own findings.
- This page
- CoChat. (2026). Citation check: Personalized machine learning guided intervention for optimizing lifestyle behaviors in depression: a pilot study. https://app.cochat.ai/papers/10.1038/s44277-026-00062-3
- The paper
- Nan, J., Purpura, S., Jaiswal, S., Afshar, H., Maric, V., Manchanda, J. K., Taylor, C. T., Ramanathan, D., & Mishra, J. (2026). Personalized machine learning guided intervention for optimizing lifestyle behaviors in depression: a pilot study. NPP—Digital Psychiatry and Neuroscience. https://doi.org/10.1038/s44277-026-00062-3
Data sources
Bibliographic data: Semantic Scholar, OpenAlex, Crossref.
Contains information from the Semantic Scholar Academic Graph Datasets, made available under the ODC Attribution License (ODC-BY 1.0).
Semantic Scholar’s data is described in: Kinney, R., et al. (2023). The Semantic Scholar Open Data Platform. arXiv:2301.10140.
