

The DOI matches its Crossref record; 207 of the 207 references it cites were found in a registry or an index; 70 of the 102 sources its claims cite were checked for support.
APOE from astrocytes restores Alzheimer’s Aβ-pathology and DAM-like responses in APOE deficient microglia
Open accessAbstract
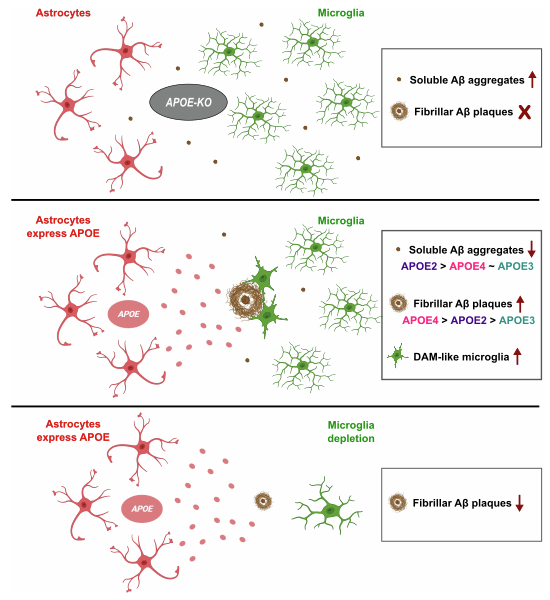
The major genetic risk factor for Alzheimer’s disease (AD), APOE4 , accelerates beta-amyloid (Aβ) plaque formation, but whether this is caused by APOE expressed in microglia or astrocytes is debated. We express here the human APOE isoforms in astrocytes in an Apoe -deficient AD mouse model. This is not only sufficient to restore the amyloid plaque pathology but also induces the characteristic transcriptional pathological responses in Apoe- deficient microglia surrounding the plaques. We find that both APOE4 and the protective APOE2 from astrocytes increase fibrillar plaque deposition, but differentially affect soluble Aβ aggregates. Microglia and astrocytes show specific alterations in function of APOE genotype expressed in astrocytes. Our experiments indicate a central role of the astrocytes in APOE mediated amyloid plaque pathology and in the induction of associated microglia responses.
Overview
AI snapshot
Written from the paper’s full text.
TL;DR
Astrocyte-derived human APOE is sufficient to restore fibrillar Aβ plaque pathology and induce DAM-like microglial responses in Apoe-deficient AppNL-G-F mice. Unexpectedly, APOE2 increased fibrillar plaque deposition similarly to APOE4 relative to APOE3, while APOE4 showed a dose-dependent association with guanidine-soluble Aβ42.
Key findings
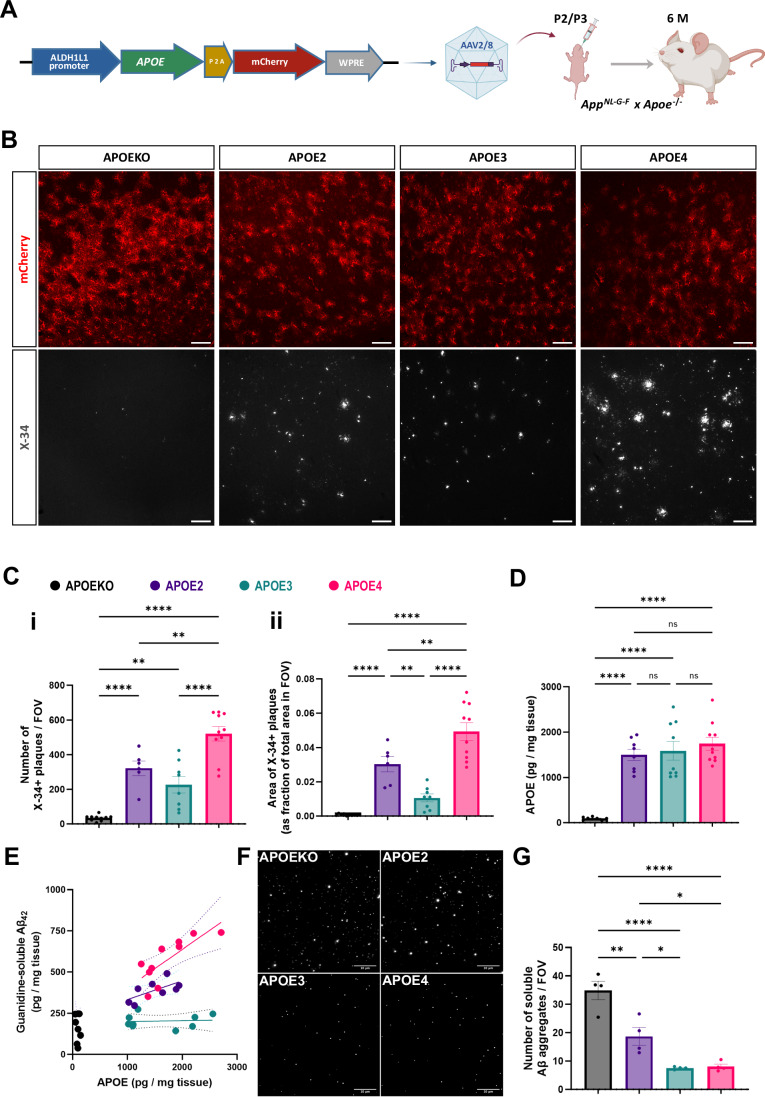
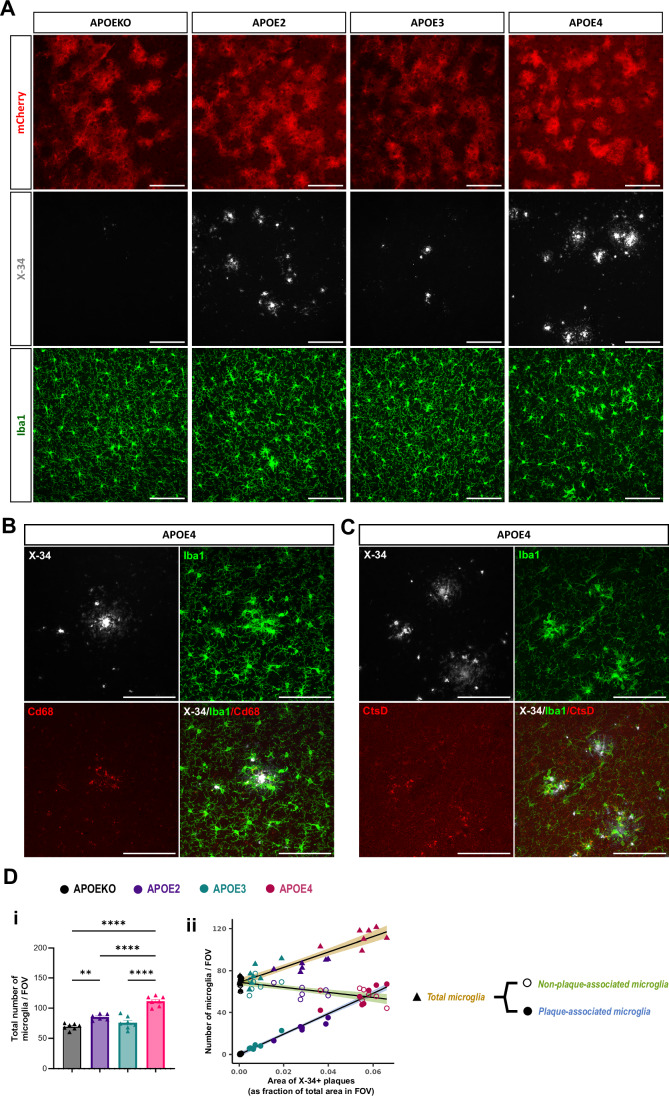
- Astrocyte APOE restored fibrillar plaques in AAV-transduced cortex; APOE2 and APOE4 both significantly increased X-34+ plaque load versus APOE3, while APOE3 plaques were smaller and more compact (e.g., APOEKO vs APOE2 p < 0.0001; APOE2 vs APOE3 p = 0.375 for plaque number; APOE2 vs APOE4 p = 0.0061).
- APOE4 showed a strong dose-dependent relationship with guanidine-soluble Aβ42 (R² = 0.61, slope = 0.23, p = 0.007); APOE2 followed a similar trend (R² = 0.43, slope = 0.11, p = 0.077), while APOE3 showed no association (R² = 0.006, p = 0.843).
- Soluble Aβ aggregates were highest in APOEKO brains; APOE4 and APOE3 showed low levels, and APOE2 was intermediate (APOEKO vs APOE2 p = 0.0016; APOEKO vs APOE3 p < 0.0001; APOEKO vs APOE4 p < 0.0001).
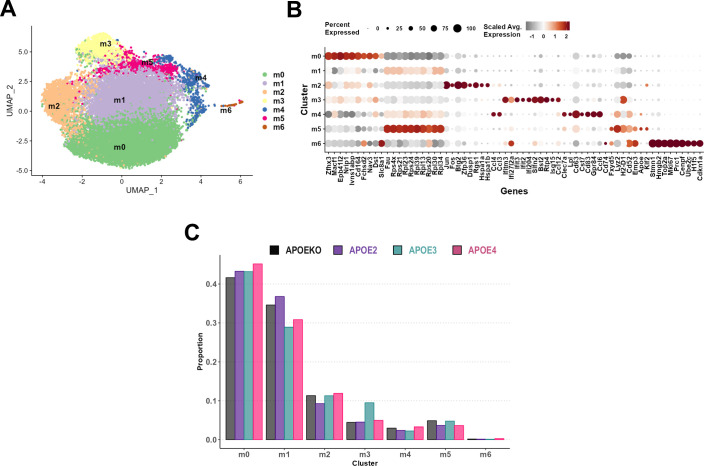
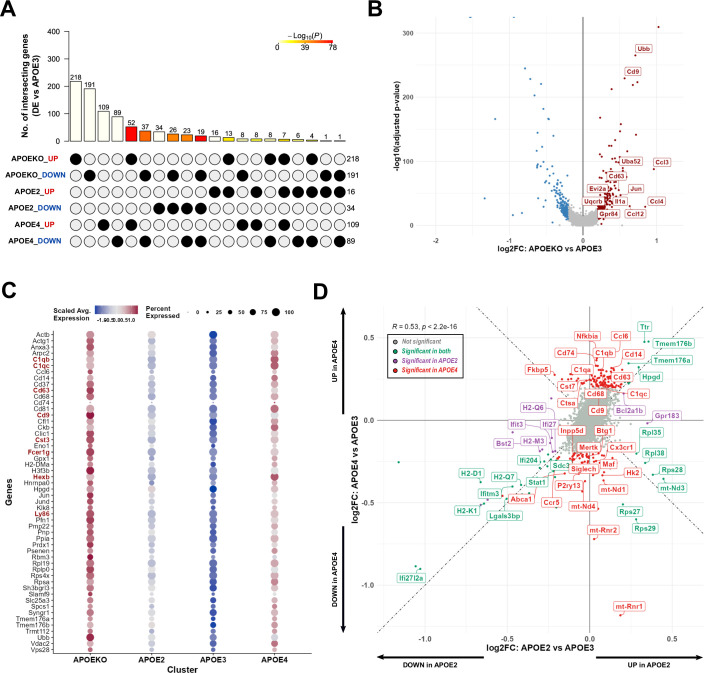
- Apoe-deficient microglia clustered around astrocyte-induced plaques and expressed DAM markers Cd68 and Ctsd; scRNAseq of 18,569 microglia showed APOE4 upregulation of DAM markers (Cd74, Cst7, Cd63, Cd9, Ccl6), complement genes (C1qa, C1qb, C1qc), and Nfkbia versus APOE2.
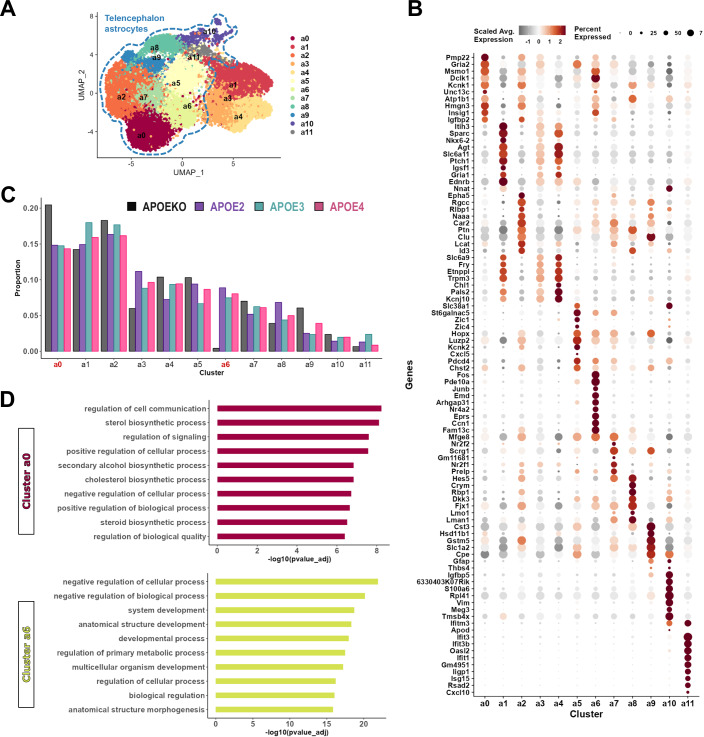
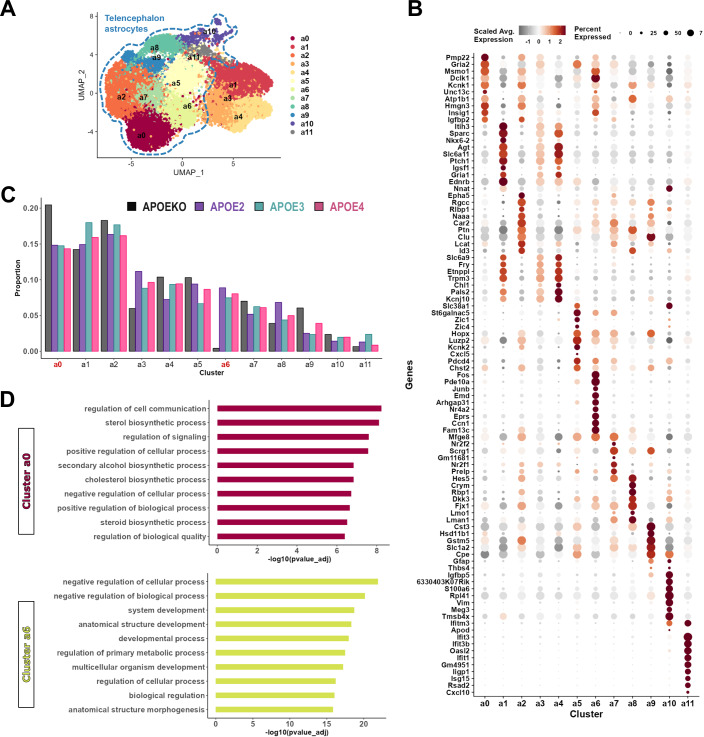
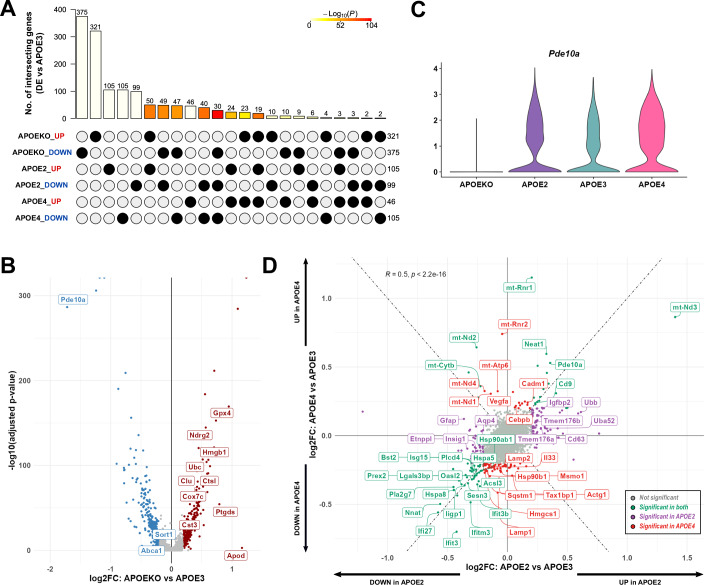
- Astrocyte scRNAseq retained 18,667 astrocytes; APOEKO had the most DEGs versus APOE3 (375 UP, 321 DOWN), and APOE4 astrocytes downregulated autophagy-related genes (Actg1, Tax1bp1, Sqstm1, Lamp1, Lamp2).
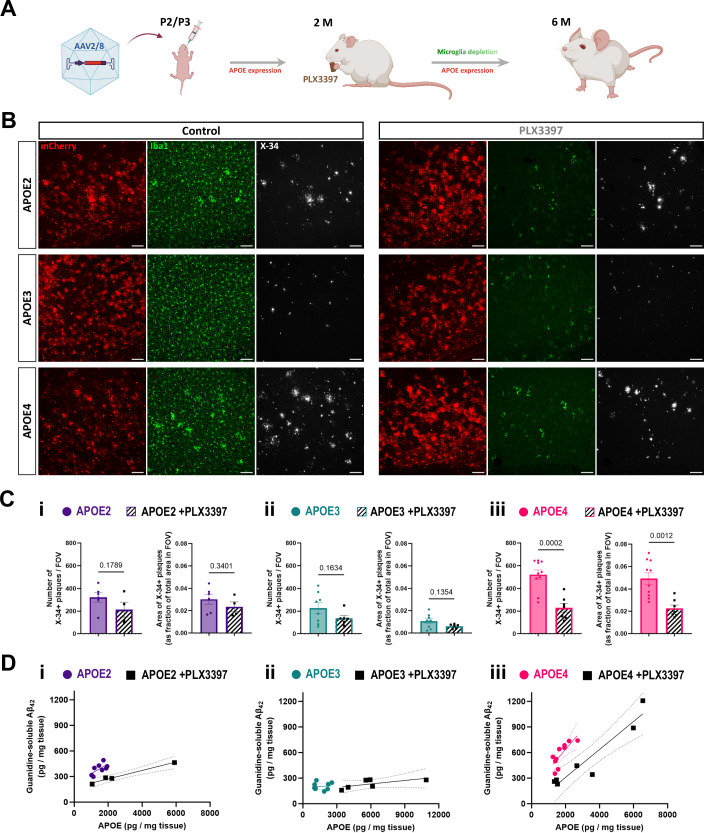
- Microglia depletion with PLX3397 reduced microglia by 83% (APOE2), 77% (APOE3), and 87% (APOE4); fibrillar plaques remained substantial, with only APOE4 showing a statistically significant decrease in plaque load, while APOE2 and APOE4 showed significant decreases in Aβ42 after accounting for APOE levels.
Methods
- Human APOE2, APOE3, or APOE4 plus mCherry was expressed in astrocytes of AppNL-G-F x Apoe−/− mice using AAV2/8 under the ALDH1L1 promoter, injected ICV at postnatal day 2/3; mCherry-only AAV served as APOEKO control. Mice were analyzed at 6 months.
- Amyloid pathology was assessed by X-34 staining and immunofluorescence; APOE and Aβ42 were quantified by MSD-ELISA; soluble Aβ aggregates were quantified by SiMPull/TIRF; microglia depletion used PLX3397 (600 mg/kg chow) from 2 to 6 months.
- Droplet-based scRNAseq was performed on FACS-isolated mCherry+/ACSA2+ astrocytes and CD11b+/CD45-low microglia; differential expression used MAST with Bonferroni correction, and GO enrichment used g:Profiler.
Limitations
- The paper states AAV-mediated transgene expression causes overexpression of APOE under a non-native promoter; lipidation status of APOE isoforms was not explored; gender- and ethnicity-specific effects were not investigated; and microglia could not be isolated only from AAV-transduced regions, likely diluting transcriptomic effect sizes.
- The paper also notes that because microglia depletion began at 2 months, initial amyloid seeding may already have occurred, so a role for microglia in APOE-induced initial seeding cannot be ruled out.
- The text makes evident that APOE expression and Aβ pathology are closely associated in this model, making it difficult to determine direct versus indirect contributors to the DEG changes in microglia and astrocytes.
Model-written summary. Check it against the paper before relying on it.
Integrity signals
Registry
Cites
Statistics
Figures
Verification
Claims the paper makes
45 Own result · 43 Own method · 35 Own interpretation · 20 Partly supported · 16 Supported · 6 Supported so far · 5 No basis given · 3 No full text of the sources · 1 Mixed support · 1 Couldn’t confirm · 1 Sources not found · accuracy not yet measured
The sources with a verdict support this claim; the rest weren’t checked yet, have no full text we could read, or their verdicts aren’t rated yet.
In the paper
“APOE4-targeted replacement mice, expressing the human APOE4 allele instead of the mouse Apoe, crossed with different AD mouse models such as PDAPP, APP/ PS1ΔE9 and 5xFAD, accelerated plaque formation compared to APOE3-targeted replacement mice (Bales et al, 2009; Castellano et al, 2011; Fagan et al, 2002; Holtzman et al, 2000a; Rodriguez et al, 2014; Youmans et al, 2012).”
§ APOE from astrocytes restores Alzheimer’s Aβ-pathology and DAM-like responses in APOE deficient microglia > Introduction
What the sources say
- Not checked — no full text of the sourcecites Bales et al, 2009 source
- Supportedcites Castellano et al, 2011 source
The Results section reports that aged PDAPP mice expressing human apoE4 had greater hippocampal Aβ deposition and amyloid plaque load than those expressing apoE3. The Animals section describes the PDAPP mice crossed with human APOE targeted-replacement mice. This source supports the PDAPP example in the multiply cited sentence. (LLM, conf=0.87)
- Not checked — no full text of the sourcecites Fagan et al, 2002 source
plaindirect- Asserted: passes — The authors put it forward as true.
- Checkable: passes — It can be checked against evidence.
- Load-bearing: unclear — It is unclear whether the paper’s conclusions depend on it.
- Based: passes — The paper gives a reason why it holds.
The cited sources support only part of this claim — read each source’s verdict below.
In the paper
“AD mouse models show limited amyloid plaque pathology in the absence of Apoe (Bales et al, 1999; Holtzman et al, 2000b; Ulrich et al, 2018).”
§ APOE from astrocytes restores Alzheimer’s Aβ-pathology and DAM-like responses in APOE deficient microglia > Introduction
What the sources say
- Not checked — no full text of the sourcecites Bales et al, 1999 source
- Not checked — no full text of the sourcecites Holtzman et al, 2000b source
- Partly supportedcites Ulrich et al, 2018 sourceExperimental — accuracy not yet measured
In “ApoE modifies Aβ deposition,” both Apoe-deficient models had strongly reduced fibrillar amyloid burden, supporting the claim for that type of plaque pathology. But the same section reports detectable fibrillar plaques and substantial total Aβ deposition, including increased cortical deposition in one model. Thus “limited amyloid plaque pathology” is too broad without specifying fibrillar pathology. (LLM, conf=0.88)
plain- Asserted: passes — The authors put it forward as true.
- Checkable: passes — It can be checked against evidence.
- Load-bearing: passes — The paper’s conclusions depend on it.
- Based: passes — The paper gives a reason why it holds.
Every source the paper cites for this claim was checked and supports it.
In the paper
“We did not find major shifts in cell states as observed in other experimental paradigms ((Keren-Shaul et al, 2017; Sala Frigerio et al, 2019) probably because the AAV vector restores amyloid plaque formation only in the area of transduction (Appendix Fig. S2A).”
§ APOE from astrocytes restores Alzheimer’s Aβ-pathology and DAM-like responses in APOE deficient microglia > Results > Fibrillar plaques induced by astrocyte-derived APOE elicit a reactive response in Apoe-deficient microglia
What the sources say
- Supportedcites Keren-Shaul et al, 2017 source
The citation supports the comparison with other experimental paradigms, not the citing authors’ finding of no major shifts in their own dataset. In the Results, Keren-Shaul et al. identify distinct disease-associated microglial states in the AD model that were not observed in wild-type mice. (LLM, conf=0.94)
- Supportedcites Sala Frigerio et al, 2019 source
The citation supports the comparison with other experimental paradigms, not the citing authors’ observation that their own dataset showed no major shift. In Results (‘Aging and Aβ Deposition Induce Similar Responses in Microglia’), Sala Frigerio et al. report a marked shift toward the ARMs state in their mouse model; the proposed AAV explanation is also the citing authors’ own. (LLM, conf=0.92)
hedged- Asserted: passes — The authors put it forward as true.
- Checkable: passes — It can be checked against evidence.
- Load-bearing: unclear — It is unclear whether the paper’s conclusions depend on it.
- Based: passes — The paper gives a reason why it holds.
- Supported
Every source the paper cites for this claim was checked and supports it.
In the paper
“In contrast, microglia can significantly upregulate APOE expression as part of their DAM (Disease Associated Microglia) response to the amyloid plaques (Chen et al, 2020; Keren-Shaul et al, 2017; Krasemann et al, 2017; Sala Frigerio et al, 2019).”
§ APOE from astrocytes restores Alzheimer’s Aβ-pathology and DAM-like responses in APOE deficient microglia > Introduction
What the sources say
- Supportedcites Chen et al, 2020 source
The section “Co-expression of micro- and astroglia genes in the PIGs module” states that Apoe expression is induced in microglia close to amyloid plaques. “Identification of the Plaque-Induced Genes (PIGs) module” links the plaque-induced response to DAM/ARM microglia, supporting the characterization of this as part of a DAM response. Page numbers are unavailable in our copy. (LLM, conf=0.90)
- Supportedcites Keren-Shaul et al, 2017 source
The Results (page not available in our copy) report increased Apoe expression as microglia transition to DAM in an Alzheimer’s mouse model. The paper also locates DAM near Aβ plaques, supporting the claimed association with plaques. (LLM, conf=0.93)
- Supportedcites Krasemann et al, 2017 source
The Results section on the MGnD microglial subset reports that Apoe was among the most upregulated genes in disease-associated microglia and that its expression increased across the microglial phenotype transition. The same section reports increased APOE expression in microglia close to Aβ plaques; the paper calls this the MGnD phenotype rather than DAM. Page numbers are unavailable in our copy. (LLM, conf=0.93)
plaindirect- Asserted: passes — The authors put it forward as true.
- Checkable: passes — It can be checked against evidence.
- Load-bearing: passes — The paper’s conclusions depend on it.
- Based: passes — The paper gives a reason why it holds.
- Supported
The cited sources that could be checked couldn’t confirm or dispute this claim.
In the paper
“Interestingly, Apoe-deficient astrocytes upregulate genes associated with inhibition of Aβ fibrillization (Ptgds and Cst3) and regulation of protein degradation (Ubb, Ubc and Ctsl) (Apelt et al, 2003; Davis et al, 2021; Liu et al, 2017a; Wegiel et al, 2000).”
§ APOE from astrocytes restores Alzheimer’s Aβ-pathology and DAM-like responses in APOE deficient microglia > Discussion
What the sources say
- Not checked — no full text of the sourcecites Apelt et al, 2003 source
- Could not verifycites Davis et al, 2021 sourceExperimental — accuracy not yet measured
The Background and Discussion describe astrocytes’ role in Aβ clearance and changes in ApoE, neprilysin, and IDE after astrocyte loss. Searches for Apoe-deficient astrocytes and the named genes found no passage reporting upregulation of Ptgds, Cst3, Ubb, Ubc, or Ctsl. (LLM, conf=0.76)
- Could not verifycites Liu et al, 2017a sourceExperimental — accuracy not yet measured
The Discussion (page unavailable) mentions improved Aβ clearance with apoE deficiency, but does not report gene expression in Apoe-deficient astrocytes. Searches for Ptgds, Cst3, Ubb, Ubc and Ctsl, and for astrocyte gene-expression changes, found no passage supporting the claimed upregulation. (LLM, conf=0.75)
plaindirect- Asserted: passes — The authors put it forward as true.
- Checkable: passes — It can be checked against evidence.
- Load-bearing: unclear — It is unclear whether the paper’s conclusions depend on it.
- Based: passes — The paper gives a reason why it holds.
The sources with a verdict support this claim; the rest weren’t checked yet, have no full text we could read, or their verdicts aren’t rated yet.
In the paper
“Previous studies have shown that knocking out mouse Apoe leads to a significant reduction of fibrillar plaque formation in different AD mouse models (Bales et al, 1999; Holtzman et al, 2000b; Ulrich et al, 2018).”
§ APOE from astrocytes restores Alzheimer’s Aβ-pathology and DAM-like responses in APOE deficient microglia > Discussion
What the sources say
- Not checked — no full text of the sourcecites Bales et al, 1999 source
- Not checked — no full text of the sourcecites Holtzman et al, 2000b source
- Supportedcites Ulrich et al, 2018 source
In “ApoE modifies Aβ deposition,” the paper reports strongly reduced fibrillar amyloid burden after Apoe deletion in both APP PS1 and APP PS1ΔE9 mice. It also notes that fibrillar plaques remained detectable in both strains, so the reduction was not complete. No page number is provided in our copy. (LLM, conf=0.93)
boosteddirect- Asserted: passes — The authors put it forward as true.
- Checkable: passes — It can be checked against evidence.
- Load-bearing: passes — The paper’s conclusions depend on it.
- Based: passes — The paper gives a reason why it holds.
Every source the paper cites for this claim was checked and supports it.
In the paper
“including significant overlap (p = 2.8e−11) of a small subset of plaque induced genes (PIGs) (C1qb, C1qc, Cd63, Cd9, Cst3, Fcer1g, Hexb, Ly86) (Chen et al, 2020) (Fig. EV3C, Dataset EV6).”
§ APOE from astrocytes restores Alzheimer’s Aβ-pathology and DAM-like responses in APOE deficient microglia > Results > Fibrillar plaques induced by astrocyte-derived APOE elicit a reactive response in Apoe-deficient microglia
What the sources say
- Supportedcites Chen et al, 2020 source
The citation identifies the listed genes as plaque-induced genes, while the APOEKO–APOE4 overlap and its p-value are presented as the citing paper’s own result (Fig. EV3C, Dataset EV6). The source’s “Identification of the Plaque-Induced Genes (PIGs) module” section names seven of the eight genes in the module; “In situ sequencing provides cellular resolution to the PIGs module” also identifies Cd9 as a PIG. No page numbers are available in our copy. (LLM, conf=0.88)
plaincorrelational- Asserted: passes — The authors put it forward as true.
- Checkable: passes — It can be checked against evidence.
- Load-bearing: passes — The paper’s conclusions depend on it.
- Based: passes — The paper gives a reason why it holds.
- Supported
The cited sources support only part of this claim — read each source’s verdict below.
In the paper
“These species induce a cytokine response (Mancuso et al, 2019) in the Apoe-deficient microglia.”
§ APOE from astrocytes restores Alzheimer’s Aβ-pathology and DAM-like responses in APOE deficient microglia > Discussion
What the sources say
- Partly supportedcites Mancuso et al, 2019 sourceExperimental — accuracy not yet measured
The Results section (‘Human ESC-derived and host mouse microglia display a divergent response to oligomeric Aβ’; page unavailable) reports a cytokine-response cluster enriched after oligomeric Aβ treatment. It does not establish that the responding microglia were Apoe-deficient; the host mice described there were Rag2- and Il2rγ-deficient. (LLM, conf=0.86)
plaindirect- Asserted: passes — The authors put it forward as true.
- Checkable: passes — It can be checked against evidence.
- Load-bearing: unclear — It is unclear whether the paper’s conclusions depend on it.
- Based: passes — The paper gives a reason why it holds.
- Partly supported
The cited sources support only part of this claim — read each source’s verdict below.
In the paper
“We confirmed that plaque-associated microglia stained positive for phagocytic marker Cd68 (Fig. 4B; Appendix Fig. S4G) and lysosomal protease Ctsd (Fig. 4C; Appendix Fig. S4H), characteristic of the DAM cell state (Keren-Shaul et al, 2017).”
§ APOE from astrocytes restores Alzheimer’s Aβ-pathology and DAM-like responses in APOE deficient microglia > Results > Fibrillar plaques induced by astrocyte-derived APOE elicit a reactive response in Apoe-deficient microglia
What the sources say
- Partly supportedcites Keren-Shaul et al, 2017 sourceExperimental — accuracy not yet measured
The Results (page unavailable) place DAM near Aβ plaques and report that an intermediate DAM state expresses Ctsd. They do not report Cd68-positive plaque-associated microglia or staining for either Cd68 or Ctsd; those staining observations are presented as the citing authors’ own findings. (LLM, conf=0.84)
plaincorrelational- Asserted: passes — The authors put it forward as true.
- Checkable: passes — It can be checked against evidence.
- Load-bearing: passes — The paper’s conclusions depend on it.
- Based: passes — The paper gives a reason why it holds.
- Rests on an assumption: The AppNL-G-F x Apoe−/− mouse model is a valid model for studying APOE’s role in amyloid plaque pathology in Alzheimer’s disease.
- Partly supported
Every source the paper cites for this claim was checked and supports it.
In the paper
“APOE co-aggregates with soluble Aβ species in vitro (Xia et al, 2024).”
§ APOE from astrocytes restores Alzheimer’s Aβ-pathology and DAM-like responses in APOE deficient microglia > Discussion
What the sources say
- Supportedcites Xia et al, 2024 source
The Results section reports that apoE forms early-stage co-aggregates with Aβ42 during in vitro aggregation. Figure 1 describes this co-aggregation as transient and occurring before fibril formation, consistent with the claim about soluble Aβ species. (LLM, conf=0.93)
plaincorrelational- Asserted: passes — The authors put it forward as true.
- Checkable: passes — It can be checked against evidence.
- Load-bearing: passes — The paper’s conclusions depend on it.
- Based: passes — The paper gives a reason why it holds.
- Supported
- Probably not a substantial claim. 73
- It may state two separate claims as one. 62
Some cited sources support this claim and some don’t — read each source’s verdict below.
In the paper
“Several groups have suggested lowering of APOE expression with APOE-antibodies (Gratuze et al, 2022; Liao et al, 2018; Xiong et al, 2021) or using antisense therapy (Huynh et al, 2017) as a therapeutic option for AD.”
§ APOE from astrocytes restores Alzheimer’s Aβ-pathology and DAM-like responses in APOE deficient microglia > Discussion
What the sources say
- Disputedcites Gratuze et al, 2022 sourceExperimental — accuracy not yet measured
The Discussion supports investigating the anti-ApoE antibody HAE-4 as a potential AD therapy, but explicitly says it does not lower overall ApoE levels. It identifies antisense oligonucleotides—not HAE-4—as an approach to lowering brain ApoE levels. The antisense-therapy clause in the citing sentence is attributed to a different citation. (LLM, conf=0.90)
Checked by a reasoning model — may be wrong.
- Disputedcites Liao et al, 2018 sourceExperimental — accuracy not yet measured
The cited paper supports anti-apoE antibodies as a potential therapeutic approach, but not as a way to lower APOE expression. Its Discussion (p. 7) says HAE-4 did not significantly alter total apoE levels, and the Discussion (p. 8) explicitly distinguishes antibody targeting from simply lowering apoE levels. The antisense-therapy clause is attributed to a different citation. (LLM, conf=0.90)
Checked by a reasoning model — may be wrong.
- Partly supportedcites Xiong et al, 2021 sourceExperimental — accuracy not yet measured
The Introduction describes HAE-4 as an antibody targeting APOE in amyloid plaques, and the Discussion proposes its therapeutic potential for AD. The paper reports reduced amyloid pathology in mice, not lowered APOE expression. The antisense-therapy clause is attributed to a different citation. (LLM, conf=0.88)
hedged- Asserted: passes — The authors put it forward as true.
- Checkable: passes — It can be checked against evidence.
- Load-bearing: fails — The paper’s conclusions may not depend on it.
- Based: passes — The paper gives a reason why it holds.
Probably not a substantial claim. The paper’s conclusions may not depend on it.
- Disputed
The cited sources support only part of this claim — read each source’s verdict below.
In the paper
“the major role is direct promotion of Aβ fibrillization (Castano et al, 1995; Ma et al, 1994; Wisniewski et al, 1994)”
§ APOE from astrocytes restores Alzheimer’s Aβ-pathology and DAM-like responses in APOE deficient microglia > Introduction
What the sources say
- Partly supportedcites Castano et al, 1995 sourceExperimental — accuracy not yet measured
The Introduction reports that apoE accelerated Aβ fibril formation in vitro, and the Discussion says apoE may promote Aβ assembly. But the Discussion also describes apoE as one of several possible contributors whose importance varies among cases of Alzheimer’s disease; it does not establish direct fibrillization as APOE’s major role in Aβ pathology. (LLM, conf=0.88)
- Not matchedcites Ma et al, 1994
Couldn’t be matched to a paper in Crossref, so it can’t be checked.
- Not matchedcites Wisniewski et al, 1994
Couldn’t be matched to a paper in Crossref, so it can’t be checked.
plaindirect- Asserted: passes — The authors put it forward as true.
- Checkable: passes — It can be checked against evidence.
- Load-bearing: fails — The paper’s conclusions may not depend on it.
- Based: passes — The paper gives a reason why it holds.
Probably not a substantial claim. The paper’s conclusions may not depend on it.
- Partly supported
The cited sources support only part of this claim — read each source’s verdict below.
In the paper
“In AD, its specific role in promoting β-amyloid (Aβ) plaque pathology is, however, well established (Fleisher et al, 2013; Kok et al, 2009; Murphy et al, 2013; Schmechel et al, 1993).”
§ APOE from astrocytes restores Alzheimer’s Aβ-pathology and DAM-like responses in APOE deficient microglia > Introduction
What the sources say
- Not checked — no full text of the sourcecites Fleisher et al, 2013 source
- Not checked — no full text of the sourcecites Kok et al, 2009 source
- Partly supportedcites Murphy et al, 2013 sourceExperimental — accuracy not yet measured
The Findings and Discussion report that ApoE ε4 is strongly associated with higher β-amyloid plaque density, including among people diagnosed with AD. The study describes this as an association and predictor of pathology; it does not establish that APOE causally promotes plaque formation. (LLM, conf=0.82)
boosteddirect- Asserted: passes — The authors put it forward as true.
- Checkable: passes — It can be checked against evidence.
- Load-bearing: passes — The paper’s conclusions depend on it.
- Based: passes — The paper gives a reason why it holds.
Probably not a substantial claim.
The cited sources support only part of this claim — read each source’s verdict below.
In the paper
“The APOE4 variant of apolipoprotein E was identified 30 years ago as the major genetic risk factor for Alzheimer’s Disease (AD) at the population level (Bennett et al, 2009; Corder et al, 1993; Strittmatter et al, 1993)”
§ APOE from astrocytes restores Alzheimer’s Aβ-pathology and DAM-like responses in APOE deficient microglia > Introduction
What the sources say
- Partly supportedcites Bennett et al, 2009 sourceExperimental — accuracy not yet measured
The ‘Relation of APOE to clinical AD’ section reports that APOE ε4 was associated with more than threefold higher odds of clinical AD, and the Discussion calls APOE a well-established risk factor in multiple populations. Our copy does not establish that ε4 is the major genetic risk factor at the population level or document its identification 30 years ago. Page numbers were not provided for these passages. (LLM, conf=0.82)
- Not checked — no full text of the sourcecites Corder et al, 1993 source
- Partly supportedcites Strittmatter et al, 1993 sourceExperimental — accuracy not yet measured
The Abstract (p. 1977) reports a significant association between APOE-e4 and late-onset familial Alzheimer disease. It does not establish that APOE4 is the major genetic risk factor for Alzheimer’s disease at the population level; the reported comparison is between affected members of families and age-matched controls. (LLM, conf=0.88)
plaincorrelational- Asserted: passes — The authors put it forward as true.
- Checkable: passes — It can be checked against evidence.
- Load-bearing: fails — The paper’s conclusions may not depend on it.
- Based: passes — The paper gives a reason why it holds.
Probably not a substantial claim. The paper’s conclusions may not depend on it.
- Partly supported
The sources with a verdict support this claim; the rest weren’t checked yet, have no full text we could read, or their verdicts aren’t rated yet.
In the paper
“In general, experiments suggest the order of APOE4 > APOE3 > APOE2 for effects on amyloid deposition (Fagan et al, 2002; Castellano et al, 2011; Hudry et al, 2013; Zhao et al, 2016)”
§ APOE from astrocytes restores Alzheimer’s Aβ-pathology and DAM-like responses in APOE deficient microglia > Discussion
What the sources say
- Not checked — no full text of the sourcecites Fagan et al, 2002 source
- Supportedcites Castellano et al, 2011 source
The Discussion reports that aged PDAPP/TRE mice developed Aβ/amyloid deposition in the order E4 > E3 > E2. It also reports that biomarkers of brain amyloid accumulation in cognitively normal people followed ε4 > ε3 > ε2. These passages support the cited sentence’s general, qualified claim. (LLM, conf=0.94)
- Supportedcites Hudry et al, 2013 source
In the Results (Expression of APOE isoforms modulates the kinetics of amyloidosis), plaque-growth measurements follow the order APOE4 > APOE3 > APOE2. The same section reports reduced amyloid-deposit density with APOE2 relative to both APOE3 and APOE4. These mouse experiments support the citing sentence’s hedged ordering. (LLM, conf=0.90)
hedgedcorrelational- Asserted: passes — The authors put it forward as true.
- Checkable: passes — It can be checked against evidence.
- Load-bearing: fails — The paper’s conclusions may not depend on it.
- Based: passes — The paper gives a reason why it holds.
Probably not a substantial claim. The paper’s conclusions may not depend on it.
Every source the paper cites for this claim was checked and supports it.
In the paper
“Also, Mertk which is necessary for detection and engulfment of amyloid plaques by microglia (Huang et al, 2021), and Inpp5d, a known AD risk factor which has a role in limiting plaque formation (Castranio et al, 2023), are downregulated in APOE4.”
§ APOE from astrocytes restores Alzheimer’s Aβ-pathology and DAM-like responses in APOE deficient microglia > Results > Fibrillar plaques induced by astrocyte-derived APOE elicit a reactive response in Apoe-deficient microglia
What the sources say
- Supportedcites Huang et al, 2021 source
The Huang et al. citation is attached to Mertk’s role in microglial detection and engulfment of plaques, not to the citing authors’ statement that the genes are downregulated in APOE4. The Results section, “Dense-core plaque burden in the absence of TAM signaling” (page unavailable), identifies Mer as performing most phagocytosis-dependent dense-core plaque construction; the paper also reports impaired plaque detection and engulfment when Axl and Mertk are both absent. (LLM, conf=0.88)
- Supportedcites Castranio et al, 2023 source
The citation is attached to the description of INPP5D as an AD risk factor with a role in limiting plaque formation, not to the citing authors’ statement that it is downregulated in APOE4. The Discussion identifies an INPP5D variant that confers AD risk and reports that reducing microglial Inpp5d increased plaque burden in PSAPP mice. (LLM, conf=0.91)
plaincorrelational- Asserted: passes — The authors put it forward as true.
- Checkable: passes — It can be checked against evidence.
- Load-bearing: unclear — It is unclear whether the paper’s conclusions depend on it.
- Based: passes — The paper gives a reason why it holds.
It may state two separate claims as one.
- Supported
The cited sources support only part of this claim — read each source’s verdict below.
In the paper
“Interestingly, having an APOE2 allele (Berlau et al, 2007, 2009) or the rare isoform APOE3Ch (Christchurch variant) (Arboleda-Velasquez et al, 2019), shields patients against dementia even in the presence of high amyloid plaque load.”
§ APOE from astrocytes restores Alzheimer’s Aβ-pathology and DAM-like responses in APOE deficient microglia > Discussion
What the sources say
- Not matchedcites Berlau et al, 2007, 2009
Couldn’t be matched to a paper in Crossref, so it can’t be checked.
- Partly supportedcites Arboleda-Velasquez et al, 2019 sourceExperimental — accuracy not yet measured
The Abstract reports one APOE3 Christchurch homozygote who remained resistant to dementia despite high amyloid plaque burden. It does not establish that having the variant generally shields patients: the authors say other factors may have contributed and suggest that homozygosity is required to postpone clinical onset. The separately cited APOE2 claim is not assessed here. (LLM, conf=0.88)
plaindirect- Asserted: passes — The authors put it forward as true.
- Checkable: passes — It can be checked against evidence.
- Load-bearing: fails — The paper’s conclusions may not depend on it.
- Based: passes — The paper gives a reason why it holds.
Probably not a substantial claim. The paper’s conclusions may not depend on it.
- Not matched
The sources with a verdict support this claim; the rest weren’t checked yet, have no full text we could read, or their verdicts aren’t rated yet.
In the paper
“Nevertheless other studies have also reported that APOE2 expression is associated with similar or even higher plaque load than APOE3 (Rodriguez et al, 2014; Youmans et al, 2012; Bales et al, 2009; Dodart et al, 2005).”
§ APOE from astrocytes restores Alzheimer’s Aβ-pathology and DAM-like responses in APOE deficient microglia > Discussion
What the sources say
- Could not verifycites Rodriguez et al, 2014 sourceExperimental — accuracy not yet measured
The Results section on plaque morphology (page unavailable) reports a higher percentage of diffuse plaques in E2FAD than E3FAD mice, but percentages of plaque types do not establish total plaque load. Searches for E2FAD–E3FAD plaque burden and total Aβ load found no comparison showing that APOE2 has similar or higher plaque load than APOE3. (LLM, conf=0.76)
- Supportedcites Youmans et al, 2012 source
The Results section (“Human APOE Genotype-specific Delay of Aβ Accumulation in 5xFAD,” Fig. 2C; page not specified in our copy) reports significantly higher plaque levels in E2FAD than E3FAD mice in the subiculum at 6 months. This supports the cited claim, though the reported comparison is specific to that brain region and age. (LLM, conf=0.92)
- Not checked — no full text of the sourcecites Bales et al, 2009 source
plaincorrelational- Asserted: passes — The authors put it forward as true.
- Checkable: passes — It can be checked against evidence.
- Load-bearing: fails — The paper’s conclusions may not depend on it.
- Based: passes — The paper gives a reason why it holds.
Probably not a substantial claim. The paper’s conclusions may not depend on it.
- Could not verify
The cited sources support only part of this claim — read each source’s verdict below.
In the paper
“However, reconstitution of APOE expression in microglia only in an Apoe knockout background (Mancuso et al, 2024) or microglia-specific knockout of APOE had no effect on amyloid plaque formation or microglial association with plaques (Henningfield et al, 2022).”
§ APOE from astrocytes restores Alzheimer’s Aβ-pathology and DAM-like responses in APOE deficient microglia > Introduction
What the sources say
- Not matchedcites Mancuso et al, 2024
Couldn’t be matched to a paper in Crossref, so it can’t be checked.
- Supportedcites Henningfield et al, 2022 source
The Abstract reports unchanged plaque load and microglial clustering around plaques after microglia-specific ApoE knockout in 5xFAD mice. The Results section on microglial number and plaque association also reports no difference in plaque-associated microglia. The study did find an approximately 35% increase in average plaque size, a distinct outcome from plaque formation and association. (LLM, conf=0.91)
plain- Asserted: passes — The authors put it forward as true.
- Checkable: passes — It can be checked against evidence.
- Load-bearing: passes — The paper’s conclusions depend on it.
- Based: passes — The paper gives a reason why it holds.
It may state two separate claims as one.
- Not matched
The sources with a verdict support this claim; the rest weren’t checked yet, have no full text we could read, or their verdicts aren’t rated yet.
In the paper
“Indeed, APOE4 has been implicated in the pro-inflammatory state in microglia (Brown et al, 2002; Colton et al, 2005; Lanfranco et al, 2021; Lin et al, 2018; Serrano-Pozo et al, 2021; Vitek et al, 2009) and astrocytes (Arnaud et al, 2022); endolysosomal dysfunction (Ji et al, 2002; Nuriel et al, 2017; Pohlkamp et al, 2021; Prasad and Rao, 2018; Xian et al, 2018); impaired autophagy (Parcon et al, 2”
§ APOE from astrocytes restores Alzheimer’s Aβ-pathology and DAM-like responses in APOE deficient microglia > Discussion
What the sources say
- Not checked — no full text of the sourcecites Brown et al, 2002 source
- Not checked — no full text of the sourcecites Colton et al, 2005 source
- Supportedcites Lanfranco et al, 2021 source
The citation to Lanfranco et al. (2021) is attached specifically to the claim about a pro-inflammatory state in microglia, not to the sentence’s other listed effects. The Discussion reports higher basal TNFα in APOE4 microglia and says this supports greater inflammation in primary cells. (LLM, conf=0.93)
plaindirect- Asserted: passes — The authors put it forward as true.
- Checkable: passes — It can be checked against evidence.
- Load-bearing: fails — The paper’s conclusions may not depend on it.
- Based: passes — The paper gives a reason why it holds.
Probably not a substantial claim. The paper’s conclusions may not depend on it. It may state two separate claims as one.
The cited sources support only part of this claim — read each source’s verdict below.
In the paper
“Restoration of APOE expression in astrocytes alone is sufficient to induce formation of fibrillar plaques and microglia reactivity, extending findings from previous studies (Holtzman et al, 2000a; Liu et al, 2017b; Mahan et al, 2022).”
§ APOE from astrocytes restores Alzheimer’s Aβ-pathology and DAM-like responses in APOE deficient microglia > Discussion
What the sources say
- Partly supportedcites Holtzman et al, 2000a sourceExperimental — accuracy not yet measured
The Results section (“Expression of Human apoE Results in Fibrillar Aβ Deposition and Neuritic Plaques”; page unavailable) reports thioflavine-S-positive plaques in APPV717F mice expressing human apoE under an astrocyte-specific promoter. It does not report that restoring astrocytic apoE induced microglial reactivity; the Discussion mentions activated glial cells only as a general feature of neuritic plaques. (LLM, conf=0.88)
- Partly supportedcites Liu et al, 2017b sourceExperimental — accuracy not yet measured
The Results sections on fibrillar plaques and Aβ-associated gliosis report that astrocytic apoE4 expression increased fibrillar plaque formation and Iba1-positive microglia in APP mice. The claim is broader than those findings: apoE3 did not increase either measure, and the study shows enhanced plaque formation in an amyloid-prone model, not that astrocytic APOE expression alone initiates plaques. (LLM, conf=0.88)
- Partly supportedcites Mahan et al, 2022 sourceExperimental — accuracy not yet measured
The Discussion (page unavailable) reports that removing astrocytic apoE strongly reduced fibrillar plaques, and the Results section on microglial activation (page unavailable) reports reduced activation-associated gene expression after that removal. These findings support a role for astrocytic apoE in both outcomes, but the paper tested reduction, not restoration of APOE expression in astrocytes alone; it therefore does not establish the claimed sufficiency. (LLM, conf=0.86)
plaindirect- Asserted: passes — The authors put it forward as true.
- Checkable: passes — It can be checked against evidence.
- Load-bearing: passes — The paper’s conclusions depend on it.
- Based: passes — The paper gives a reason why it holds.
It may state two separate claims as one.
- Partly supported
Every source the paper cites for this claim was checked and supports it.
In the paper
“However, APOE is not transferred over the blood brain barrier (Huynh et al, 2019; Lane-Donovan et al, 2016) suggesting that astrocytes are the main contributor of APOE in the brain (Boyles et al, 1985; Zhang et al, 2014).”
§ APOE from astrocytes restores Alzheimer’s Aβ-pathology and DAM-like responses in APOE deficient microglia > Introduction
What the sources say
- Supportedcites Huynh et al, 2019 source
Huynh et al. is cited for the blood–brain barrier clause, not the subsequent claim about astrocytes. The Background states that apoE cannot cross the BBB, and the Discussion says the study’s findings are consistent with the inability of peripheral apoE to cross it. (LLM, conf=0.94)
- Supportedcites Lane-Donovan et al, 2016 source
The paper states that ApoE typically cannot pass through the blood–brain barrier and that peripheral and brain ApoE pools are therefore largely separate (Peripheral and central sources of ApoE, reproduced in the Discussion passage). This supports the blood–brain barrier clause attributed to Lane-Donovan et al.; the astrocyte clause is cited to other sources. (LLM, conf=0.92)
- Supportedcites Boyles et al, 1985 source
The Discussion reports apo E in astrocytes, identifies it as an astrocytic secretory product, and considers microglia an unlikely source of the high apo E levels in normal brain. This supports the claim attributed to Boyles et al. that astrocytes are the main contributor; the blood–brain barrier statement is cited to other papers. (LLM, conf=0.90)
hedgeddirect- Asserted: passes — The authors put it forward as true.
- Checkable: passes — It can be checked against evidence.
- Load-bearing: passes — The paper’s conclusions depend on it.
- Based: passes — The paper gives a reason why it holds.
It may state two separate claims as one.
- Supported
The cited sources support only part of this claim — read each source’s verdict below.
In the paper
“We observed that compared to APOE2, APOE4 had a significant upregulation of several DAM marker genes such as Cd74, Cst7, Cd63, Cd9, Ccl6, complement cascade genes (C1qa, C1qb, C1qc) and the pro-inflammatory gene Nfkbia (Sousa et al, 2018).”
§ APOE from astrocytes restores Alzheimer’s Aβ-pathology and DAM-like responses in APOE deficient microglia > Results > Fibrillar plaques induced by astrocyte-derived APOE elicit a reactive response in Apoe-deficient microglia
What the sources say
- Partly supportedcites Sousa et al, 2018 sourceExperimental — accuracy not yet measured
In Results and Discussion (page unavailable), Sousa et al. compare inflammatory microglia with DAM, identify Cd9 as a disease-associated gene, and identify C1qa, C1qb, and C1qc as complement-system genes. The paper does not report the citing authors’ APOE4-versus-APOE2 result or establish the full listed set as DAM markers; it instead reports that those complement genes were downregulated in DAM relative to controls. (LLM, conf=0.85)
plaincorrelational- Asserted: passes — The authors put it forward as true.
- Checkable: passes — It can be checked against evidence.
- Load-bearing: passes — The paper’s conclusions depend on it.
- Based: passes — The paper gives a reason why it holds.
It may state two separate claims as one.
- Rests on an assumption: APOE3 is neutral.
- Partly supported
The cited sources support only part of this claim — read each source’s verdict below.
In the paper
“It has also been shown that APOE2 expression leads to increased APOE levels in mouse models and human brain (Riddell et al, 2008; Bales et al, 2009; Conejero-Goldberg et al, 2014), which can influence amyloid pathology.”
§ APOE from astrocytes restores Alzheimer’s Aβ-pathology and DAM-like responses in APOE deficient microglia > Discussion
What the sources say
- Partly supportedcites Riddell et al, 2008 sourceExperimental — accuracy not yet measured
The Figure 2 caption (indexed under Discussion; page unavailable) reports genotype-dependent apoE levels in the brains of targeted-replacement mice, including ε2/2 mice. The Discussion proposes that brain apoE levels may affect amyloid-β clearance and deposition. The paper does not demonstrate increased apoE levels in human brain with APOE2 expression, nor directly test the effect of APOE2 on amyloid pathology. (LLM, conf=0.85)
- Not checked — no full text of the sourcecites Bales et al, 2009 source
- Not checked — no full text of the sourcecites Conejero-Goldberg et al, 2014 source
plaindirect- Asserted: passes — The authors put it forward as true.
- Checkable: passes — It can be checked against evidence.
- Load-bearing: fails — The paper’s conclusions may not depend on it.
- Based: passes — The paper gives a reason why it holds.
Probably not a substantial claim. The paper’s conclusions may not depend on it. It may state two separate claims as one.
- Partly supported
The cited sources support only part of this claim — read each source’s verdict below.
In the paper
“This has also been observed with viral-vector mediated overexpression of APOE4 isoforms in AD mouse brains (Dodart et al, 2005; Hudry et al, 2013; Zhao et al, 2016).”
§ APOE from astrocytes restores Alzheimer’s Aβ-pathology and DAM-like responses in APOE deficient microglia > Introduction
What the sources say
- Partly supportedcites Dodart et al, 2005 sourceExperimental — accuracy not yet measured
The Discussion reports that lentiviral apoE4 increased Aβ deposition and congophilic amyloid within five weeks in PDAPP mice lacking mouse apoE. The claim omits that condition: the Results state that apoE4 did not increase hippocampal Aβ burden in PDAPP mice expressing mouse apoE. Page numbers were not available in our copy. (LLM, conf=0.87)
- Supportedcites Hudry et al, 2013 source
The Results section, “Expression of APOE isoforms modulates the kinetics of amyloidosis” (page not provided), reports faster amyloid progression in APP/PS1 mice exposed to APOE4 after AAV4-mediated gene transfer. The plaque-density results also show more cortical plaques in AAV4-APOE4–injected mice. (LLM, conf=0.93)
- Not checked — no full text of the sourcecites Zhao et al, 2016 source
plaindirect- Asserted: passes — The authors put it forward as true.
- Checkable: passes — It can be checked against evidence.
- Load-bearing: fails — The paper’s conclusions may not depend on it.
- Based: passes — The paper gives a reason why it holds.
Probably not a substantial claim. The paper’s conclusions may not depend on it.
- Partly supported
Every source the paper cites for this claim was checked and supports it.
In the paper
“APOE4 affects, however, the endosomal-lysosomal pathway (Nuriel et al, 2017) and the APOE4 induced recycling block can be rescued by decreasing pH (Xian et al, 2018).”
§ APOE from astrocytes restores Alzheimer’s Aβ-pathology and DAM-like responses in APOE deficient microglia > Discussion
What the sources say
- Supportedcites Nuriel et al, 2017 source
The Nuriel et al. citation is attached only to the claim that APOE4 affects the endosomal–lysosomal pathway. The Discussion reports age-dependent alterations in that system in APOE4 mice. The separate claim about rescuing a recycling block by decreasing pH is attributed to Xian et al. and is not part of this verdict. (LLM, conf=0.94)
- Supportedcites Xian et al, 2018 source
The Introduction states that lowering endosomal pH through NHE6 inhibition releases the ApoE4-induced recycling block. The Discussion likewise reports that NHE inhibition resolves the block and restores normal receptor recycling. The separate endosomal-lysosomal pathway clause is cited to Nuriel et al., not to this paper. (LLM, conf=0.94)
plaindirect- Asserted: passes — The authors put it forward as true.
- Checkable: passes — It can be checked against evidence.
- Load-bearing: unclear — It is unclear whether the paper’s conclusions depend on it.
- Based: passes — The paper gives a reason why it holds.
It may state two separate claims as one.
- Supported
The cited sources support only part of this claim — read each source’s verdict below.
In the paper
“Additionally, we did not explore the lipidation status of different APOE isoforms, which influences Aβ pathology (Koldamova et al, 2005; Wahrle et al, 2005).”
§ APOE from astrocytes restores Alzheimer’s Aβ-pathology and DAM-like responses in APOE deficient microglia > Discussion
What the sources say
- Not checked — no full text of the sourcecites Koldamova et al, 2005 source
- Partly supportedcites Wahrle et al, 2005 sourceExperimental — accuracy not yet measured
The Discussion (page not provided) links poorly lipidated apoE to increased Aβ deposition in PDAPP mice and describes isoform-dependent interactions with Aβ in vitro. It does not directly show that the lipidation status of different human APOE isoforms influences Aβ pathology; it presents the mechanism for its mouse findings as likely rather than established. (LLM, conf=0.84)
plain- Asserted: passes — The authors put it forward as true.
- Checkable: passes — It can be checked against evidence.
- Load-bearing: fails — The paper’s conclusions may not depend on it.
- Based: passes — The paper gives a reason why it holds.
Probably not a substantial claim. The paper’s conclusions may not depend on it.
Every source the paper cites for this claim was checked and supports it.
In the paper
“Cell type annotation was done using seurat::AddModuleScore() to assign cell scores based on previously identified signatures for different brain cell types (Zeisel et al, 2018).”
§ APOE from astrocytes restores Alzheimer’s Aβ-pathology and DAM-like responses in APOE deficient microglia > Methods > Analysis of single-cell RNA sequencing datasets
What the sources say
- Supportedcites Zeisel et al, 2018 source
The STAR★Methods section on marker gene set discovery says the paper generated marker sets for its cell-type clusters. That supports the citation as a source of previously identified cell-type signatures. The sentence describes AddModuleScore as the citing authors’ annotation method, not as a method used by Zeisel et al. (LLM, conf=0.88)
plain- Asserted: passes — The authors put it forward as true.
- Checkable: passes — It can be checked against evidence.
- Load-bearing: fails — The paper’s conclusions may not depend on it.
- Based: passes — The paper gives a reason why it holds.
Probably not a substantial claim. The paper’s conclusions may not depend on it.
- Supported
The cited sources support only part of this claim — read each source’s verdict below.
In the paper
“Previous reports have demonstrated that gender can affect AD pathology, microglia response and APOE expression (Stephen et al, 2019; Thomas et al, 2016; Sala Frigerio et al, 2019), while the protective and disease causing effects of APOE2 and APOE4 are variable in different ethnic populations (Farrer et al, 1997; Naslavsky et al, 2022).”
§ APOE from astrocytes restores Alzheimer’s Aβ-pathology and DAM-like responses in APOE deficient microglia > Discussion
What the sources say
- Partly supportedcites Stephen et al, 2019 sourceExperimental — accuracy not yet measured
The Results report that sex was associated with amyloid plaque burden and microglial responses in EFAD mice. The Discussion also describes sex differences in microglial plaque interactions, but the paper does not establish that sex affects APOE expression. The statement about ethnic populations is attributed to other citations, not Stephen et al. (LLM, conf=0.87)
- Partly supportedcites Thomas et al, 2016 sourceExperimental — accuracy not yet measured
The Introduction and the Discussion section on sex and APOE4-induced dysfunction report greater APOE4-associated AD risk in females and sex-related differences in AD-like pathology. The Discussion mentions microglial inflammatory responses and suggests females may have a stronger brain inflammatory response, but does not establish a sex-specific microglial response or a sex effect on APOE expression. The ethnicity clause is attributed to other citations, not Thomas et al.; the indexed passages have no page numbers. (LLM, conf=0.85)
- Partly supportedcites Sala Frigerio et al, 2019 sourceExperimental — accuracy not yet measured
The Results section (“Microglia Differentiate into Mutually Exclusive Response States”; page not provided) reports that female mice showed earlier, faster microglial responses to Aβ than males. The paper also reports Apoe upregulation in activated microglia, but the cited passages do not establish that sex changes Apoe expression or AD pathology. The ethnic-population claim is attached to other citations, not this paper. (LLM, conf=0.85)
boostedcorrelational- Asserted: passes — The authors put it forward as true.
- Checkable: passes — It can be checked against evidence.
- Load-bearing: fails — The paper’s conclusions may not depend on it.
- Based: passes — The paper gives a reason why it holds.
Probably not a substantial claim. The paper’s conclusions may not depend on it. It may state two separate claims as one.
- Partly supported
The cited sources support only part of this claim — read each source’s verdict below.
In the paper
“Aβ, when endocytosed, becomes concentrated in the acidic endosomal compartments, which promotes amyloid fibril formation and then secretion (Chung et al, 1999; Hu et al, 2009; Knauer et al, 1992).”
§ APOE from astrocytes restores Alzheimer’s Aβ-pathology and DAM-like responses in APOE deficient microglia > Discussion
What the sources say
- Partly supportedcites Chung et al, 1999 sourceExperimental — accuracy not yet measured
The Results report that internalized soluble Aβ concentrates in organelles consistent with late endosomes and lysosomes before release. The Discussion says low pH should promote fibril growth, but treats incorporation of soluble Aβ into fibrils as a possibility. The paper reports release of internalized Aβ, not that newly formed fibrils are subsequently secreted; the claim presents that sequence as established. (LLM, conf=0.87)
- Not matchedcites Hu et al, 2009
Couldn’t be matched to a paper in Crossref, so it can’t be checked.
- Partly supportedcites Knauer et al, 1992 sourceExperimental — accuracy not yet measured
The abstract reports that endocytosed Aβ1–42 accumulated in cultured fibroblasts in an aggregated state, in a compartment overlapping late endosomes or secondary lysosomes. It does not show that acidity promotes fibril formation or that the accumulated peptide is subsequently secreted. (LLM, conf=0.88)
plaindirect- Asserted: passes — The authors put it forward as true.
- Checkable: passes — It can be checked against evidence.
- Load-bearing: passes — The paper’s conclusions depend on it.
- Based: passes — The paper gives a reason why it holds.
It may state two separate claims as one.
- Partly supported
Every source the paper cites for this claim was checked and supports it.
In the paper
“This was done using g:Profiler web interface, where the cluster markers were queried against GO biological process database, with g:SCS multiple testing correction method applying significance threshold of 0.05 (Kolberg et al, 2023).”
§ APOE from astrocytes restores Alzheimer’s Aβ-pathology and DAM-like responses in APOE deficient microglia > Methods > Analysis of single-cell RNA sequencing datasets
What the sources say
- Supportedcites Kolberg et al, 2023 source
The ‘Enrichment analysis using g:GOSt’ section describes g:Profiler as a gene-list enrichment tool, lists GO Biological Process as a data source, and identifies g:SCS as its default multiple-testing correction. The cluster markers and 0.05 threshold describe the citing authors’ own analysis settings; the citation identifies the tool rather than serving as evidence that those settings were used. (LLM, conf=0.87)
plain- Asserted: passes — The authors put it forward as true.
- Checkable: passes — It can be checked against evidence.
- Load-bearing: fails — The paper’s conclusions may not depend on it.
- Based: passes — The paper gives a reason why it holds.
Probably not a substantial claim. The paper’s conclusions may not depend on it.
- Supported
The cited sources support only part of this claim — read each source’s verdict below.
In the paper
“The other mechanisms of APOE4 dysfunction probably explain the association with neurodegenerative diseases in general, such as Parkinson’s disease (odds ratio ~1.6–4.19) and Lewy body dementia (odds ratio ~2.4–6.1) (Bras et al, 2014; Guerreiro et al, 2018; Huang et al, 2006; Irwin et al, 2012; Tropea et al, 2018; Tsuang et al, 2013); TDP-43 proteinopathy (odds ratio ~2) (Josephs et al, 2014; Wenn”
§ APOE from astrocytes restores Alzheimer’s Aβ-pathology and DAM-like responses in APOE deficient microglia > Discussion
What the sources say
- Partly supportedcites Bras et al, 2014 sourceExperimental — accuracy not yet measured
The Results and Discussion report an association between APOE ε4 and dementia with Lewy bodies. But the Discussion says this association is likely driven by the variant’s amyloid-β-promoting effect and only notes that other mechanisms cannot be excluded. The cited passages do not establish that other APOE4 mechanisms explain an association with Parkinson’s disease or substantiate the quoted odds-ratio ranges. (LLM, conf=0.88)
- Partly supportedcites Guerreiro et al, 2018 sourceExperimental — accuracy not yet measured
The Results report an APOE association with dementia with Lewy bodies (OR 2.40), supporting the lower end of the cited range. The Discussion says APOE ε4 has been implicated in cognitive impairment within Parkinson’s disease, but not in Parkinson’s disease risk itself. The paper does not establish that other mechanisms of APOE4 dysfunction explain these associations. (LLM, conf=0.88)
- Not checked — no full text of the sourcecites Huang et al, 2006 source
hedgedconditional- Asserted: passes — The authors put it forward as true.
- Checkable: passes — It can be checked against evidence.
- Load-bearing: fails — The paper’s conclusions may not depend on it.
- Based: passes — The paper gives a reason why it holds.
Probably not a substantial claim. The paper’s conclusions may not depend on it.
- Partly supported
The sources with a verdict support this claim; the rest weren’t checked yet, have no full text we could read, or their verdicts aren’t rated yet.
In the paper
“Astrocyte clusters were scored using seurat::AddModuleScore(), for markers from previously published genesets of astrocyte cell states (Zamanian et al, 2012; Hasel et al, 2021), plaque-induced genes (PIGs) (Chen et al, 2020) and AD risk genes (Bellenguez et al, 2022).”
§ APOE from astrocytes restores Alzheimer’s Aβ-pathology and DAM-like responses in APOE deficient microglia > Methods > Analysis of single-cell RNA sequencing datasets
What the sources say
- Supportedcites Zamanian et al, 2012 source
The citation to Zamanian et al. supports the astrocyte-cell-state gene sets, not the citing authors’ use of AddModuleScore or the separately cited plaque-induced and AD-risk gene sets. The Results section, “The reactive astrocyte transcriptomes show extensive induction of gene expression” (page unavailable), identifies reactive-astrocyte genes and uses them to distinguish astrocyte populations after different injuries. (LLM, conf=0.91)
- Not checked — no full text of the sourcecites Hasel et al, 2021 source
- Supportedcites Chen et al, 2020 source
The citation to Chen et al. is attached specifically to plaque-induced genes (PIGs), not to the scoring method or the other gene sets. In “Identification of the Plaque-Induced Genes (PIGs) module” (page unavailable), the paper identifies a 57-gene PIGs module associated with amyloid-β accumulation. (LLM, conf=0.94)
plain- Asserted: passes — The authors put it forward as true.
- Checkable: passes — It can be checked against evidence.
- Load-bearing: fails — The paper’s conclusions may not depend on it.
- Based: passes — The paper gives a reason why it holds.
Probably not a substantial claim. The paper’s conclusions may not depend on it.
- Supported
The cited sources support only part of this claim — read each source’s verdict below.
In the paper
“Note that 5 μM ActD was kept during collection and enzymatic dissociation of the tissue to preserve transcriptional state and prevent artificial induction stress-response genes during tissue dissociation (Marsh et al, 2022; Perocchi et al, 2007).”
§ APOE from astrocytes restores Alzheimer’s Aβ-pathology and DAM-like responses in APOE deficient microglia > Methods > FACS isolation of microglia and astrocytes
What the sources say
- Partly supportedcites Marsh et al, 2022 sourceExperimental — accuracy not yet measured
The Methods section, “Inhibitor cocktail to prevent activation” (page not provided), specifies actinomycin D in both dissection and digestion buffers, and the Main section says the inhibitor protocol prevents artifactual transcription during dissociation. The specified concentration is 5 μg ml−1, not 5 μM, and the protocol uses actinomycin D alongside other inhibitors rather than establishing that actinomycin D alone has this effect. (LLM, conf=0.90)
- Partly supportedcites Perocchi et al, 2007 sourceExperimental — accuracy not yet measured
The Introduction (page unavailable) states that ActD inhibits transcription, which supports the general rationale for limiting new transcription. But the paper uses ActD during reverse transcription of yeast RNA, not at 5 μM during tissue collection or enzymatic dissociation; it does not show prevention of dissociation-induced stress-response genes. Materials and Methods (page unavailable) instead specifies 6 μg/ml ActD during cDNA synthesis. (LLM, conf=0.85)
plaindirect- Asserted: passes — The authors put it forward as true.
- Checkable: passes — It can be checked against evidence.
- Load-bearing: passes — The paper’s conclusions depend on it.
- Based: passes — The paper gives a reason why it holds.
Probably not a substantial claim.
- Partly supported
Every source the paper cites for this claim was checked and supports it.
In the paper
“Recently it was reported that conditional knockout of microRNA miR155 in microglia in APP/PS1 mice leads to activation of interferon-mediated signalling, which was associated with increased phagocytosis and plaque compaction (Yin et al, 2023a).”
§ APOE from astrocytes restores Alzheimer’s Aβ-pathology and DAM-like responses in APOE deficient microglia > Discussion
What the sources say
- Supportedcites Yin et al, 2023a source
The Introduction reports that deleting microglial miR-155 in APP/PS1 mice induced an early response via IFNγ signaling, enhanced phagocytosis, and increased Aβ plaque compaction. The results passages also report enhanced IFN signaling and Aβ phagocytosis in the conditional-knockout mice. (LLM, conf=0.94)
plaindirect- Asserted: passes — The authors put it forward as true.
- Checkable: passes — It can be checked against evidence.
- Load-bearing: fails — The paper’s conclusions may not depend on it.
- Based: passes — The paper gives a reason why it holds.
Probably not a substantial claim. The paper’s conclusions may not depend on it. It may state two separate claims as one.
- Supported
The cited sources support only part of this claim — read each source’s verdict below.
In the paper
“At transcriptional level, microglia from the APOE4 group upregulated several DAM markers (Cd74, Cst7, Cd63, Cd9, Ccl6), complement cascade genes (C1qa, C1qb, C1qc) and the pro-inflammatory gene Nfkbia (Sousa et al, 2018), similar to transcriptomic changes in microglia from APOE4 AD individuals (Serrano-Pozo et al, 2021).”
§ APOE from astrocytes restores Alzheimer’s Aβ-pathology and DAM-like responses in APOE deficient microglia > Discussion
What the sources say
- Partly supportedcites Sousa et al, 2018 sourceExperimental — accuracy not yet measured
Split into 2 atoms — 0 confirmed, 1 partially supported, 0 disputed, 0 misattributed, 1 unverifiable. Expand the claim to see per-atom verdicts.
- Supportedcites Serrano-Pozo et al, 2021 source
Split into 2 atoms — 2 confirmed, 0 partially supported, 0 disputed, 0 misattributed, 0 unverifiable. Expand the claim to see per-atom verdicts.
plaincorrelational- Asserted: passes — The authors put it forward as true.
- Checkable: passes — It can be checked against evidence.
- Load-bearing: passes — The paper’s conclusions depend on it.
- Based: passes — The paper gives a reason why it holds.
It may state two separate claims as one.
- Partly supported
Every source the paper cites for this claim was checked and supports it.
In the paper
“Microglia are the main responders to amyloid plaques, mounting a DAM response (disease associated microglial cell-state response) (Keren-Shaul et al, 2017), which also causes the induction of APOE expression in these cells.”
§ APOE from astrocytes restores Alzheimer’s Aβ-pathology and DAM-like responses in APOE deficient microglia > Discussion
What the sources say
- Supportedcites Keren-Shaul et al, 2017 source
The Results identify disease-associated microglia (DAM) near Aβ plaques and report that an early transition to the DAM state includes upregulation of Apoe. The paper thus supports the attributed plaque-associated DAM response and APOE induction. (LLM, conf=0.90)
plaindirect- Asserted: passes — The authors put it forward as true.
- Checkable: passes — It can be checked against evidence.
- Load-bearing: passes — The paper’s conclusions depend on it.
- Based: passes — The paper gives a reason why it holds.
Probably not a substantial claim. It may state two separate claims as one.
- Supported
The cited sources support only part of this claim — read each source’s verdict below.
In the paper
“This is in line with evidence from brain samples of APOE4 patients showing downregulation of autophagy components (Parcon et al, 2018) and supports the role of astrocyte-mediated autophagy in degradation of Aβ (Simonovitch et al, 2016, 2019).”
§ APOE from astrocytes restores Alzheimer’s Aβ-pathology and DAM-like responses in APOE deficient microglia > Discussion
What the sources say
- Supportedcites Parcon et al, 2018 source
The Results section (“Autophagy mRNAs in Alzheimer brain”; page not provided) reports that brain samples from AD patients with APOE ε4/ε4 had lower levels of three autophagy-gene transcripts than samples from AD patients with APOE ε3/ε3. The Discussion also reports lower levels of the corresponding autophagy proteins. The separate claim about astrocyte-mediated Aβ degradation is attributed to Simonovitch et al., not Parcon et al. (LLM, conf=0.94)
- Not matchedcites Simonovitch et al, 2016, 2019
Couldn’t be matched to a paper in Crossref, so it can’t be checked.
plaindirect- Asserted: passes — The authors put it forward as true.
- Checkable: passes — It can be checked against evidence.
- Load-bearing: unclear — It is unclear whether the paper’s conclusions depend on it.
- Based: passes — The paper gives a reason why it holds.
It may state two separate claims as one.
- Supported
The cited sources support only part of this claim — read each source’s verdict below.
In the paper
“Haralick’s features are a well-established set of rotation invariant image statistics that have been used in medical classification issues across many fields and imaging modalities (Doyle et al, 2008; Gnep et al, 2017; Hapsari et al, 2022).”
§ APOE from astrocytes restores Alzheimer’s Aβ-pathology and DAM-like responses in APOE deficient microglia > Methods > Plaque IHC quantification
What the sources say
- Not checked — no full text of the sourcecites Doyle et al, 2008 source
- Partly supportedcites Gnep et al, 2017 sourceExperimental — accuracy not yet measured
The MRI Feature Extraction section describes Haralick features as image statistics derived from gray-level co-occurrence matrices and says the study averaged values across four directions. The Discussion describes their use in several cancers, but only in a few MRI studies. The paper does not establish that the features are inherently rotation invariant or used for medical classification across many fields and imaging modalities. Page numbers were not available in our copy. (LLM, conf=0.84)
- Partly supportedcites Hapsari et al, 2022 sourceExperimental — accuracy not yet measured
The Introduction describes Haralick features as GLCM-based texture statistics used for disease classification, and the Discussion reports tests on iris, brain MRI, and chest X-ray images. But the paper’s invariant features are invariant to gray-level quantization, not stated to be rotation invariant (Discussion and Conclusions; page numbers unavailable). (LLM, conf=0.88)
boosted- Asserted: passes — The authors put it forward as true.
- Checkable: passes — It can be checked against evidence.
- Load-bearing: fails — The paper’s conclusions may not depend on it.
- Based: passes — The paper gives a reason why it holds.
Probably not a substantial claim. The paper’s conclusions may not depend on it.
Every source the paper cites for this claim was checked and supports it.
In the paper
“The DAM response is dependent on APOE expression (Krasemann et al, 2017; Sala Frigerio et al, 2019) but it was thought that APOE expression in microglia was essential.”
§ APOE from astrocytes restores Alzheimer’s Aβ-pathology and DAM-like responses in APOE deficient microglia > Discussion
What the sources say
- Supportedcites Krasemann et al, 2017 source
The Results section reports that deleting Apoe in microglia represses disease-associated genes and restores homeostatic gene expression in phagocytic microglia (Figure 4F). It also explicitly concludes from global and microglia-specific deletion experiments that microglial Apoe has an essential role in the MGnD phenotype (Figures 4H–I). (LLM, conf=0.90)
- Supportedcites Sala Frigerio et al, 2019 source
The Discussion (page not provided) says the ARMs response overlaps with DAM and that deleting Apoe severely reduces the number of microglia with an ARMs signature. The Results section on Apoe deletion likewise reports that it impairs deployment of the ARMs response. The citation is attached to the dependence claim, not to the subsequent statement about microglial APOE being essential. (LLM, conf=0.90)
plaindirect- Asserted: passes — The authors put it forward as true.
- Checkable: passes — It can be checked against evidence.
- Load-bearing: passes — The paper’s conclusions depend on it.
- Based: passes — The paper gives a reason why it holds.
Probably not a substantial claim. It may state two separate claims as one.
- Supported
Every source the paper cites for this claim was checked and supports it.
In the paper
“Recent data also suggests a cell autonomous role of microglia-specific APOE4 expression in blocking the DAM response, compared to APOE3 (Yin et al, 2023b; Liu et al, 2023).”
§ APOE from astrocytes restores Alzheimer’s Aβ-pathology and DAM-like responses in APOE deficient microglia > Discussion
What the sources say
- Supportedcites Yin et al, 2023b source
The Discussion (p. 12) explicitly describes a cell-autonomous negative effect of microglial APOE4 on acquiring the neurodegenerative microglial (MGnD) phenotype. The Results (p. 3) show that APOE4-expressing microglia failed to induce this response compared with APOE3-expressing microglia, and that deleting microglial APOE4 restored it. This supports the citing sentence’s characterization of an impaired disease-associated microglial response. (LLM, conf=0.91)
- Supportedcites Liu et al, 2023 source
The Introduction identifies activated response microglia (ARM) as also termed disease-associated microglia (DAM). The Discussion reports that microglial apoE3 shifts cells toward ARM states under amyloid pathology, whereas apoE4 fails to do so; the Results likewise find that apoE3, but not apoE4, increases microglial clustering around plaques. This supports the hedged claim of a microglia-specific, isoform-dependent restriction of the DAM response. (LLM, conf=0.92)
hedgedconditional- Asserted: passes — The authors put it forward as true.
- Checkable: passes — It can be checked against evidence.
- Load-bearing: fails — The paper’s conclusions may not depend on it.
- Based: passes — The paper gives a reason why it holds.
Probably not a substantial claim. The paper’s conclusions may not depend on it.
- Supported
Every source the paper cites for this claim was checked and supports it.
In the paper
“Therefore, we propose that APOE4 is a “core” gene (Liu et al, 2019) of AD pathogenesis in the sense that the strong effect on amyloid pathology, a core pathway of AD, explains the strong specific association with AD (odds ratio ~3.7–14.5).”
§ APOE from astrocytes restores Alzheimer’s Aβ-pathology and DAM-like responses in APOE deficient microglia > Discussion
What the sources say
- Supportedcites Liu et al, 2019 source
The citation is attached to the term “core” gene, not to the citing authors’ proposal about APOE4. In Results, “The Omnigenic Model” (page unavailable), Liu et al. define core genes as genes that can affect disease risk directly. The APOE4 classification, amyloid explanation, and odds ratio are the citing authors’ own claims, not claims attributed to Liu et al. by this citation. (LLM, conf=0.93)
plaindirect- Asserted: passes — The authors put it forward as true.
- Checkable: passes — It can be checked against evidence.
- Load-bearing: unclear — It is unclear whether the paper’s conclusions depend on it.
- Based: passes — The paper gives a reason why it holds.
It may state two separate claims as one.
- Supported
Every source the paper cites for this claim was checked and supports it.
In the paper
“SuperExactTest (Wang et al, 2015) was used to calculate statistical significance (Datasets EV3, EV6) and visualize overlap of differentially expressed genes while comparing each group with APOE3.”
§ APOE from astrocytes restores Alzheimer’s Aβ-pathology and DAM-like responses in APOE deficient microglia > Methods > Analysis of single-cell RNA sequencing datasets
What the sources say
- Supportedcites Wang et al, 2015 source
The Discussion identifies SuperExactTest as an R package for statistical testing and visualization of set intersections. The Methods (Software Availability) shows commands for both testing overlaps and plotting them. The APOE3 comparison describes the citing authors’ use of the package, not an analysis attributed to Wang et al. (LLM, conf=0.92)
plain- Asserted: passes — The authors put it forward as true.
- Checkable: passes — It can be checked against evidence.
- Load-bearing: fails — The paper’s conclusions may not depend on it.
- Based: passes — The paper gives a reason why it holds.
Probably not a substantial claim. The paper’s conclusions may not depend on it. It may state two separate claims as one.
- Supported
Every source the paper cites for this claim was checked and supports it.
In the paper
“Enrichment of plaque-induced genes (PIGs) (Chen et al, 2020) in intersection of differentially expressed genes in microglia dataset was tested using hypergeometric test with Bonferroni correction of p-values.”
§ APOE from astrocytes restores Alzheimer’s Aβ-pathology and DAM-like responses in APOE deficient microglia > Methods > Statistical analysis
What the sources say
- Supportedcites Chen et al, 2020 source
The citation identifies the plaque-induced genes (PIGs), not the citing authors’ enrichment test. The source’s “Identification of the Plaque-Induced Genes (PIGs) module” section defines PIGs as a 57-gene module. The hypergeometric test and Bonferroni correction are described as the citing authors’ method and are not attributed to Chen et al. (LLM, conf=0.94)
plain- Asserted: passes — The authors put it forward as true.
- Checkable: passes — It can be checked against evidence.
- Load-bearing: fails — The paper’s conclusions may not depend on it.
- Based: passes — The paper gives a reason why it holds.
Probably not a substantial claim. The paper’s conclusions may not depend on it.
- Supported
A result the paper reports from its own data — it cites no other source for it, so there is none to check. The quote shows it is in the paper.
In the paper
“this increase in microglia population with plaque load was driven by increased number of plaque-associated microglia (R2 = 0.97, slope = 973.13, p = 2e−16) while the non-plaque-associated population remained relatively stable despite increase in plaque load (R2 = 0.5, slope = −242.04, p = 3.5e−05)”
§ APOE from astrocytes restores Alzheimer’s Aβ-pathology and DAM-like responses in APOE deficient microglia > Results > Fibrillar plaques induced by astrocyte-derived APOE elicit a reactive response in Apoe-deficient microglia
plaindirect- Asserted: passes — The authors put it forward as true.
- Checkable: passes — It can be checked against evidence.
- Load-bearing: passes — The paper’s conclusions depend on it.
- Based: passes — The paper gives a reason why it holds.
It may state two separate claims as one.
- Rests on an assumption: The AppNL-G-F x Apoe−/− mouse model is a valid model for studying APOE’s role in amyloid plaque pathology in Alzheimer’s disease.
A result the paper reports from its own data — it cites no other source for it, so there is none to check. The quote shows it is in the paper.
In the paper
“It is notable that especially in the APOE3 mice, the APOE levels are increased in the microglia-depleted brains (Appendix Fig. S5Bii). This increase in APOE levels was present in APOE4 mice as well (Appendix Fig. S5Biii), with APOE2 mice showing a similar non-significant trend (Appendix Fig. S5Bi).”
§ APOE from astrocytes restores Alzheimer’s Aβ-pathology and DAM-like responses in APOE deficient microglia > Results > Astrocyte-derived APOE is sufficient for fibrillar amyloid plaque pathology
plaindirect- Asserted: passes — The authors put it forward as true.
- Checkable: passes — It can be checked against evidence.
- Load-bearing: unclear — It is unclear whether the paper’s conclusions depend on it.
- Based: passes — The paper gives a reason why it holds.
It may state two separate claims as one.
A result the paper reports from its own data — it cites no other source for it, so there is none to check. The quote shows it is in the paper.
In the paper
“Interestingly, in our experimental paradigm, APOE2 expression only in astrocytes did not reduce the amyloid plaque formation compared to APOE3, even when APOE4 had significantly higher levels than both.”
§ APOE from astrocytes restores Alzheimer’s Aβ-pathology and DAM-like responses in APOE deficient microglia > Introduction
plain- Asserted: passes — The authors put it forward as true.
- Checkable: passes — It can be checked against evidence.
- Load-bearing: passes — The paper’s conclusions depend on it.
- Based: passes — The paper gives a reason why it holds.
It may state two separate claims as one.
- Rests on an assumption: The AppNL-G-F x Apoe−/− mouse model is a valid model for studying APOE’s role in amyloid plaque pathology in Alzheimer’s disease.
The paper states this without a source or data behind it here, so there is nothing to check it against. The quote shows it is in the paper.
In the paper
“Astrocytes expressing APOE showed altered transcriptional responses, with potential impairment of autophagy and proteostasis in those expressing APOE4.”
§ APOE from astrocytes restores Alzheimer’s Aβ-pathology and DAM-like responses in APOE deficient microglia > Abstract > Results
hedgedconditional- Asserted: passes — The authors put it forward as true.
- Checkable: passes — It can be checked against evidence.
- Load-bearing: unclear — It is unclear whether the paper’s conclusions depend on it.
- Based: passes — The paper gives a reason why it holds.
It may state two separate claims as one.
- Rests on an assumption: The AppNL-G-F x Apoe−/− mouse model is a valid model for studying APOE’s role in amyloid plaque pathology in Alzheimer’s disease.
A result the paper reports from its own data — it cites no other source for it, so there is none to check. The quote shows it is in the paper.
In the paper
“Interestingly, the APOE4 group which showed a high level of fibrillar plaque deposition, showed low levels of soluble Aβ aggregates (Fig. 1G).”
§ APOE from astrocytes restores Alzheimer’s Aβ-pathology and DAM-like responses in APOE deficient microglia > Results > Expression of APOE in astrocytes is sufficient to restore fibrillar amyloid plaque pathology
plaincorrelational- Asserted: passes — The authors put it forward as true.
- Checkable: passes — It can be checked against evidence.
- Load-bearing: unclear — It is unclear whether the paper’s conclusions depend on it.
- Based: passes — The paper gives a reason why it holds.
It may state two separate claims as one.
- Rests on an assumption: The AppNL-G-F x Apoe−/− mouse model is a valid model for studying APOE’s role in amyloid plaque pathology in Alzheimer’s disease.
A result the paper reports from its own data — it cites no other source for it, so there is none to check. The quote shows it is in the paper.
In the paper
“Moreover, we show that the APOE effect of astrocytes on amyloid plaques is largely cell autonomous, as in the absence of microglia, amyloid plaques are still generated.”
§ APOE from astrocytes restores Alzheimer’s Aβ-pathology and DAM-like responses in APOE deficient microglia > Introduction
plaindirect- Asserted: passes — The authors put it forward as true.
- Checkable: passes — It can be checked against evidence.
- Load-bearing: passes — The paper’s conclusions depend on it.
- Based: passes — The paper gives a reason why it holds.
It may state two separate claims as one.
- Rests on an assumption: The AppNL-G-F x Apoe−/− mouse model is a valid model for studying APOE’s role in amyloid plaque pathology in Alzheimer’s disease.
A result the paper reports from its own data — it cites no other source for it, so there is none to check. The quote shows it is in the paper.
In the paper
“Unbiased clustering analysis led to the identification of 7 sub-populations of microglia (Figs. EV2A,B, Dataset EV4–EV5).”
§ APOE from astrocytes restores Alzheimer’s Aβ-pathology and DAM-like responses in APOE deficient microglia > Results > Fibrillar plaques induced by astrocyte-derived APOE elicit a reactive response in Apoe-deficient microglia
plain- Asserted: passes — The authors put it forward as true.
- Checkable: passes — It can be checked against evidence.
- Load-bearing: fails — The paper’s conclusions may not depend on it.
- Based: passes — The paper gives a reason why it holds.
Probably not a substantial claim. The paper’s conclusions may not depend on it.
A result the paper reports from its own data — it cites no other source for it, so there is none to check. The quote shows it is in the paper.
In the paper
“However, we observed interesting shifts in gene signatures by performing differential gene expression analysis (Fig. EV3A, Dataset EV6).”
§ APOE from astrocytes restores Alzheimer’s Aβ-pathology and DAM-like responses in APOE deficient microglia > Results > Fibrillar plaques induced by astrocyte-derived APOE elicit a reactive response in Apoe-deficient microglia
plaincorrelational- Asserted: passes — The authors put it forward as true.
- Checkable: passes — It can be checked against evidence.
- Load-bearing: fails — The paper’s conclusions may not depend on it.
- Based: passes — The paper gives a reason why it holds.
Probably not a substantial claim. The paper’s conclusions may not depend on it.
A result the paper reports from its own data — it cites no other source for it, so there is none to check. The quote shows it is in the paper.
In the paper
“On the other hand, both the APOE2 group (β = −148.2, SE = 32.22, p = 0.0013) and the APOE4 group (β = −357.1, SE = 60.64, p = 0.0002) showed a statistically significant decrease in mean Aβ42 levels with PLX-treatment compared to the non-treated group (Fig. 5D).”
§ APOE from astrocytes restores Alzheimer’s Aβ-pathology and DAM-like responses in APOE deficient microglia > Results > Astrocyte-derived APOE is sufficient for fibrillar amyloid plaque pathology
plaindirect- Asserted: passes — The authors put it forward as true.
- Checkable: passes — It can be checked against evidence.
- Load-bearing: passes — The paper’s conclusions depend on it.
- Based: passes — The paper gives a reason why it holds.
It may state two separate claims as one.
A result the paper reports from its own data — it cites no other source for it, so there is none to check. The quote shows it is in the paper.
In the paper
“After filtering out non-microglial cells and low-quality cells, we retained 18,569 Apoe-deficient microglia over the four experimental groups (APOEKO, APOE2, APOE3 and APOE4).”
§ APOE from astrocytes restores Alzheimer’s Aβ-pathology and DAM-like responses in APOE deficient microglia > Results > Fibrillar plaques induced by astrocyte-derived APOE elicit a reactive response in Apoe-deficient microglia
plain- Asserted: passes — The authors put it forward as true.
- Checkable: passes — It can be checked against evidence.
- Load-bearing: fails — The paper’s conclusions may not depend on it.
- Based: passes — The paper gives a reason why it holds.
Probably not a substantial claim. The paper’s conclusions may not depend on it.
A result the paper reports from its own data — it cites no other source for it, so there is none to check. The quote shows it is in the paper.
In the paper
“Plaque-associated microglia clustered together with a significantly lower distance to neighbouring microglia, compared to the well-tiled microglia present away from plaques (Appendix Fig. S4E). Plaque-associated microglia also had significantly lower territory size (convex area) (Appendix Fig. S4Fi) and total process length (Appendix Fig. S4Fii)”
§ APOE from astrocytes restores Alzheimer’s Aβ-pathology and DAM-like responses in APOE deficient microglia > Results > Fibrillar plaques induced by astrocyte-derived APOE elicit a reactive response in Apoe-deficient microglia
plaincorrelational- Asserted: passes — The authors put it forward as true.
- Checkable: passes — It can be checked against evidence.
- Load-bearing: passes — The paper’s conclusions depend on it.
- Based: passes — The paper gives a reason why it holds.
It may state two separate claims as one.
- Rests on an assumption: The AppNL-G-F x Apoe−/− mouse model is a valid model for studying APOE’s role in amyloid plaque pathology in Alzheimer’s disease.
A result the paper reports from its own data — it cites no other source for it, so there is none to check. The quote shows it is in the paper.
In the paper
“Interestingly, among the different sets of DEGs, the highest intersection was observed between APOEKO and APOE4 (p = 4.2e−78), where 52 genes were commonly upregulated in the two groups (Fig. EV3A, EV3C, Dataset EV6)”
§ APOE from astrocytes restores Alzheimer’s Aβ-pathology and DAM-like responses in APOE deficient microglia > Results > Fibrillar plaques induced by astrocyte-derived APOE elicit a reactive response in Apoe-deficient microglia
plaincorrelational- Asserted: passes — The authors put it forward as true.
- Checkable: passes — It can be checked against evidence.
- Load-bearing: passes — The paper’s conclusions depend on it.
- Based: passes — The paper gives a reason why it holds.
It may state two separate claims as one.
A result the paper reports from its own data — it cites no other source for it, so there is none to check. The quote shows it is in the paper.
In the paper
“Interestingly, for the APOE3 group, like above (Fig. 1E), we found no significant association between Aβ42 levels and APOE levels and there was no significant shift in mean Aβ42 levels (β = −28.53, SE = 38.31, p = 0.4708) with PLX-treatment.”
§ APOE from astrocytes restores Alzheimer’s Aβ-pathology and DAM-like responses in APOE deficient microglia > Results > Astrocyte-derived APOE is sufficient for fibrillar amyloid plaque pathology
plain- Asserted: passes — The authors put it forward as true.
- Checkable: passes — It can be checked against evidence.
- Load-bearing: passes — The paper’s conclusions depend on it.
- Based: passes — The paper gives a reason why it holds.
It may state two separate claims as one.
A result the paper reports from its own data — it cites no other source for it, so there is none to check. The quote shows it is in the paper.
In the paper
“We confirm here in the AppNL-G-F mouse that despite the presence of strong aggregation promoting mutations in this particular Aβ sequence, Apoe deletion almost annihilates the generation of fibrillar amyloid plaques, while increasing the soluble Aβ aggregate species (Fig. 1).”
§ APOE from astrocytes restores Alzheimer’s Aβ-pathology and DAM-like responses in APOE deficient microglia > Discussion
boosteddirect- Asserted: passes — The authors put it forward as true.
- Checkable: passes — It can be checked against evidence.
- Load-bearing: passes — The paper’s conclusions depend on it.
- Based: passes — The paper gives a reason why it holds.
It may state two separate claims as one.
A result the paper reports from its own data — it cites no other source for it, so there is none to check. The quote shows it is in the paper.
In the paper
“At morphological level, we demonstrated increased microglial clustering (Fig. 4A), and specific staining of DAM markers (Fig. 4B) in Apoe−/− microglia surrounding the amyloid plaques.”
§ APOE from astrocytes restores Alzheimer’s Aβ-pathology and DAM-like responses in APOE deficient microglia > Discussion
boostedcorrelational- Asserted: passes — The authors put it forward as true.
- Checkable: passes — It can be checked against evidence.
- Load-bearing: passes — The paper’s conclusions depend on it.
- Based: passes — The paper gives a reason why it holds.
It may state two separate claims as one.
A result the paper reports from its own data — it cites no other source for it, so there is none to check. The quote shows it is in the paper.
In the paper
“At first glance, increased fibrilization might explain decreased levels of soluble Aβ aggregates, but the APOE2 allele causes more amyloid plaques than APOE3 in our model, while it also leaves more soluble Aβ aggregates in the extracellular milieu (Fig. 1C,G).”
§ APOE from astrocytes restores Alzheimer’s Aβ-pathology and DAM-like responses in APOE deficient microglia > Discussion
plaindirect- Asserted: passes — The authors put it forward as true.
- Checkable: passes — It can be checked against evidence.
- Load-bearing: passes — The paper’s conclusions depend on it.
- Based: passes — The paper gives a reason why it holds.
It may state two separate claims as one.
- Rests on an assumption: APOE3 is neutral.
A result the paper reports from its own data — it cites no other source for it, so there is none to check. The quote shows it is in the paper.
In the paper
“APOE3 expression in astrocytes in our experiments results in two phenomena: (1) the restoration of amyloid plaque formation at 6 months and (2) the decrease in soluble Aβ aggregates in these animals.”
§ APOE from astrocytes restores Alzheimer’s Aβ-pathology and DAM-like responses in APOE deficient microglia > Discussion
plaindirect- Asserted: passes — The authors put it forward as true.
- Checkable: passes — It can be checked against evidence.
- Load-bearing: passes — The paper’s conclusions depend on it.
- Based: passes — The paper gives a reason why it holds.
It may state two separate claims as one.
- Rests on an assumption: APOE3 is neutral.
A result the paper reports from its own data — it cites no other source for it, so there is none to check. The quote shows it is in the paper.
In the paper
“In addition, APOE2, but not APOE3, shows a dose-dependent relationship between level of expression and amyloid aggregation (Fig. 1E), as APOE4 does.”
§ APOE from astrocytes restores Alzheimer’s Aβ-pathology and DAM-like responses in APOE deficient microglia > Discussion
plaincorrelational- Asserted: passes — The authors put it forward as true.
- Checkable: passes — It can be checked against evidence.
- Load-bearing: unclear — It is unclear whether the paper’s conclusions depend on it.
- Based: passes — The paper gives a reason why it holds.
It may state two separate claims as one.
- Rests on an assumption: APOE3 is neutral.
A result the paper reports from its own data — it cites no other source for it, so there is none to check. The quote shows it is in the paper.
In the paper
“In our model, APOE expression with the AAV was induced in different subtypes of astrocytes in the mouse brain (Fig. 2A).”
§ APOE from astrocytes restores Alzheimer’s Aβ-pathology and DAM-like responses in APOE deficient microglia > Discussion
plain- Asserted: passes — The authors put it forward as true.
- Checkable: passes — It can be checked against evidence.
- Load-bearing: passes — The paper’s conclusions depend on it.
- Based: passes — The paper gives a reason why it holds.
Probably not a substantial claim.
The paper states this without a source or data behind it here, so there is nothing to check it against. The quote shows it is in the paper.
In the paper
“Enrichment of APOEKO group in Cluster a0, which is marked by processes related to lipid metabolism is expected in the absence of a lipoprotein like APOE.”
§ APOE from astrocytes restores Alzheimer’s Aβ-pathology and DAM-like responses in APOE deficient microglia > Discussion
plaindirect- Asserted: passes — The authors put it forward as true.
- Checkable: passes — It can be checked against evidence.
- Load-bearing: fails — The paper’s conclusions may not depend on it.
- Based: passes — The paper gives a reason why it holds.
Probably not a substantial claim. The paper’s conclusions may not depend on it.
A result the paper reports from its own data — it cites no other source for it, so there is none to check. The quote shows it is in the paper.
In the paper
“Cluster a6 which is exclusively present in the APOE-expressing groups, and thus also the plaque-bearing brains, is enriched for genes modulating inflammatory pathways which might play a role in astrocyte reactivity towards amyloid pathology.”
§ APOE from astrocytes restores Alzheimer’s Aβ-pathology and DAM-like responses in APOE deficient microglia > Discussion
hedgedcorrelational- Asserted: passes — The authors put it forward as true.
- Checkable: passes — It can be checked against evidence.
- Load-bearing: unclear — It is unclear whether the paper’s conclusions depend on it.
- Based: passes — The paper gives a reason why it holds.
It may state two separate claims as one.
The paper states this without a source or data behind it here, so there is nothing to check it against. The quote shows it is in the paper.
In the paper
“This was accompanied with limited plaque formation, compact plaques and low levels of oligomeric Aβ in the mice brain.”
§ APOE from astrocytes restores Alzheimer’s Aβ-pathology and DAM-like responses in APOE deficient microglia > Discussion
plaincorrelational- Asserted: passes — The authors put it forward as true.
- Checkable: passes — It can be checked against evidence.
- Load-bearing: unclear — It is unclear whether the paper’s conclusions depend on it.
- Based: passes — The paper gives a reason why it holds.
It may state two separate claims as one.
A claim is checked only against the cited paper’s full text, never its abstract, and none is available for its sources.
In the paper
“while the APOE2 variant was the first identified protective allele against AD (Corder et al, 1994; Nagy et al, 1995).”
§ APOE from astrocytes restores Alzheimer’s Aβ-pathology and DAM-like responses in APOE deficient microglia > Introduction
What the sources say
plaindirect- Asserted: passes — The authors put it forward as true.
- Checkable: passes — It can be checked against evidence.
- Load-bearing: fails — The paper’s conclusions may not depend on it.
- Based: passes — The paper gives a reason why it holds.
Probably not a substantial claim. The paper’s conclusions may not depend on it.
A conclusion the paper draws from its own results — it cites no other source for it, so there is none to check. The quote shows it is in the paper.
In the paper
“Therefore, at morphological level, microglial responses to fibrillar plaques do not seem to depend on the isoform of APOE produced by astrocytes but are likely mediated directly by the plaque load.”
§ APOE from astrocytes restores Alzheimer’s Aβ-pathology and DAM-like responses in APOE deficient microglia > Results > Fibrillar plaques induced by astrocyte-derived APOE elicit a reactive response in Apoe-deficient microglia
hedged- Asserted: passes — The authors put it forward as true.
- Checkable: passes — It can be checked against evidence.
- Load-bearing: passes — The paper’s conclusions depend on it.
- Based: passes — The paper gives a reason why it holds.
It may state two separate claims as one.
- Rests on an assumption: The AppNL-G-F x Apoe−/− mouse model is a valid model for studying APOE’s role in amyloid plaque pathology in Alzheimer’s disease.
What the paper did — it cites no source for this, so there is none to check. The quote shows it is in the paper.
In the paper
“However, we confirmed by immunofluorescence the lack of mCherry expression in NeuN+ neurons, Apc+ oligodendrocytes and Iba1+ microglia (Appendix Fig. S1D).”
§ APOE from astrocytes restores Alzheimer’s Aβ-pathology and DAM-like responses in APOE deficient microglia > Results > Expression of APOE in astrocytes is sufficient to restore fibrillar amyloid plaque pathology
plain- Asserted: passes — The authors put it forward as true.
- Checkable: passes — It can be checked against evidence.
- Load-bearing: passes — The paper’s conclusions depend on it.
- Based: passes — The paper gives a reason why it holds.
It may state two separate claims as one.
A conclusion the paper draws from its own results — it cites no other source for it, so there is none to check. The quote shows it is in the paper.
In the paper
“Therefore, this suggests that while APOE from astrocytes is sufficient for plaque deposition at 6 months of age in this model, microglia play a role in modulating Aβ pathology in APOE2 and APOE4 expressing mice.”
§ APOE from astrocytes restores Alzheimer’s Aβ-pathology and DAM-like responses in APOE deficient microglia > Results > Astrocyte-derived APOE is sufficient for fibrillar amyloid plaque pathology
hedgeddirect- Asserted: passes — The authors put it forward as true.
- Checkable: passes — It can be checked against evidence.
- Load-bearing: passes — The paper’s conclusions depend on it.
- Based: passes — The paper gives a reason why it holds.
It may state two separate claims as one.
A conclusion the paper draws from its own results — it cites no other source for it, so there is none to check. The quote shows it is in the paper.
In the paper
“As depletion of microglia was performed at 2 months and initial amyloid plaque seeding might have occurred already before that time point, we cannot rule out the possibility that microglia played a role in the APOE induced initial seeding of the plaques or that the remaining microglia are sufficient to induce plaque seeds.”
§ APOE from astrocytes restores Alzheimer’s Aβ-pathology and DAM-like responses in APOE deficient microglia > Results > Astrocyte-derived APOE is sufficient for fibrillar amyloid plaque pathology
hedgedconditional- Asserted: passes — The authors put it forward as true.
- Checkable: passes — It can be checked against evidence.
- Load-bearing: fails — The paper’s conclusions may not depend on it.
- Based: passes — The paper gives a reason why it holds.
Probably not a substantial claim. The paper’s conclusions may not depend on it. It may state two separate claims as one.
What the paper did — it cites no source for this, so there is none to check. The quote shows it is in the paper.
In the paper
“Using flow cytometry, we found that around 14% of ACSA2+ astrocytes expressed mCherry (Appendix Fig. S1Cii) and around 90% of the mCherry-positive cells were positive for astrocyte marker ACSA2 (Appendix Fig. S1Ciii).”
§ APOE from astrocytes restores Alzheimer’s Aβ-pathology and DAM-like responses in APOE deficient microglia > Results > Expression of APOE in astrocytes is sufficient to restore fibrillar amyloid plaque pathology
plain- Asserted: passes — The authors put it forward as true.
- Checkable: passes — It can be checked against evidence.
- Load-bearing: passes — The paper’s conclusions depend on it.
- Based: passes — The paper gives a reason why it holds.
It may state two separate claims as one.
The paper states this without a source or data behind it here, so there is nothing to check it against. The quote shows it is in the paper.
In the paper
“No consensus exists whether and how additional pathophysiological functions of APOE2 and APOE4 contribute to the specific risk of AD.”
§ APOE from astrocytes restores Alzheimer’s Aβ-pathology and DAM-like responses in APOE deficient microglia > Discussion
plain- Asserted: passes — The authors put it forward as true.
- Checkable: fails — It may be too vague to check against evidence.
- Load-bearing: fails — The paper’s conclusions may not depend on it.
- Based: fails — The paper may give no reason why it holds.
Probably not a substantial claim. It may be too vague to check against evidence. The paper’s conclusions may not depend on it. The paper may give no reason why it holds.
What the paper did — it cites no source for this, so there is none to check. The quote shows it is in the paper.
In the paper
“Since we have earlier seen that APOE levels also influence Aβ plaque deposition (Fig. 1E), we used multiple regression analysis to account for the confounding effect of APOE levels while comparing guanidine-soluble Aβ42 levels between PLX3397-treated and untreated animals in each experimental group (Fig. 5D).”
§ APOE from astrocytes restores Alzheimer’s Aβ-pathology and DAM-like responses in APOE deficient microglia > Results > Astrocyte-derived APOE is sufficient for fibrillar amyloid plaque pathology
plain- Asserted: passes — The authors put it forward as true.
- Checkable: passes — It can be checked against evidence.
- Load-bearing: passes — The paper’s conclusions depend on it.
- Based: passes — The paper gives a reason why it holds.
Probably not a substantial claim.
In the paper
“The protective effects of APOE3Ch downstream of the amyloid plaque formation (on which a relative modest effect was observed) were also seen in an AD amyloid mouse model where overexpression had stronger effect in reducing tau seeding and propagation along with neuronal dystrophy around plaques upon injection of AD-tau brain extract (Chen et al, 2023).”
§ APOE from astrocytes restores Alzheimer’s Aβ-pathology and DAM-like responses in APOE deficient microglia > Discussion
What the sources say
- Not matchedcites Chen et al, 2023
Couldn’t be matched to a paper in Crossref, so it can’t be checked.
plaindirect- Asserted: passes — The authors put it forward as true.
- Checkable: passes — It can be checked against evidence.
- Load-bearing: fails — The paper’s conclusions may not depend on it.
- Based: passes — The paper gives a reason why it holds.
Probably not a substantial claim. The paper’s conclusions may not depend on it. It may state two separate claims as one.
- Not matched
A conclusion the paper draws from its own results — it cites no other source for it, so there is none to check. The quote shows it is in the paper.
In the paper
“Thus, different APOE isoforms induce different transcriptomic responses in astrocytes in the AppNL-G-F mouse model, with potential impairment of proteostasis and autophagy in APOE4-expressing astrocytes.”
§ APOE from astrocytes restores Alzheimer’s Aβ-pathology and DAM-like responses in APOE deficient microglia > Results > APOE expression modulates astrocyte cell-states in AppNL-G-F mouse brain
hedgeddirect- Asserted: passes — The authors put it forward as true.
- Checkable: passes — It can be checked against evidence.
- Load-bearing: unclear — It is unclear whether the paper’s conclusions depend on it.
- Based: passes — The paper gives a reason why it holds.
It may state two separate claims as one.
- Rests on an assumption: The AppNL-G-F x Apoe−/− mouse model is a valid model for studying APOE’s role in amyloid plaque pathology in Alzheimer’s disease.
What the paper did — it cites no source for this, so there is none to check. The quote shows it is in the paper.
In the paper
“We also confirmed APOE expression in mCherry+ cells (Appendix Fig. S1E), demonstrating that we reconstituted human APOE expression in astrocytes.”
§ APOE from astrocytes restores Alzheimer’s Aβ-pathology and DAM-like responses in APOE deficient microglia > Results > Expression of APOE in astrocytes is sufficient to restore fibrillar amyloid plaque pathology
boosted- Asserted: passes — The authors put it forward as true.
- Checkable: passes — It can be checked against evidence.
- Load-bearing: passes — The paper’s conclusions depend on it.
- Based: passes — The paper gives a reason why it holds.
It may state two separate claims as one.
What the paper did — it cites no source for this, so there is none to check. The quote shows it is in the paper.
In the paper
“All experiments were conducted in accordance with institutional and national guidelines and regulations, following approval of Ethical Committee for Animal Experimentation at the University of Leuven (KU Leuven) (permit number P007/2017 and P072/2019).”
§ APOE from astrocytes restores Alzheimer’s Aβ-pathology and DAM-like responses in APOE deficient microglia > Methods > Methods and protocols
plain- Asserted: passes — The authors put it forward as true.
- Checkable: passes — It can be checked against evidence.
- Load-bearing: fails — The paper’s conclusions may not depend on it.
- Based: passes — The paper gives a reason why it holds.
Probably not a substantial claim. The paper’s conclusions may not depend on it. It may state two separate claims as one.
A conclusion the paper draws from its own results — it cites no other source for it, so there is none to check. The quote shows it is in the paper.
In the paper
“This process is receptor-mediated and therefore likely saturable, hence there was no concentration-dependent effect of APOE3 on uptake of Aβ in the overexpression condition of our experiment.”
§ APOE from astrocytes restores Alzheimer’s Aβ-pathology and DAM-like responses in APOE deficient microglia > Discussion
hedgeddirect- Asserted: passes — The authors put it forward as true.
- Checkable: passes — It can be checked against evidence.
- Load-bearing: passes — The paper’s conclusions depend on it.
- Based: passes — The paper gives a reason why it holds.
It may state two separate claims as one.
- Rests on an assumption: APOE is secreted by astrocytes and taken up via LDL receptors into endosomal compartments of all cell types in the brain, including microglia and astrocytes.
What the paper did — it cites no source for this, so there is none to check. The quote shows it is in the paper.
In the paper
“Contaminating cell types were identified (Appendix Fig. S6D, E) as ependymal cells (astrocyte QC Cluster 5), mural cells (astrocyte QC Cluster 7), microglia (astrocyte QC Cluster 9), endothelial cells (astrocyte QC Cluster 10) and a population of undetermined identity (astrocyte QC Cluster 8).”
§ APOE from astrocytes restores Alzheimer’s Aβ-pathology and DAM-like responses in APOE deficient microglia > Methods > Analysis of single-cell RNA sequencing datasets
plain- Asserted: passes — The authors put it forward as true.
- Checkable: passes — It can be checked against evidence.
- Load-bearing: fails — The paper’s conclusions may not depend on it.
- Based: passes — The paper gives a reason why it holds.
Probably not a substantial claim. The paper’s conclusions may not depend on it.
What the paper did — it cites no source for this, so there is none to check. The quote shows it is in the paper.
In the paper
“Cell hashing did not work efficiently for astrocytes, as a good proportion of cells identified as negatives had read counts in the same range as Singlet cells.”
§ APOE from astrocytes restores Alzheimer’s Aβ-pathology and DAM-like responses in APOE deficient microglia > Methods > Analysis of single-cell RNA sequencing datasets
plaindirect- Asserted: passes — The authors put it forward as true.
- Checkable: passes — It can be checked against evidence.
- Load-bearing: fails — The paper’s conclusions may not depend on it.
- Based: passes — The paper gives a reason why it holds.
Probably not a substantial claim. The paper’s conclusions may not depend on it.
What the paper did — it cites no source for this, so there is none to check. The quote shows it is in the paper.
In the paper
“Integration anchors were identified (Seurat::FindIntegrationAnchors()) and batch correction was performed (Seurat::IntegrateData()).”
§ APOE from astrocytes restores Alzheimer’s Aβ-pathology and DAM-like responses in APOE deficient microglia > Methods > Analysis of single-cell RNA sequencing datasets
plain- Asserted: passes — The authors put it forward as true.
- Checkable: passes — It can be checked against evidence.
- Load-bearing: fails — The paper’s conclusions may not depend on it.
- Based: passes — The paper gives a reason why it holds.
Probably not a substantial claim. The paper’s conclusions may not depend on it. It may state two separate claims as one.
What the paper did — it cites no source for this, so there is none to check. The quote shows it is in the paper.
In the paper
“Modified chow containing PLX3397 (600 mg/kg of chow) was administered to the mice for 4 months, starting at 2 months of age before onset of plaque deposition.”
§ APOE from astrocytes restores Alzheimer’s Aβ-pathology and DAM-like responses in APOE deficient microglia > Methods > PLX3397 treatment for microglia depletion
plain- Asserted: passes — The authors put it forward as true.
- Checkable: passes — It can be checked against evidence.
- Load-bearing: passes — The paper’s conclusions depend on it.
- Based: passes — The paper gives a reason why it holds.
Probably not a substantial claim. It may state two separate claims as one.
A conclusion the paper draws from its own results — it cites no other source for it, so there is none to check. The quote shows it is in the paper.
In the paper
“Our work shows that even in a relative circumscribed and limited part of Alzheimer’s disease pathogenesis, i.e., the formation of amyloid plaques and the microglia response to it, the different isoforms of APOE act in diverse and unanticipated ways, affecting amyloid plaques, Aβ soluble aggregates, but also the cellular reactions of microglia and astrocytes.”
§ APOE from astrocytes restores Alzheimer’s Aβ-pathology and DAM-like responses in APOE deficient microglia > Discussion
boosteddirect- Asserted: passes — The authors put it forward as true.
- Checkable: passes — It can be checked against evidence.
- Load-bearing: passes — The paper’s conclusions depend on it.
- Based: passes — The paper gives a reason why it holds.
It may state two separate claims as one.
What the paper did — it cites no source for this, so there is none to check. The quote shows it is in the paper.
In the paper
“After cell type annotation as described above, ~7% of cells had non-astrocyte identity.”
§ APOE from astrocytes restores Alzheimer’s Aβ-pathology and DAM-like responses in APOE deficient microglia > Methods > Analysis of single-cell RNA sequencing datasets
plain- Asserted: passes — The authors put it forward as true.
- Checkable: passes — It can be checked against evidence.
- Load-bearing: fails — The paper’s conclusions may not depend on it.
- Based: passes — The paper gives a reason why it holds.
Probably not a substantial claim. The paper’s conclusions may not depend on it.
A conclusion the paper draws from its own results — it cites no other source for it, so there is none to check. The quote shows it is in the paper.
In the paper
“APOE expression and Aβ pathology are closely associated in our model which makes it difficult to determine the factors contributing directly or indirectly to the DEG changes seen in microglia and astrocytes.”
§ APOE from astrocytes restores Alzheimer’s Aβ-pathology and DAM-like responses in APOE deficient microglia > Discussion
plaincorrelational- Asserted: passes — The authors put it forward as true.
- Checkable: passes — It can be checked against evidence.
- Load-bearing: fails — The paper’s conclusions may not depend on it.
- Based: passes — The paper gives a reason why it holds.
Probably not a substantial claim. The paper’s conclusions may not depend on it.
What the paper did — it cites no source for this, so there is none to check. The quote shows it is in the paper.
In the paper
“Reverse transcription of mRNA was done using the Superscript II reverse transcriptase. Real-time semi-quantitative PCR was performed using the SensiFast Sybr No-Rox kit for cDNA.”
§ APOE from astrocytes restores Alzheimer’s Aβ-pathology and DAM-like responses in APOE deficient microglia > Methods > RNA extraction and qPCR
plain- Asserted: passes — The authors put it forward as true.
- Checkable: passes — It can be checked against evidence.
- Load-bearing: fails — The paper’s conclusions may not depend on it.
- Based: passes — The paper gives a reason why it holds.
Probably not a substantial claim. The paper’s conclusions may not depend on it. It may state two separate claims as one.
What the paper did — it cites no source for this, so there is none to check. The quote shows it is in the paper.
In the paper
“~9% of cells had non-microglial identity with half of those having macrophage identity.”
§ APOE from astrocytes restores Alzheimer’s Aβ-pathology and DAM-like responses in APOE deficient microglia > Methods > Analysis of single-cell RNA sequencing datasets
plain- Asserted: passes — The authors put it forward as true.
- Checkable: passes — It can be checked against evidence.
- Load-bearing: fails — The paper’s conclusions may not depend on it.
- Based: passes — The paper gives a reason why it holds.
Probably not a substantial claim. The paper’s conclusions may not depend on it. It may state two separate claims as one.
What the paper did — it cites no source for this, so there is none to check. The quote shows it is in the paper.
In the paper
“To remove batch effects between libraries while cell clustering, the Seurat Object was split into individual libraries using Seurat::SplitObject().”
§ APOE from astrocytes restores Alzheimer’s Aβ-pathology and DAM-like responses in APOE deficient microglia > Methods > Analysis of single-cell RNA sequencing datasets
plaindirect- Asserted: passes — The authors put it forward as true.
- Checkable: passes — It can be checked against evidence.
- Load-bearing: fails — The paper’s conclusions may not depend on it.
- Based: passes — The paper gives a reason why it holds.
Probably not a substantial claim. The paper’s conclusions may not depend on it.
What the paper did — it cites no source for this, so there is none to check. The quote shows it is in the paper.
In the paper
“Finally, 18,667 astrocytes were retained for analysis as good-quality cells.”
§ APOE from astrocytes restores Alzheimer’s Aβ-pathology and DAM-like responses in APOE deficient microglia > Methods > Analysis of single-cell RNA sequencing datasets
plain- Asserted: passes — The authors put it forward as true.
- Checkable: passes — It can be checked against evidence.
- Load-bearing: fails — The paper’s conclusions may not depend on it.
- Based: passes — The paper gives a reason why it holds.
Probably not a substantial claim. The paper’s conclusions may not depend on it.
What the paper did — it cites no source for this, so there is none to check. The quote shows it is in the paper.
In the paper
“Only singlets were retained, as doublets and singlets had abnormally high and low number of reads, respectively, indicative of poor-quality cells.”
§ APOE from astrocytes restores Alzheimer’s Aβ-pathology and DAM-like responses in APOE deficient microglia > Methods > Analysis of single-cell RNA sequencing datasets
plaindirect- Asserted: passes — The authors put it forward as true.
- Checkable: passes — It can be checked against evidence.
- Load-bearing: fails — The paper’s conclusions may not depend on it.
- Based: passes — The paper gives a reason why it holds.
Probably not a substantial claim. The paper’s conclusions may not depend on it. It may state two separate claims as one.
A conclusion the paper draws from its own results — it cites no other source for it, so there is none to check. The quote shows it is in the paper.
In the paper
“Thus, it is possible that APOE-Aβ co-aggregates are taken up by microglia for clearance, and when microglia is depleted, this leads to increased levels of APOE in the mouse brain.”
§ APOE from astrocytes restores Alzheimer’s Aβ-pathology and DAM-like responses in APOE deficient microglia > Discussion
hedgedconditional- Asserted: passes — The authors put it forward as true.
- Checkable: passes — It can be checked against evidence.
- Load-bearing: fails — The paper’s conclusions may not depend on it.
- Based: passes — The paper gives a reason why it holds.
Probably not a substantial claim. The paper’s conclusions may not depend on it. It may state two separate claims as one.
What the paper did — it cites no source for this, so there is none to check. The quote shows it is in the paper.
In the paper
“Contaminating cell types were identified (Appendix Fig. S6A, B) as macrophages (microglia QC Cluster 4), endothelial cells (microglia QC Cluster 5), mix of astrocyte and microglial cells (microglia QC Cluster 6), monocytes (microglia QC Clusters 7 and 9), and oligodendrocytes (microglia QC Cluster 10).”
§ APOE from astrocytes restores Alzheimer’s Aβ-pathology and DAM-like responses in APOE deficient microglia > Methods > Analysis of single-cell RNA sequencing datasets
plain- Asserted: passes — The authors put it forward as true.
- Checkable: passes — It can be checked against evidence.
- Load-bearing: fails — The paper’s conclusions may not depend on it.
- Based: passes — The paper gives a reason why it holds.
Probably not a substantial claim. The paper’s conclusions may not depend on it. It may state two separate claims as one.
A conclusion the paper draws from its own results — it cites no other source for it, so there is none to check. The quote shows it is in the paper.
In the paper
“A downregulation of APOE expression is not mimicking the protective effects of APOE2, and APOE2 protective action is complex and remains poorly understood.”
§ APOE from astrocytes restores Alzheimer’s Aβ-pathology and DAM-like responses in APOE deficient microglia > Discussion
plain- Asserted: passes — The authors put it forward as true.
- Checkable: passes — It can be checked against evidence.
- Load-bearing: unclear — It is unclear whether the paper’s conclusions depend on it.
- Based: passes — The paper gives a reason why it holds.
It may state two separate claims as one.
A conclusion the paper draws from its own results — it cites no other source for it, so there is none to check. The quote shows it is in the paper.
In the paper
“However, this approach allowed to establish the dose-dependent effects of different APOE isoforms on amyloid deposition, helping to understand the effect of dose versus isoform.”
§ APOE from astrocytes restores Alzheimer’s Aβ-pathology and DAM-like responses in APOE deficient microglia > Discussion
plaindirect- Asserted: passes — The authors put it forward as true.
- Checkable: passes — It can be checked against evidence.
- Load-bearing: passes — The paper’s conclusions depend on it.
- Based: passes — The paper gives a reason why it holds.
It may state two separate claims as one.
What the paper did — it cites no source for this, so there is none to check. The quote shows it is in the paper.
In the paper
“Mice were randomly assigned to experimental groups (unblinded).”
§ APOE from astrocytes restores Alzheimer’s Aβ-pathology and DAM-like responses in APOE deficient microglia > Methods > Methods and protocols
plain- Asserted: passes — The authors put it forward as true.
- Checkable: passes — It can be checked against evidence.
- Load-bearing: fails — The paper’s conclusions may not depend on it.
- Based: passes — The paper gives a reason why it holds.
Probably not a substantial claim. The paper’s conclusions may not depend on it. It may state two separate claims as one.
What the paper did — it cites no source for this, so there is none to check. The quote shows it is in the paper.
In the paper
“the established method Labkit was found to be particularly good at identifying which pixels belonged to microglia but failed to distinguish individual microglia from each-other, especially around plaques, where microglia tend to cluster densely.”
§ APOE from astrocytes restores Alzheimer’s Aβ-pathology and DAM-like responses in APOE deficient microglia > Methods > Microglia IHC quantification
plain- Asserted: passes — The authors put it forward as true.
- Checkable: passes — It can be checked against evidence.
- Load-bearing: fails — The paper’s conclusions may not depend on it.
- Based: passes — The paper gives a reason why it holds.
Probably not a substantial claim. The paper’s conclusions may not depend on it. It may state two separate claims as one.
What the paper did — it cites no source for this, so there is none to check. The quote shows it is in the paper.
In the paper
“Among the different Haralick’s features, ASM was found to be the statistic most congruent with the visual differences between more diffuse and more dense plaques.”
§ APOE from astrocytes restores Alzheimer’s Aβ-pathology and DAM-like responses in APOE deficient microglia > Methods > Plaque IHC quantification
plaincorrelational- Asserted: passes — The authors put it forward as true.
- Checkable: passes — It can be checked against evidence.
- Load-bearing: fails — The paper’s conclusions may not depend on it.
- Based: passes — The paper gives a reason why it holds.
Probably not a substantial claim. The paper’s conclusions may not depend on it.
What the paper did — it cites no source for this, so there is none to check. The quote shows it is in the paper.
In the paper
“For representative images provided in Figures, brightness was adjusted, if necessary (by equal measure across all experimental groups), for better visualization.”
§ APOE from astrocytes restores Alzheimer’s Aβ-pathology and DAM-like responses in APOE deficient microglia > Methods > Immunohistochemistry (IHC)
plain- Asserted: passes — The authors put it forward as true.
- Checkable: passes — It can be checked against evidence.
- Load-bearing: fails — The paper’s conclusions may not depend on it.
- Based: passes — The paper gives a reason why it holds.
Probably not a substantial claim. The paper’s conclusions may not depend on it.
What the paper did — it cites no source for this, so there is none to check. The quote shows it is in the paper.
In the paper
“For sample collection, mice were euthanized using an overdose of carbon dioxide and perfused with ice-cold 1x DPBS.”
§ APOE from astrocytes restores Alzheimer’s Aβ-pathology and DAM-like responses in APOE deficient microglia > Methods > RNA extraction and qPCR
plain- Asserted: passes — The authors put it forward as true.
- Checkable: passes — It can be checked against evidence.
- Load-bearing: fails — The paper’s conclusions may not depend on it.
- Based: passes — The paper gives a reason why it holds.
Probably not a substantial claim. The paper’s conclusions may not depend on it.
A conclusion the paper draws from its own results — it cites no other source for it, so there is none to check. The quote shows it is in the paper.
In the paper
“Thus, in the absence of APOE, clearance of Aβ is lowered, resulting in increased soluble Aβ aggregates in the medium as demonstrated with the APOEKO.”
§ APOE from astrocytes restores Alzheimer’s Aβ-pathology and DAM-like responses in APOE deficient microglia > Discussion
boosteddirect- Asserted: passes — The authors put it forward as true.
- Checkable: passes — It can be checked against evidence.
- Load-bearing: passes — The paper’s conclusions depend on it.
- Based: passes — The paper gives a reason why it holds.
It may state two separate claims as one.
- Rests on an assumption: APOE is secreted by astrocytes and taken up via LDL receptors into endosomal compartments of all cell types in the brain, including microglia and astrocytes.
A conclusion the paper draws from its own results — it cites no other source for it, so there is none to check. The quote shows it is in the paper.
In the paper
“When a critical concentration of Aβ is reached in the endosomes, Aβ fibrilization is induced, leading to the release of Aβ fibrils and the generation of Aβ plaques extracellularly as seen in Fig. 1B,C and measured as an increase in guanidine extractable Aβ42 in Fig. 1E.”
§ APOE from astrocytes restores Alzheimer’s Aβ-pathology and DAM-like responses in APOE deficient microglia > Discussion
plaindirect- Asserted: passes — The authors put it forward as true.
- Checkable: passes — It can be checked against evidence.
- Load-bearing: passes — The paper’s conclusions depend on it.
- Based: passes — The paper gives a reason why it holds.
It may state two separate claims as one.
What the paper did — it cites no source for this, so there is none to check. The quote shows it is in the paper.
In the paper
“We also did not investigate possible gender- and ethnicity-specific effects of the different APOE isoforms.”
§ APOE from astrocytes restores Alzheimer’s Aβ-pathology and DAM-like responses in APOE deficient microglia > Discussion
plain- Asserted: passes — The authors put it forward as true.
- Checkable: passes — It can be checked against evidence.
- Load-bearing: fails — The paper’s conclusions may not depend on it.
- Based: passes — The paper gives a reason why it holds.
Probably not a substantial claim. The paper’s conclusions may not depend on it.
What the paper did — it cites no source for this, so there is none to check. The quote shows it is in the paper.
In the paper
“Out of the rest, ~31% separated out as clusters (astrocyte QC Clusters 1 and 6) with low number of reads and gene count (Appendix Fig. S6F).”
§ APOE from astrocytes restores Alzheimer’s Aβ-pathology and DAM-like responses in APOE deficient microglia > Methods > Analysis of single-cell RNA sequencing datasets
plain- Asserted: passes — The authors put it forward as true.
- Checkable: passes — It can be checked against evidence.
- Load-bearing: fails — The paper’s conclusions may not depend on it.
- Based: passes — The paper gives a reason why it holds.
Probably not a substantial claim. The paper’s conclusions may not depend on it.
What the paper did — it cites no source for this, so there is none to check. The quote shows it is in the paper.
In the paper
“To achieve the highest accuracy, a pipeline was built to combine the strengths of both methods.”
§ APOE from astrocytes restores Alzheimer’s Aβ-pathology and DAM-like responses in APOE deficient microglia > Methods > Microglia IHC quantification
plaindirect- Asserted: passes — The authors put it forward as true.
- Checkable: passes — It can be checked against evidence.
- Load-bearing: fails — The paper’s conclusions may not depend on it.
- Based: passes — The paper gives a reason why it holds.
Probably not a substantial claim. The paper’s conclusions may not depend on it.
What the paper did — it cites no source for this, so there is none to check. The quote shows it is in the paper.
In the paper
“Out of the rest ~10% separated out as a cluster (microglia QC Cluster 2) with low number of reads and gene count (Appendix Fig. S6C).”
§ APOE from astrocytes restores Alzheimer’s Aβ-pathology and DAM-like responses in APOE deficient microglia > Methods > Analysis of single-cell RNA sequencing datasets
plain- Asserted: passes — The authors put it forward as true.
- Checkable: passes — It can be checked against evidence.
- Load-bearing: fails — The paper’s conclusions may not depend on it.
- Based: passes — The paper gives a reason why it holds.
Probably not a substantial claim. The paper’s conclusions may not depend on it.
What the paper did — it cites no source for this, so there is none to check. The quote shows it is in the paper.
In the paper
“To avoid over-clustering or under-clustering, multiple resolutions were used for the FindCluster() function and clustree::clustree() was used for selecting an optimum resolution (astrocytes = 0.7; microglia = 0.4).”
§ APOE from astrocytes restores Alzheimer’s Aβ-pathology and DAM-like responses in APOE deficient microglia > Methods > Analysis of single-cell RNA sequencing datasets
plain- Asserted: passes — The authors put it forward as true.
- Checkable: passes — It can be checked against evidence.
- Load-bearing: fails — The paper’s conclusions may not depend on it.
- Based: passes — The paper gives a reason why it holds.
Probably not a substantial claim. The paper’s conclusions may not depend on it. It may state two separate claims as one.
A conclusion the paper draws from its own results — it cites no other source for it, so there is none to check. The quote shows it is in the paper.
In the paper
“It is clear that APOE plays an important role in the interaction between these cell types, with astrocytic APOE being a major driver of the amyloid plaque pathology which in its turn modifies the microglia response.”
§ APOE from astrocytes restores Alzheimer’s Aβ-pathology and DAM-like responses in APOE deficient microglia > Discussion
boosteddirect- Asserted: passes — The authors put it forward as true.
- Checkable: passes — It can be checked against evidence.
- Load-bearing: passes — The paper’s conclusions depend on it.
- Based: passes — The paper gives a reason why it holds.
It may state two separate claims as one.
What the paper did — it cites no source for this, so there is none to check. The quote shows it is in the paper.
In the paper
“For calculating p-values, MAST was used which is a GLM-framework that treats cellular detection rate as a covariate.”
§ APOE from astrocytes restores Alzheimer’s Aβ-pathology and DAM-like responses in APOE deficient microglia > Methods > Analysis of single-cell RNA sequencing datasets
plain- Asserted: passes — The authors put it forward as true.
- Checkable: passes — It can be checked against evidence.
- Load-bearing: fails — The paper’s conclusions may not depend on it.
- Based: passes — The paper gives a reason why it holds.
Probably not a substantial claim. The paper’s conclusions may not depend on it.
What the paper did — it cites no source for this, so there is none to check. The quote shows it is in the paper.
In the paper
“Finally, it was not possible to isolate microglia from the AAV-transduced regions only. This has likely diluted the effect size of changes we see in the microglia at transcriptomic level. This problem was not present for astrocytes where we could use the reporter to specifically enrich for the transduced cells.”
§ APOE from astrocytes restores Alzheimer’s Aβ-pathology and DAM-like responses in APOE deficient microglia > Discussion
hedgedconditional- Asserted: passes — The authors put it forward as true.
- Checkable: passes — It can be checked against evidence.
- Load-bearing: unclear — It is unclear whether the paper’s conclusions depend on it.
- Based: passes — The paper gives a reason why it holds.
It may state two separate claims as one.
What the paper did — it cites no source for this, so there is none to check. The quote shows it is in the paper.
In the paper
“Following forward and reverse primers were used for human APOE: 5′-GTTGCTGGTCACATTCCTGG-3′ and 3′-GCAGGTAATCCCAAAAGCGAC-5′.”
§ APOE from astrocytes restores Alzheimer’s Aβ-pathology and DAM-like responses in APOE deficient microglia > Methods > RNA extraction and qPCR
plain- Asserted: passes — The authors put it forward as true.
- Checkable: passes — It can be checked against evidence.
- Load-bearing: fails — The paper’s conclusions may not depend on it.
- Based: passes — The paper gives a reason why it holds.
Probably not a substantial claim. The paper’s conclusions may not depend on it.
What the paper did — it cites no source for this, so there is none to check. The quote shows it is in the paper.
In the paper
“ActD was removed from the myelin removal step to prevent toxicity derived from long-term exposure.”
§ APOE from astrocytes restores Alzheimer’s Aβ-pathology and DAM-like responses in APOE deficient microglia > Methods > FACS isolation of microglia and astrocytes
plaindirect- Asserted: passes — The authors put it forward as true.
- Checkable: passes — It can be checked against evidence.
- Load-bearing: fails — The paper’s conclusions may not depend on it.
- Based: passes — The paper gives a reason why it holds.
Probably not a substantial claim. The paper’s conclusions may not depend on it.
What the paper did — it cites no source for this, so there is none to check. The quote shows it is in the paper.
In the paper
“This more tailored solution was chosen over more prevalent methods like Imaris as it was unable to accurately segment physically touching and overlapping cell bodies with intertwining branches, in the absence of nuclei staining.”
§ APOE from astrocytes restores Alzheimer’s Aβ-pathology and DAM-like responses in APOE deficient microglia > Methods > Microglia IHC quantification
plain- Asserted: passes — The authors put it forward as true.
- Checkable: passes — It can be checked against evidence.
- Load-bearing: fails — The paper’s conclusions may not depend on it.
- Based: passes — The paper gives a reason why it holds.
Probably not a substantial claim. The paper’s conclusions may not depend on it.
A conclusion the paper draws from its own results — it cites no other source for it, so there is none to check. The quote shows it is in the paper.
In the paper
“Depletion of microglia in our model, demonstrated that even though astrocyte-derived APOE is sufficient to induce plaque formation by 6 months of age, there was still a significant decrease in amyloid level in the absence of microglia, suggesting that they modulate amyloid plaque formation.”
§ APOE from astrocytes restores Alzheimer’s Aβ-pathology and DAM-like responses in APOE deficient microglia > Discussion
hedgedconditional- Asserted: passes — The authors put it forward as true.
- Checkable: passes — It can be checked against evidence.
- Load-bearing: passes — The paper’s conclusions depend on it.
- Based: passes — The paper gives a reason why it holds.
It may state two separate claims as one.
What the paper did — it cites no source for this, so there is none to check. The quote shows it is in the paper.
In the paper
“Finally, 18,569 microglia were retained for analysis as good-quality cells.”
§ APOE from astrocytes restores Alzheimer’s Aβ-pathology and DAM-like responses in APOE deficient microglia > Methods > Analysis of single-cell RNA sequencing datasets
plain- Asserted: passes — The authors put it forward as true.
- Checkable: passes — It can be checked against evidence.
- Load-bearing: fails — The paper’s conclusions may not depend on it.
- Based: passes — The paper gives a reason why it holds.
Probably not a substantial claim. The paper’s conclusions may not depend on it.
What the paper did — it cites no source for this, so there is none to check. The quote shows it is in the paper.
In the paper
“Since there were differences in the gender ratio between the groups, gender identity was regressed out during differential expression using latent.vars parameter.”
§ APOE from astrocytes restores Alzheimer’s Aβ-pathology and DAM-like responses in APOE deficient microglia > Methods > Analysis of single-cell RNA sequencing datasets
plaindirect- Asserted: passes — The authors put it forward as true.
- Checkable: passes — It can be checked against evidence.
- Load-bearing: fails — The paper’s conclusions may not depend on it.
- Based: passes — The paper gives a reason why it holds.
Probably not a substantial claim. The paper’s conclusions may not depend on it.
What the paper did — it cites no source for this, so there is none to check. The quote shows it is in the paper.
In the paper
“Sample size estimation was based on pilot experiments.”
§ APOE from astrocytes restores Alzheimer’s Aβ-pathology and DAM-like responses in APOE deficient microglia > Methods > Statistical analysis
plain- Asserted: passes — The authors put it forward as true.
- Checkable: passes — It can be checked against evidence.
- Load-bearing: fails — The paper’s conclusions may not depend on it.
- Based: passes — The paper gives a reason why it holds.
Probably not a substantial claim. The paper’s conclusions may not depend on it.
What the paper did — it cites no source for this, so there is none to check. The quote shows it is in the paper.
In the paper
“Following forward and reverse primers were used for housekeeping genes mouse Gapdh: 5′-TTGATGGCAACAATCTCCAC-3′ and 3′-CGTCCCGTAGACAAAATGGT-5′, and Actin: 5′- GTGACGTTGACATCCGTAAAGA-3′ and 3′-GCCGGACTCATCGTACTCC-5′.”
§ APOE from astrocytes restores Alzheimer’s Aβ-pathology and DAM-like responses in APOE deficient microglia > Methods > RNA extraction and qPCR
plain- Asserted: passes — The authors put it forward as true.
- Checkable: passes — It can be checked against evidence.
- Load-bearing: fails — The paper’s conclusions may not depend on it.
- Based: passes — The paper gives a reason why it holds.
Probably not a substantial claim. The paper’s conclusions may not depend on it.
What the paper did — it cites no source for this, so there is none to check. The quote shows it is in the paper.
In the paper
“For comparison of ASM values in Figs. 2 and 5, the linear mixed-effects model was used with mouse ID and diameter of plaques as confounding factors.”
§ APOE from astrocytes restores Alzheimer’s Aβ-pathology and DAM-like responses in APOE deficient microglia > Methods > Statistical analysis
plain- Asserted: passes — The authors put it forward as true.
- Checkable: passes — It can be checked against evidence.
- Load-bearing: fails — The paper’s conclusions may not depend on it.
- Based: passes — The paper gives a reason why it holds.
Probably not a substantial claim. The paper’s conclusions may not depend on it.
What the paper did — it cites no source for this, so there is none to check. The quote shows it is in the paper.
In the paper
“Differential abundance of plaque-associated microglia around individual plaques in Fig. 4 was tested using binomial generalized linear mixed-effects model with mouse ID as confounding factor.”
§ APOE from astrocytes restores Alzheimer’s Aβ-pathology and DAM-like responses in APOE deficient microglia > Methods > Statistical analysis
plain- Asserted: passes — The authors put it forward as true.
- Checkable: passes — It can be checked against evidence.
- Load-bearing: fails — The paper’s conclusions may not depend on it.
- Based: passes — The paper gives a reason why it holds.
Probably not a substantial claim. The paper’s conclusions may not depend on it.
What the paper did — it cites no source for this, so there is none to check. The quote shows it is in the paper.
In the paper
“Differences in total number of differentially expressed genes between groups (compared to APOE3) was tested using Fisher’s exact test with Bonferroni correction of p-values.”
§ APOE from astrocytes restores Alzheimer’s Aβ-pathology and DAM-like responses in APOE deficient microglia > Methods > Statistical analysis
plain- Asserted: passes — The authors put it forward as true.
- Checkable: passes — It can be checked against evidence.
- Load-bearing: fails — The paper’s conclusions may not depend on it.
- Based: passes — The paper gives a reason why it holds.
Probably not a substantial claim. The paper’s conclusions may not depend on it.
What the paper did — it cites no source for this, so there is none to check. The quote shows it is in the paper.
In the paper
“ASM response variable was also log-transformed to improve the normality of the residuals.”
§ APOE from astrocytes restores Alzheimer’s Aβ-pathology and DAM-like responses in APOE deficient microglia > Methods > Statistical analysis
plain- Asserted: passes — The authors put it forward as true.
- Checkable: passes — It can be checked against evidence.
- Load-bearing: fails — The paper’s conclusions may not depend on it.
- Based: passes — The paper gives a reason why it holds.
Probably not a substantial claim. The paper’s conclusions may not depend on it.
What the paper did — it cites no source for this, so there is none to check. The quote shows it is in the paper.
In the paper
“mixed effects models were used to account for the variability between individual mice”
§ APOE from astrocytes restores Alzheimer’s Aβ-pathology and DAM-like responses in APOE deficient microglia > Methods > Statistical analysis
plain- Asserted: passes — The authors put it forward as true.
- Checkable: passes — It can be checked against evidence.
- Load-bearing: fails — The paper’s conclusions may not depend on it.
- Based: passes — The paper gives a reason why it holds.
Probably not a substantial claim. The paper’s conclusions may not depend on it.
What the paper did — it cites no source for this, so there is none to check. The quote shows it is in the paper.
In the paper
“Morphological differences between plaque-associated microglia and non-plaque-associated microglia in Fig. EV1 was tested using linear mixed-effects model with mouse ID as confounding factor.”
§ APOE from astrocytes restores Alzheimer’s Aβ-pathology and DAM-like responses in APOE deficient microglia > Methods > Statistical analysis
plain- Asserted: passes — The authors put it forward as true.
- Checkable: passes — It can be checked against evidence.
- Load-bearing: fails — The paper’s conclusions may not depend on it.
- Based: passes — The paper gives a reason why it holds.
Probably not a substantial claim. The paper’s conclusions may not depend on it.
What the paper did — it cites no source for this, so there is none to check. The quote shows it is in the paper.
In the paper
“Q-Q plots were used to assess the normality of the residuals”
§ APOE from astrocytes restores Alzheimer’s Aβ-pathology and DAM-like responses in APOE deficient microglia > Methods > Statistical analysis
plain- Asserted: passes — The authors put it forward as true.
- Checkable: passes — It can be checked against evidence.
- Load-bearing: fails — The paper’s conclusions may not depend on it.
- Based: passes — The paper gives a reason why it holds.
Probably not a substantial claim. The paper’s conclusions may not depend on it.
The paper relies on this without support.
The AppNL-G-F x Apoe−/− mouse model is a valid model for studying APOE’s role in amyloid plaque pathology in Alzheimer’s disease.
“In order to study the role of astrocyte-derived APOE on amyloid plaque pathology, we expressed the different human APOE isoforms (further referred to as APOE2, APOE3 and APOE4), along with reporter mCherry protein, specifically in astrocytes in an Apoe-deficient AD mouse model (AppNL-G-F x Apoe−/−)”
The paper relies on this without support.
The human APOE isoforms expressed in mouse astrocytes reproduce the isoform-specific effects of human APOE in Alzheimer’s disease.
“We express here the human APOE isoforms in astrocytes in an Apoe-deficient AD mouse model.”
The paper relies on this without support.
APOE3 is neutral.
“APOE3 that is considered neutral”
The paper relies on this without support.
APOE is secreted by astrocytes and taken up via LDL receptors into endosomal compartments of all cell types in the brain, including microglia and astrocytes.
“For the interpretation of the data, it is important to take into account that APOE is secreted here only by astrocytes but is taken up via LDL receptors into the endosomal compartments of all cell types in the brain, including the microglia and astrocytes.”
The paper relies on this without support.
APOE is under a constitutive promoter based on viral transduction and is not part of the normal transcriptional regulatory networks.
“In this overexpression model, since APOE is under a constitutive promoter based on viral transduction, and hence not a part of the normal transcriptional regulatory networks, we excluded human APOE gene expression from both astrocyte and microglia datasets prior to the following steps.”
Self-check
Percentages, sums and reported differences re-computed from the paper’s own numbers.
Rated minor: it would not touch a result — a value no result rests on, a p-value that stays on the same side of the significance level, or a conflict that is clerical, resolved elsewhere in the paper, or outside its own findings.
In the paper
“one founder mouse carrying an 846 bp deletion was selected and crossed with the original strain twice in order to cross out potential off targets events while keeping the background and genetic mutations of the strain. For standard PCR genotyping of the Apoe allele, primers 5′-CTCACGGATGGGCACTCAC-3′ and 5′-GCTCCCAAGTCACACAAGAA-3′ were used, resulting in an amplicon of 331 bp for the knock-out allele and in an amplicon of 1117 bp for the wild-type allele.”
§ APOE from astrocytes restores Alzheimer’s Aβ-pathology and DAM-like responses in APOE deficient microglia > Methods > Methods and protocols
Reported 846 · recomputed 786
Citations
Cites
Fiji: an open-source platform for biological-image analysis
Schindelin, J., Arganda-Carreras, I., Frise, E., Kaynig, V., Longair, M., Pietzsch, T., Preibisch, S., Rueden, C., Saalfeld, S., Schmid, B., et al. (2012) · Nature Methods · doi:10.1038/nmeth.2019 · Cited by 66,890
STAR: ultrafast universal RNA-seq aligner
Dobin, A., Davis, C. A., Schlesinger, F., Drenkow, J., Zaleski, C., Jha, S., Batut, P., Chaisson, M., & Gingeras, T. R. (2013) · Bioinformatics · doi:10.1093/bioinformatics/bts635 · Cited by 51,709
BEDTools: a flexible suite of utilities for comparing genomic features
Quinlan, A. R., & Hall, I. M. (2010) · Bioinformatics · doi:10.1093/bioinformatics/btq033 · Cited by 27,437
Textural Features for Image Classification
Haralick, R. M., Shanmugam, K., & Dinstein, I. (1973) · IEEE Transactions on Systems, Man, and Cybernetics · doi:10.1109/tsmc.1973.4309314 · Cited by 22,886
Integrated analysis of multimodal single-cell data
Hao, Y., Hao, S., Andersen-Nissen, E., Mauck, W. M., Zheng, S., Butler, A., Lee, M. J., Wilk, A. J., Darby, C., Zagar, M., et al. (2020) · doi:10.1101/2020.10.12.335331 · Cited by 15,508
Corder, E. H., Saunders, A. M., Strittmatter, W. J., Schmechel, D. E., Gaskell, P. C., Small, G. W., Roses, A. D., Haines, J. L., & Pericak-Vance, M. A. (1993) · Science · doi:10.1126/science.8346443 · Cited by 9,429
Massively parallel digital transcriptional profiling of single cells
Zheng, G. X. Y., Terry, J. M., Belgrader, P., Ryvkin, P., Bent, Z. W., Wilson, R., Ziraldo, S. B., Wheeler, T. D., McDermott, G. P., Zhu, J., et al. (2017) · Nature Communications · doi:10.1038/ncomms14049 · Cited by 7,353
scikit-image: image processing in Python
(2014) · doi:10.7717/peerj.453 · Cited by 6,794
A Unique Microglia Type Associated with Restricting Development of Alzheimer’s Disease
Keren-Shaul, H., Spinrad, A., Weiner, A., Matcovitch-Natan, O., Dvir-Szternfeld, R., Ulland, T. K., David, E., Baruch, K., Lara-Astaiso, D., Toth, B., et al. (2017) · Cell · doi:10.1016/j.cell.2017.05.018 · Cited by 5,493
Zhang, Y., Chen, K., Sloan, S. A., Bennett, M. L., Scholze, A. R., O'Keeffe, S., Phatnani, H. P., Guarnieri, P., Caneda, C., Ruderisch, N., et al. (2014) · The Journal of Neuroscience · doi:10.1523/jneurosci.1860-14.2014 · Cited by 4,875 · cited 2×
“The ALDH1L1 promoter is speci fi cally expressed in astrocytes in mouse brain (Cahoy et al, 2008; Zhang et al, 2014) and has been extensively used to target gene expression in an astrocyte-speci fi c setting (Clarke et al, 2018; Endo et al, 2022; Hasel et al, 2021; Mahan et al, 2022; Michalovicz et…”
Cited by
Sorted by citations
Baligács, N., Albertini, G., Borrie, S. C., Serneels, L., Pridans, C., Balusu, S., & De Strooper, B. (2024) · Nature Communications · doi:10.1038/s41467-024-54779-w · Cited by 123
Self-citationMicroglial Neuroinflammation in Alzheimer’s Disease: Mechanisms and Therapies
Erdağ, E., & Haskologlu, I. C. (2025) · Journal of dementia and Alzheimer's disease · doi:10.3390/jdad2030029 · Cited by 20
Emerging Role of Oligodendrocytes Malfunction in the Progression of Alzheimer's Disease
Tylek, K., & Basta‐Kaim, A. (2025) · Journal of Neuroimmune Pharmacology · doi:10.1007/s11481-025-10236-z · Cited by 19
Fertan, E., Hung, C., Danial, J. S. H., Lam, J. Y. L., Preman, P., Albertini, G., English, E. A., Böken, D., Livesey, F. J., Strooper, B. D., et al. (2024) · Brain Communications · doi:10.1093/braincomms/fcae454 · Cited by 16
Self-citationPeng, X., Yang, Z.-K., Guo, H., Wu, X., Ruganzu, J. B., Liu, Z.-Z., Wu, S.-D., & Yang, W.-N. (2025) · Molecular Neurobiology · doi:10.1007/s12035-025-05449-5 · Cited by 11
Farrell, C., Buhidma, Y., Mumford, P., Heywood, W. E., Hällqvist, J., Flores-Aguilar, L., Andrews, E. J., Rahimzadah, N., Taso, O. S., Doran, E., et al. (2025) · Acta Neuropathologica · doi:10.1007/s00401-025-02889-0 · Cited by 9
“Further research exploring the link between astrocytic APOE and disease progression in DSAD is warranted; given these data and recent preclinical work highlighting the importance of astrocytic APOE in disease development [55].”
Astrocytes as Therapeutic Targets in Neurodegenerative Disorders
Salas, I. H., Alfonso-Triguero, M., Castro, B. D., Elazar, N., Escartin, C., Akl, C. F., Hill, S. A., Quintana, F. J., & Arranz, A. M. (2025) · Journal of Neuroscience · doi:10.1523/jneurosci.1379-25.2025 · Cited by 10
Self-citationKaur, G., Dewangan, J. P., Kumari, A. R., & Shukla, R. (2025) · Journal of Microencapsulation · doi:10.1080/02652048.2025.2507637 · Cited by 7
Targeting Microglial Activation to Modulate Neuroinflammation in Alzheimer’s Disease
Patil, V., Sharma, A., Parekh, B. K., Farah, H., Jyothi, S. R., Mishra, S. S., Nanda, A., Al-Hasnaawei, S., & Mishra, M. K. (2025) · NeuroMolecular Medicine · doi:10.1007/s12017-025-08898-2 · Cited by 9
Wang, S., Wang, J., Hu, Z., Wu, L., & Huang, L. (2026) · Experimental Neurology · doi:10.1016/j.expneurol.2026.115663 · Cited by 7
Yan, P., Wang, J., Zhao, X., Wang, L., Xu, J., Li, W., Min, W., Wu, D., & Liu, C. (2025) · Food Bioscience · doi:10.1016/j.fbio.2025.106041 · Cited by 6
Astrocytic lipid dysregulation as an early driver of neurodegeneration
Kim, W. S., & Halliday, G. M. (2026) · Nature Reviews Neurology · doi:10.1038/s41582-026-01238-3 · Cited by 5
ApoE expression across the CNS: Who, What, Where, When, and How (much)?
Nolt, G. L., Lucido, C. C., Smith, L. M., & Johnson, L. A. (2026) · Molecular Neurodegeneration Advances · doi:10.1186/s44477-026-00028-x · Cited by 2
Wang, M., Niu, D., Zhang, Q., Tang, Y., Zhao, Y., & Chen, F. (2026) · International Journal of Biological Macromolecules · doi:10.1016/j.ijbiomac.2026.151352 · Cited by 2
Wu, J., Lu, X., Zhang, J., Shuaihan, W., Lu, Z., Han, Y., Yang, R., Su, Y., Tan, C., Huo, D., et al. (2026) · Cell Reports · doi:10.1016/j.celrep.2026.117193 · Cited by 3
Yuan, N. Y., Richards, W. D., Parham, K. T., Clark, S. G., & Lebakken, C. S. (2026) · Cells · doi:10.3390/cells15141266 · Cited by 2
de Souza, M. R. M., Lindner, M. R., Mladinich, M. C., Gorbunova, E. E., Kirillov, V., Byrne, A. G., Laird, A. Y., Finnerty, C. E., Ikeda, P., Vorkas, C. K., et al. (2026) · mBio · doi:10.1128/mbio.01294-26 · Cited by 2
Bevan, R. J., Maguire, E., Mackinnon, E., Salis, E., Phillips, T., Simonazzi, E., Vassileva, M., Allen, N. D., Williams, J., & Taylor, P. R. (2026) · Glia · doi:10.1002/glia.70192 · Cited by 1
Regular exercise ameliorates cognitive function in APOE-/- mice via the VEGF/ERK signaling pathway
Wang, Z., Yang, Q., Tong, X., Liao, M., Hu, Z., Huang, S., Wang, P., Tong, Z., Chen, Y. Q., Wang, Y., et al. (2025) · Behavioural Brain Research · doi:10.1016/j.bbr.2025.116005 · Cited by 1
Wang, R., Feng, Y., Zhou, Z., Jiang, J., Zhang, R., Zou, W., Yang, H., Lv, W., & Shen, Y. (2026) · Frontiers in Aging Neuroscience · doi:10.3389/fnagi.2026.1748418 · Cited by 2
Peng, X., Ouyang, C., Ma, F., Liu, Y., Luo, L., Xing, J., Feng, S., Li, L., Zhang, G., Wang, J., et al. (2026) · Cell Communication and Signaling · doi:10.1186/s12964-026-02787-2 · Cited by 1
Cholesterol metabolism in neurodegenerative diseases: mechanisms and therapeutic advances
Tu, D., Zheng, Y., Ding, P., Shen, M., Tang, W., Wei, B., & Wang, H. (2026) · Molecular Neurodegeneration · doi:10.1186/s13024-026-00951-3 · Cited by 1
Li, E., Zhang, P., & Feng, W. (2026) · Frontiers in Immunology · doi:10.3389/fimmu.2026.1783786 · Cited by 1
Krishnan, L., Gunasekaran, G., Dhore, T., Lauinger, A., Kolachalama, V. B., & Pappu, S. (2026) · Frontiers in Dementia · doi:10.3389/frdem.2026.1865441 · Cited by 1
Li, D., Zhang, Z., Lei, L. U., Liu, J., Cai, W., Hou, J., Lu, Y., & Yu, G. (2026) · Cellular Signalling · doi:10.1016/j.cellsig.2026.112689 · Cited by 4
Cruz-Sesé, J., Miron-Alcala, M., Alfonso-Triguero, M., Olalde, J., Ruiz, L., Galbis-Gramage, N., Cortés, L., Escobar, L., Preman, P., Snellinx, A., et al. (2026) · Cell Reports · doi:10.1016/j.celrep.2026.117803 · Cited by 1
Self-citationApolipoprotein E and autoimmune disorders: Therapeutic frontier
Pandey, S., Nayak, R., Pai, K. S. R., & Kumar, D. (2026) · Elsevier eBooks · doi:10.1016/b978-0-443-40563-1.00013-2
Alzweiri, M. H., Agha, A. S. A. A., Qinna, N. A., AlDabet, G., Khassawna, T. E., & Aburjai, T. A. (2026) · Biomedicines · doi:10.3390/biomedicines14081823
Chandrashekar, D. V., Roules, G. C., Panchal, U. R., Jagadeesan, N., Newhart, C., Chu, J., Carson, B., Win, S., Than, T. A., Kaplowitz, N., et al. (2026) · Research Square · doi:10.21203/rs.3.rs-10843451/v1
Liu, A., Xing, L., Li, J., Gao, W., Yao, M., Song, J., & Li, H. (2026) · Ageing Research Reviews · doi:10.1016/j.arr.2026.103352
Dynamic contributions of astrocytes in Alzheimer’s disease
Guo, F., Li, T., & He, X. (2026) · Experimental Neurology · doi:10.1016/j.expneurol.2026.116032
Li, X., Li, Y., Li, Y., Wang, W., Ma, S., Li, J., Cheng, X., Guang, C., Hong, E., Chen, H., et al. (2026) · Frontiers in Aging Neuroscience · doi:10.3389/fnagi.2026.1947643
Metadata
- Authors
- Preman, P., Moechars, D., Fertan, E., Wolfs, L., Serneels, L., Shah, D., Lamote, J., Poovathingal, S., Snellinx, A., Mancuso, R., Balusu, S., Klenerman, D., Arranz, A. M., Fiers, M., & De Strooper, B.
- Affiliations
- VIB-KU Leuven Center for Brain & Disease Research (BE)
- University of Cambridge (GB)
- VIB-KU Leuven Center for Cancer Biology (BE)
- University of Antwerp (BE)
- Ikerbasque (ES)
- Corresponding author
- Fiers, Mark
- ORCID
- Venue
- EMBO Molecular Medicine
- Published
- 2024-11-11
- Volume
- 16
- Issue
- 12
- Pages
- 3113-3141
- ISSN
- 1757-4676 (ISSN-L)
- 1757-4684
- PMC
- PMC11628604
- OpenAlex
- W4404242617
- Cited by
- 32
- References
- 203
- Citations by year
- 2026: 21 · 2025: 9 · 2024: 2
- FWCI
- 9.04
- Type
- journal article
- Language
- en
- Open access
- gold
- doi.org
- Locations
- EMBO Molecular Medicine (publishedVersion, cc-by)
- PubMed Central (publishedVersion, cc-by)
- PubMed (publishedVersion)
- UCL Discovery (University College London) (submittedVersion, cc-by)
- Lirias (KU Leuven) (submittedVersion, cc-by)
- Apollo (University of Cambridge) (submittedVersion, cc-by)
- DOAJ (DOAJ: Directory of Open Access Journals) (submittedVersion)
- Funders
- UK Research and Innovation (MR/Y014847/1)
- EC | European Research Council (ERC-834682)
- Vlaams Instituut voor Biotechnologie
- KU Leuven
- UK Dementia Research Institute
- Fonds voor Wetenschappelijk Onderzoek
- The Queen Elisabeth Medical Foundation for Neurosciences
- Leuven Universitair Fonds
- The Belgian Alzheimer Research Foundation
- Alzheimer's Association USA
- Ministerio de Ciencia e Innovación (MCIN/AEI/10.13039/501100011033)
- Basque government, Spain (PIBA-2020-1-0030)
- Topics
- Life Sciences › Neuroscience › Cellular and Molecular Neuroscience › Alzheimer's disease research and treatments
- Life Sciences › Neuroscience › Neurology › Neuroinflammation and Neurodegeneration Mechanisms
- Health Sciences › Medicine › Psychiatry and Mental health › Dementia and Cognitive Impairment Research
- Keywords
- apolipoprotein E, Alzheimer's disease, astrocytes, microglia, amyloid plaques, APOE ε4, APOE2, ApoE-deficient mice, astrocyte-microglia interaction, APOE isoforms
- MeSH terms
- Alzheimer Disease, Animals, Apolipoproteins E, Astrocytes, Disease Models, Animal, Humans, Mice, Transgenic, Amyloid beta-Peptides, Microglia, Mice, Apolipoprotein E4, Plaque, Amyloid
About these checks
Registry, retraction, Cites and statistics results are computed, not judged, with one exception: a printed reference that no index lists is read once by a model before it counts as a citation error. Claims are extracted by a model and kept only when their quote appears verbatim in the text; each cited source is then checked, with a model’s help, for whether it says what the claim relies on. Those verdicts can be wrong — read the claim’s quote and the cited source before relying on one.
A language model drew the claims from the paper on 2026-11-02, under version 3 of the claim definition (model deepseek-v4.1-flash, prompt extract-v3).
A second model labelled each claim on 2026-11-02 (model jev-1.13-20260917, definition revision gold-guideline-v0.2).
Cited sources are checked with a language model’s help (gpt-6-sol).
Statistics and arithmetic are recomputed, not judged.
Confidence bands are shown only for fields calibrated on our annotated test set. None is calibrated yet, so no band is shown.
What counts as a claim ›How we measure confidence ›How we check this ›
Are you an author, or do you see a problem with this page? Request a review
