

Building an organic computing device with multiple interconnected brains
Open accessThe DOI matches its Crossref record; 17 of the 18 references it cites were found in a registry or an index.
Abstract
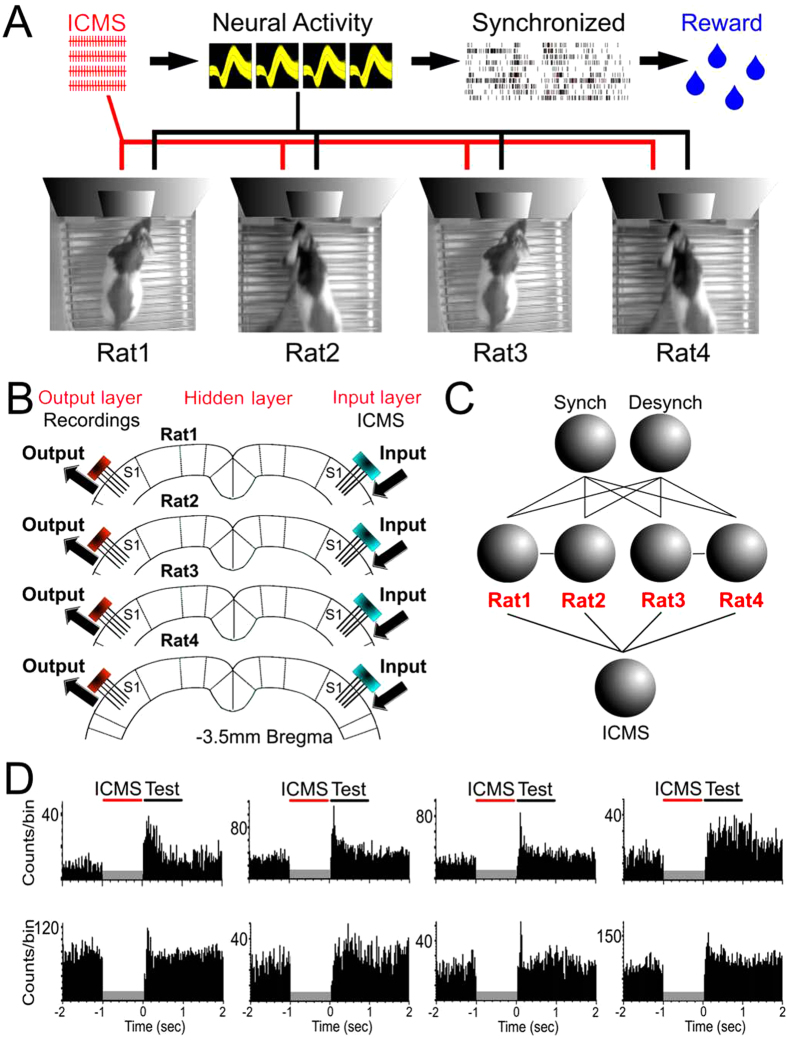
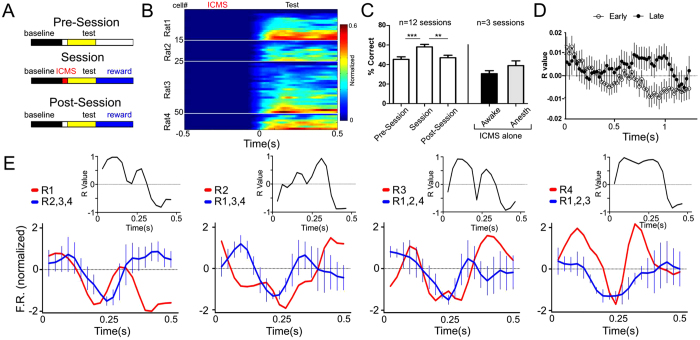
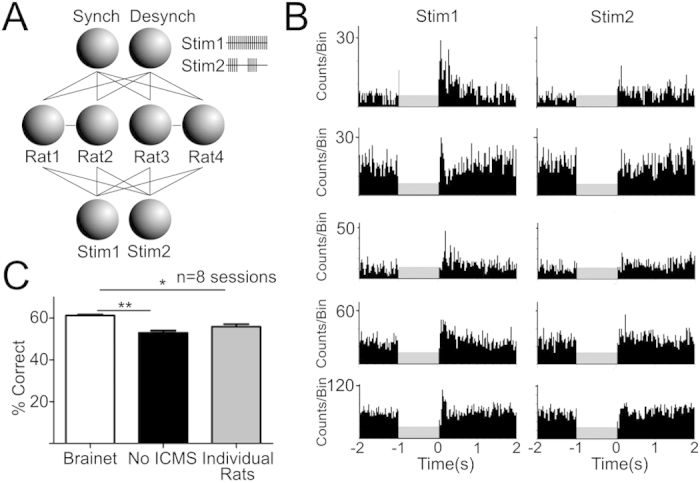
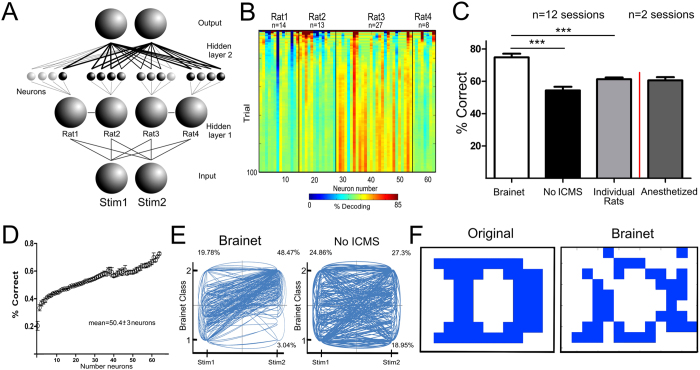
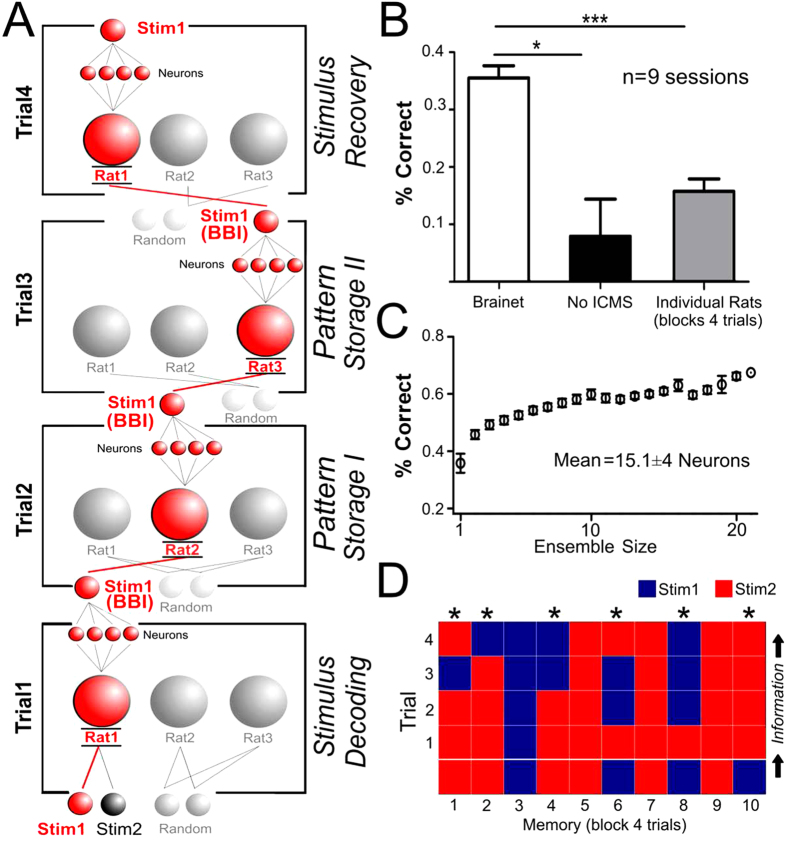
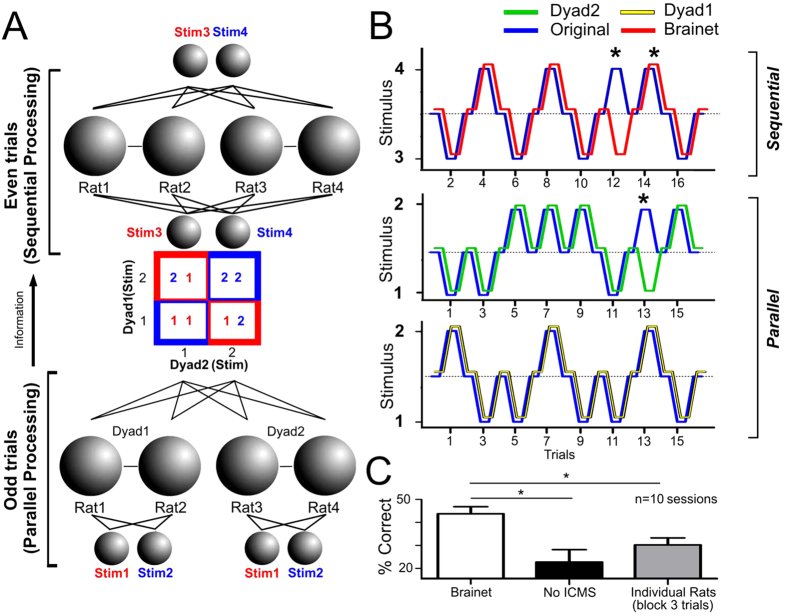
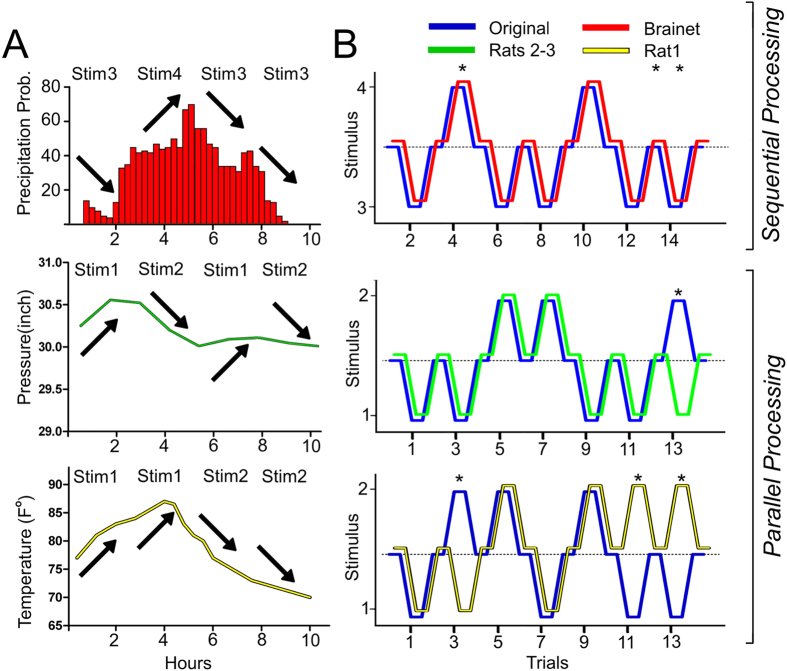
Recently, we proposed that Brainets, i.e. networks formed by multiple animal brains, cooperating and exchanging information in real time through direct brain-to-brain interfaces, could provide the core of a new type of computing device: an organic computer. Here, we describe the first experimental demonstration of such a Brainet, built by interconnecting four adult rat brains. Brainets worked by concurrently recording the extracellular electrical activity generated by populations of cortical neurons distributed across multiple rats chronically implanted with multi-electrode arrays. Cortical neuronal activity was recorded and analyzed in real time and then delivered to the somatosensory cortices of other animals that participated in the Brainet using intracortical microstimulation (ICMS). Using this approach, different Brainet architectures solved a number of useful computational problems, such as discrete classification, image processing, storage and retrieval of tactile information and even weather forecasting. Brainets consistently performed at the same or higher levels than single rats in these tasks. Based on these findings, we propose that Brainets could be used to investigate animal social behaviors as well as a test bed for exploring the properties and potential applications of organic computers.
Overview
The claims and statistics of this paper haven’t been checked yet.
Free: it reads the open-access text and checks the first 5 claims that cite a source we can check. Create a free account to check every claim.
Integrity signals
Registry
Cites
Statistics
Figures
Verification
Claims the paper makes
The claims and statistics of this paper haven’t been checked yet.
Free: it reads the open-access text and checks the first 5 claims that cite a source we can check. Create a free account to check every claim.
Claims other papers make about this one
Each is checked against this paper’s own text: does it say what the citing paper says it does?
The source backs part of the claim, not all of it — or backs it for a different population, condition or comparison.
In the citing paper
“However, the animals were entirely unaware of both the actual task being solved and of their collaboration with others”
From BrainNet: A Multi-Person Brain-to-Brain Interface for Direct Collaboration Between Brains (2019) · cites this paper as [24]
Experimental — accuracy not yet measuredThe source backs part of the claim, not all of it — or backs it for a different population, condition or comparison.
In the citing paper
“A four-brain Brainet system was dubbed an “organic computer” for mimicking simple computer-like operations, such as information-input retention, in a memory-like buffer composed of four serially connected rat brains (Pais-Vieira et al., 2015). This experimental Brainet system always outperformed single-brain computation performance, particularly for discrimination tasks, in which the four brains “”
From Human Brain/Cloud Interface (2019) · cites this paper as Pais-Vieira et al., 2015
Experimental — accuracy not yet measuredThe cited source says what the claim attributes to it.
In the citing paper
“More closely related to our study is the work of Pais-Vieira et al.24, who used implanted electrodes to both decode information from and transmit information to the somatosensory cortices of multiple rodents to demonstrate the possibility of distributing computations across multiple brains.”
From BrainNet: A Multi-Person Brain-to-Brain Interface for Direct Collaboration Between Brains (2019) · cites this paper as [24]
The cited source says what the claim attributes to it.
In the citing paper
“The brains of the rats were linked to solve several computational problems including a weather forecasting task based on weather data from a local airport.”
From BrainNet: A Multi-Person Brain-to-Brain Interface for Direct Collaboration Between Brains (2019) · cites this paper as [24]
Self-check
Percentages, sums and reported differences re-computed from the paper’s own numbers.
The self-check needs the paper’s full text.
Citations
Cites
Introduction to parallel computing
(2004) · Choice Reviews Online · doi:10.5860/choice.42-0990 · Cited by 1,843
Learning to control a brain–machine interface for reaching and grasping by primates
Carmena, J. M., Lebedev, M. A., Crist, R. E., O'Doherty, J. E., Santucci, D. M., Dimitrov, D. F., Patil, P. G., Henriquez, C. S., & Nicolelis, M. A. L. (2003) · PLoS Biology · doi:10.1371/journal.pbio.0000042 · Cited by 1,761 · cited 1×
“According to this analysis, Brainets formed by larger cortical neuronal ensembles performed better than those containing just a few neurons 9 .”
MethodSelf-citationCombinatorics and Graph Theory
Harris, J., Hirst, J. L., & Mossinghoff, M. (2008) · Undergraduate Texts in Mathematics · doi:10.1007/978-0-387-79711-3 · Cited by 347
The Mathematical Analysis of Logic: Being an Essay Towards a Calculus of Deductive Reasoning
Boole, G. (2007) · Medical Entomology and Zoology · Cited by 309
Methods for NEURAL ENSEMBLE RECORDINGS
(1998) · CRC Press eBooks · doi:10.1201/9781420048254 · Cited by 285
Self-citationA Brain-to-Brain Interface for Real-Time Sharing of Sensorimotor Information
Pais-Vieira, M., Lebedev, M., Kunicki, C., Wang, J., & Nicolelis, M. A. L. (2013) · Scientific Reports · doi:10.1038/srep01319 · Cited by 252 · cited 4×
“These features are of utmost importance since they allowed Brainets to retain the computational aptitudes of the awake brain 11 and, in addition, to benefit from emergent properties resulting from the interactions between multiple individuals 2 .”
BackgroundMethodResultInfluentialSelf-citationConscious Brain-to-Brain Communication in Humans Using Non-Invasive Technologies
Grau, C., Ginhoux, R., Riera, A., Nguyen, T. L., Chauvat, H., Berg, M., Amengual, J. L., Pascual-Leone, A., & Ruffini, G. (2014) · PLoS ONE · doi:10.1371/journal.pone.0105225 · Cited by 211
A Direct Brain-to-Brain Interface in Humans
Rao, R. P. N., Stocco, A., Bryan, M., Sarma, D., Youngquist, T. M., Wu, J., & Prat, C. S. (2014) · PLoS ONE · doi:10.1371/journal.pone.0111332 · Cited by 210
Layer-Specific Somatosensory Cortical Activation During Active Tactile Discrimination
Krupa, D. J., Wiest, M. C., Shuler, M. G., Laubach, M., & Nicolelis, M. A. L. (2004) · Science · doi:10.1126/science.1093318 · Cited by 208 · cited 1×
“These features are of utmost importance since they allowed Brainets to retain the computational aptitudes of the awake brain 11 and, in addition, to benefit from emergent properties resulting from the interactions between multiple individuals 2 .”
BackgroundSelf-citationNon-Invasive Brain-to-Brain Interface (BBI): Establishing Functional Links between Two Brains
Yoo, S.-S., Kim, H., Filandrianos, E., Taghados, S. J., & Park, S. (2013) · PLoS ONE · doi:10.1371/journal.pone.0060410 · Cited by 127
Methods for Neural Ensemble Recordings
(2007) · CRC Press eBooks · doi:10.1201/9781420006414 · Cited by 124
Self-citationNicolelis, M. A. L. (2011) · Medical Entomology and Zoology · Cited by 96
Self-citationDonor/recipient enhancement of memory in rat hippocampus
Deadwyler, S. A., Berger, T. W., Sweatt, A. J., Song, D., Chan, R. H. M., Opris, I., Gerhardt, G. A., Marmarelis, V. Z., & Hampson, R. E. (2013) · Frontiers in Systems Neuroscience · doi:10.3389/fnsys.2013.00120 · Cited by 64
Computing Arm Movements with a Monkey Brainet
Ramakrishnan, A., Ifft, P. J., Pais-Vieira, M., Byun, Y. W., Zhuang, K. Z., Lebedev, M. A., & Nicolelis, M. A. L. (2015) · Scientific Reports · doi:10.1038/srep10767 · Cited by 54 · cited 17×
“According to this analysis, Brainets formed by larger cortical neuronal ensembles performed better than those containing just a few neurons 9 .”
BackgroundMethodInfluentialSelf-citationPais-Vieira, M., Lebedev, M. A., Wiest, M. C., & Nicolelis, M. A. L. (2013) · The Journal of Neuroscience · doi:10.1523/jneurosci.1659-12.2013 · Cited by 49 · cited 1×
“Spikes from individual channels were summed to generate a population vector representing the overall activity which generally constitutes a good indicator of whisking and/or licking activity 14 .”
MethodSelf-citationNetworks of Echoes: Imitation, Innovation and Invisible Leaders
West, B. J., Turalska, M., & Paolo Grigolini, A. (2014) · Springer eBooks · doi:10.1007/978-3-319-04879-6 · Cited by 14 · cited 1×
“Discussion In this study we described different Brainet architectures capable of extracting information from multiple (3-4) rat brains.”
MethodMultielectrode Recordings in the Somatosensory System -- Methods for Neural Ensemble Recordings
Mal, N. (2008) · Cited by 5
Cited by
Brain-Machine Interfaces: From Basic Science to Neuroprostheses and Neurorehabilitation
Lebedev, M. A., & Nicolelis, M. A. L. (2017) · Physiological Reviews · doi:10.1152/physrev.00027.2016 · Cited by 653
“In the same context, the concept of Brainets takes multitasking BMI designs to the next level by combining multiple brains into a higher order computational entity (614, 616, 657).”
BackgroundMethodInfluentialSelf-citationKrucoff, M. O., Rahimpour, S., Slutzky, M. W., Edgerton, V. R., & Turner, D. A. (2016) · Frontiers in Neuroscience · doi:10.3389/fnins.2016.00584 · Cited by 187
“Other investigators have connected the brains of several animals into a single system, or “brainet,” where the animals try to achieve a single objective using brain control only (Pais-Vieira et al., 2015; Ramakrishnan et al., 2015).”
BackgroundNeurotechnologies for Human Cognitive Augmentation: Current State of the Art and Future Prospects
Cinel, C., Valeriani, D., & Poli, R. (2019) · Frontiers in Human Neuroscience · doi:10.3389/fnhum.2019.00013 · Cited by 178
“Recently, intracortical micro-electrode arrays have started to be used to convey information gathered from one rat’s brain to another (more on this in section 3.1.4, e.g., Deadwyler et al., 2013; Pais-Vieira et al., 2013) and to improve memory (Hampson et al., 2018) (see also section 3.3).”
InfluentialExplainable Artificial Intelligence for Neuroscience: Behavioral Neurostimulation
Fellous, J.-M., Sapiro, G., Rossi, A., Mayberg, H., & Ferrante, M. (2019) · Frontiers in Neuroscience · doi:10.3389/fnins.2019.01346 · Cited by 155
BrainNet: A Multi-Person Brain-to-Brain Interface for Direct Collaboration Between Brains
Jiang, L., Stocco, A., Losey, D. M., Abernethy, J. A., Prat, C. S., & Rao, R. P. N. (2019) · Scientific Reports · doi:10.1038/s41598-019-41895-7 · Cited by 190
Metadata
- Authors
- Pais-Vieira, M., Chiuffa, G., Lebedev, M., Yadav, A., & Nicolelis, M. A. L.
- Affiliations
- Duke University (US)
- Corresponding author
- Nicolelis, Miguel A. L.
- Venue
- Scientific Reports
- Published
- 2015-07-09
- Volume
- 5
- Issue
- 1
- Pages
- 11869-11869
- ISSN
- 2045-2322 (ISSN-L)
- PMC
- PMC4497302
- OpenAlex
- W2255302334
- Cited by
- 99
- References
- 18
- Citations by year
- 2026: 3 · 2025: 2 · 2024: 6 · 2023: 7 · 2022: 6 · 2021: 24 · 2020: 12 · 2019: 13 · 2018: 7 · 2017: 6 · 2016: 12 · 2015: 1
- FWCI
- 4.04
- Type
- journal article
- Language
- en
- Update notices
- correction (2015-10-15)
- Open access
- gold
- doi.org
- Licence
- cc-by
- creativecommons.org/licenses/by/4.0 (tdm)
- creativecommons.org/licenses/by/4.0 (vor)
- Locations
- Scientific Reports (publishedVersion, cc-by)
- PubMed Central (publishedVersion, cc-by)
- PubMed (publishedVersion)
- Funders
- National Institutes of Health
- National Institute of Mental Health (DP1MH099903)
- National Institute of Neurological Disorders and Stroke (R01NS073125)
- National Institute of Dental and Craniofacial Research (R01DE011451)
- National Center for Chronic Disease Prevention and Health Promotion (DP1MH099903)
- Eunice Kennedy Shriver National Institute of Child Health and Human Development (RC1HD063390)
- Topics
- Life Sciences › Neuroscience › Cellular and Molecular Neuroscience › Neuroscience and Neural Engineering
- Life Sciences › Neuroscience › Cognitive Neuroscience › Neural dynamics and brain function
- Life Sciences › Neuroscience › Cognitive Neuroscience › EEG and Brain-Computer Interfaces
- Keywords
- organic computing, brain-to-brain interfaces, rat brain, microelectrode arrays, intracortical microstimulation, cortical neuronal activity, somatosensory cortex, image processing, weather forecasting, animal social behavior, distributed neural networks
- MeSH terms
- Animals, Behavior, Animal, Brain, Electric Stimulation, Electrodes, Implanted, Neurons, Rats, Long-Evans, Rats
About these checks
Registry, retraction, Cites and statistics results are computed, not judged, with one exception: a printed reference that no index lists is read once by a model before it counts as a citation error. Claims are extracted by a model and kept only when their quote appears verbatim in the text; each cited source is then checked, with a model’s help, for whether it says what the claim relies on. Those verdicts can be wrong — read the claim’s quote and the cited source before relying on one.
Statistics and arithmetic are recomputed, not judged.
Confidence bands are shown only for fields calibrated on our annotated test set. None is calibrated yet, so no band is shown.
What counts as a claim ›How we measure confidence ›How we check this ›
Are you an author, or do you see a problem with this page? Request a review
Data sources
Bibliographic data: Semantic Scholar, OpenAlex, Crossref.
Contains information from the Semantic Scholar Academic Graph Datasets, made available under the ODC Attribution License (ODC-BY 1.0).
Semantic Scholar’s data is described in: Kinney, R., et al. (2023). The Semantic Scholar Open Data Platform. arXiv:2301.10140.
