

The DOI matches its Crossref record; 1 of the 1 references it cites were found in a registry or an index.
Mast Cells Participate in Corneal Development in Mice
Abstract
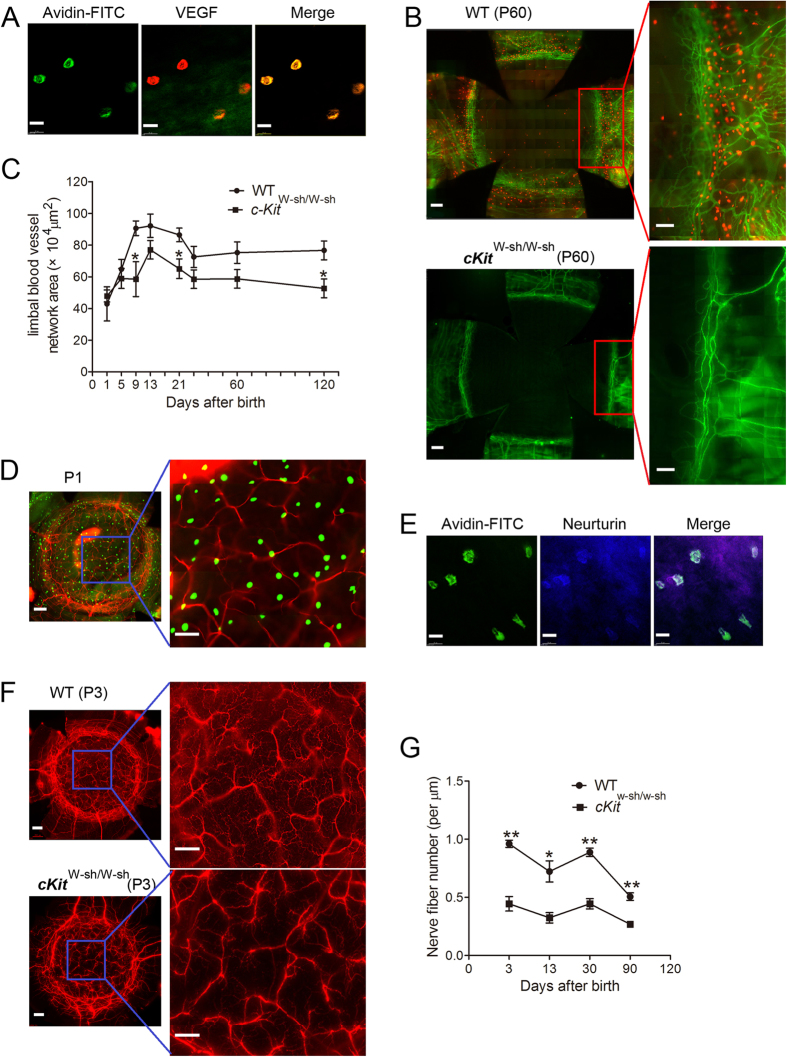
The development of the cornea, a highly specialized transparent tissue located at the anterior of the eye, is coordinated by a variety of molecules and cells. Here, we report that mast cells (MCs), recently found to be involved in morphogenesis, played a potentially important role in corneal development in mice. We show that two different waves of MC migration occurred during corneal development. In the first wave, MCs migrated to the corneal stroma and became distributed throughout the cornea. This wave occurred by embryonic day 12.5, with MCs disappearing from the cornea at the time of eyelid opening. In the second wave, MCs migrated to the corneal limbus and became distributed around limbal blood vessels. The number of MCs in this region gradually increased after birth and peaked at the time of eyelid opening in mice, remaining stable after postnatal day 21. We also show that integrin α4β7 and CXCR2 were important for the migration of MC precursors to the corneal limbus and that c-Kit-dependent MCs appeared to be involved in the formation of limbal blood vessels and corneal nerve fibers. These data clearly revealed that MCs participate in the development of the murine cornea.
Overview
The claims and statistics of this paper haven’t been checked yet.
Run the check — free, no account needed. It reads the open-access text and checks the sources it cites.
Integrity signals
Registry
Cites
Statistics
Figures
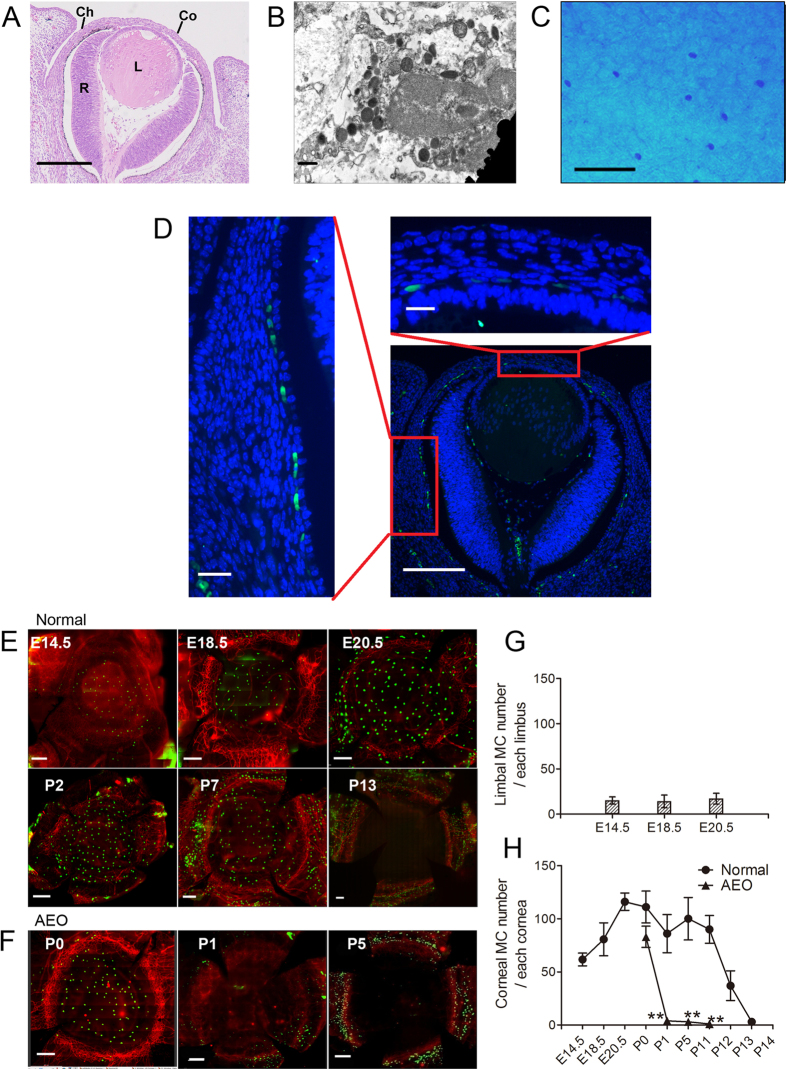
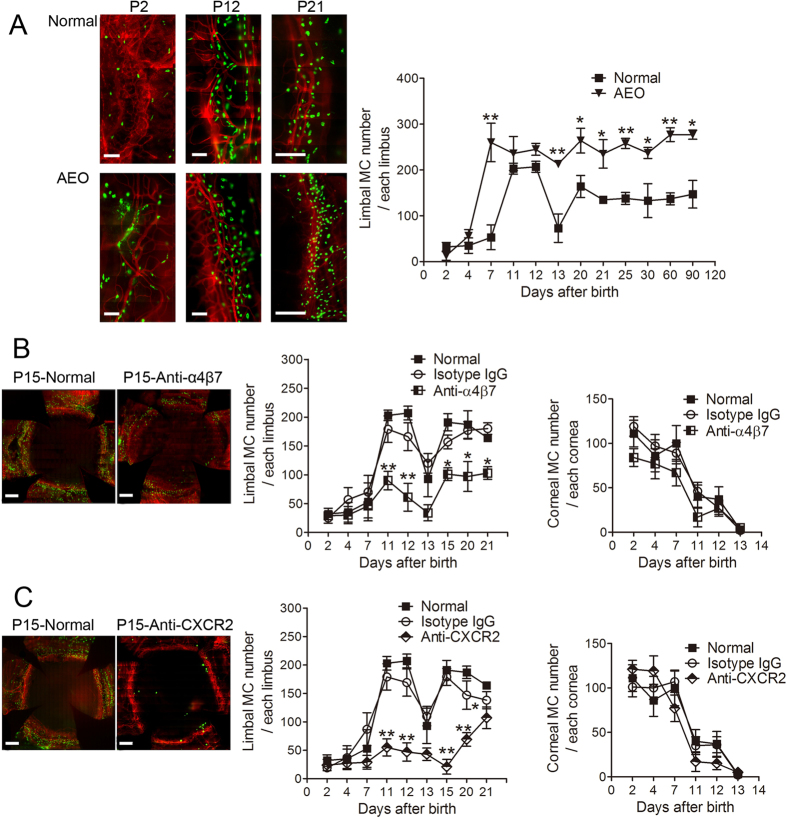
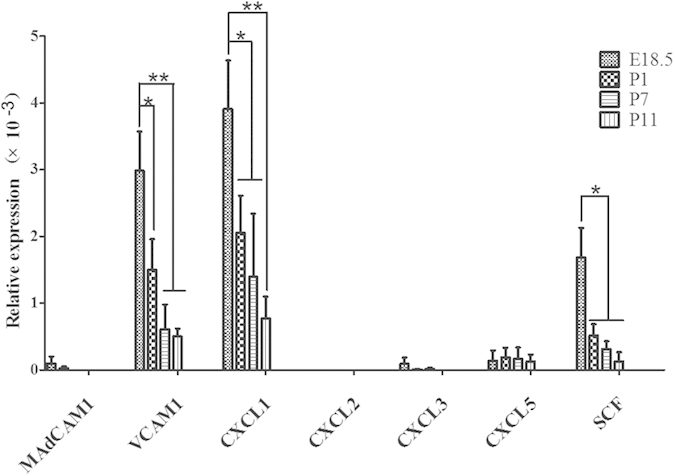
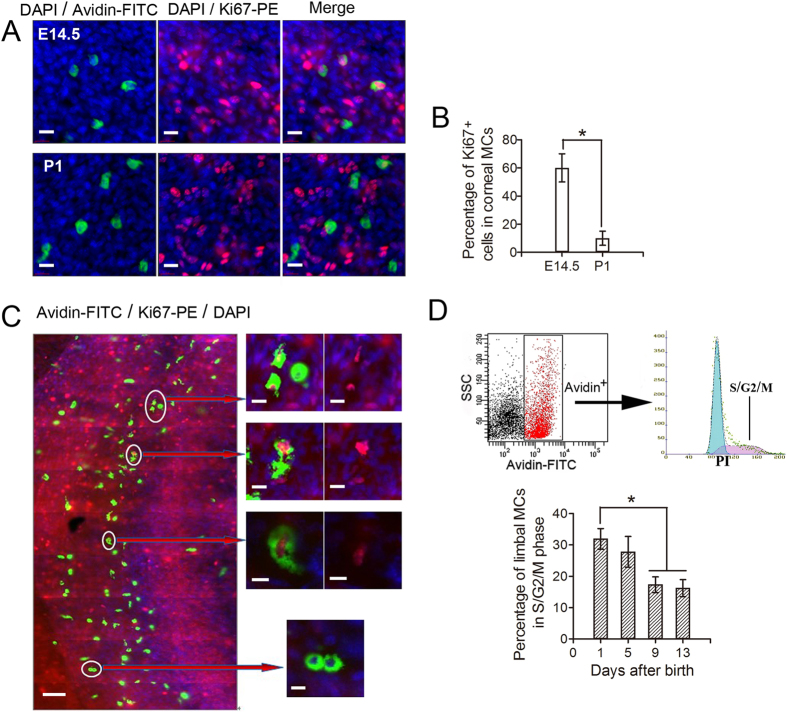
Verification
Claims the paper makes
The claims and statistics of this paper haven’t been checked yet.
Run the check — free, no account needed. It reads the open-access text and checks the sources it cites.
Claims other papers make about this one
Each is checked against this paper’s own text: does it say what the citing paper says it does?
In the citing paper
“In mice, granule‐containing, terminally differentiated mast cells can first be detected in the developing cornea at E12.5. 55”
From Mast cell ontogeny: From fetal development to life‐long health and disease (2023) · cites this paper as [55]
In the citing paper
“Mast cells colonize the developing cornea in two waves. The first mast cells concentrate around the corneal stroma from E12.5 onwards and disappear by the time of eyelid opening. A second wave of mast cells settles in the corneal limbus within the first postnatal week and stabilizes thereafter. These are recruited to the corneal limbus via a mechanism that depends on integrin α4β7 and Cxcr2. 55”
From Mast cell ontogeny: From fetal development to life‐long health and disease (2023) · cites this paper as [55]
In the citing paper
“Indeed, mast cells appear to be functionally mature at fetal stages: In mice, mast cells detected as early as E12.5 in the cornea and E14.5 in the skin already contain characteristic granules. 53 , 55”
From Mast cell ontogeny: From fetal development to life‐long health and disease (2023) · cites this paper as [55]
In the citing paper
“Of note, the area covered by blood vessels and the density of nerve fibers are both significantly reduced in newborn KitWsh/Wsh mice that do not have corneal mast cells. 55 This indicates that fetal mast cells mediate vascular and nerve branching in the developing cornea.”
From Mast cell ontogeny: From fetal development to life‐long health and disease (2023) · cites this paper as [55]
In the citing paper
“In rodents, they have been implicated in vasculature and nerve branching of the developing cornea. 55”
From Mast cell ontogeny: From fetal development to life‐long health and disease (2023) · cites this paper as [55]
Self-check
Percentages, sums and reported differences re-computed from the paper’s own numbers.
The self-check needs the paper’s full text.
Citations
Cites
Exposure to Environmental Microorganisms and Childhood Asthma
Ege, M. J., Mayer, M., Normand, A.-C., Genuneit, J., Cookson, W. O. C. M., Braun-Fahrländer, C., Heederik, D., Piarroux, R., & von Mutius, E. (2011) · New England Journal of Medicine · doi:10.1056/nejmoa1007302 · Cited by 1,529
Research works printed but not linked: 60
- Graw, J. The genetic and molecular basis of congenital eye defects. Nat Rev Genet 4, 876–888, doi: 10.1038/nrg1202 (2003). · DOI
- Cvekl, A. & Tamm, E. R. Anterior eye development and ocular mesenchyme: new insights from mouse models and human diseases. Bioessays 26, 374–386, doi: 10.1002/bies.20009 (2004). · DOI
- Kao W. W., Liu H. & Zhang J. Wakayama symposium: challenges of future research in ocular surface cell biology. Ocul Surf 11, 19–24, doi: 10.1016/j.jtos.2012.07.002 (2013). · DOI
- Stefater, J. A., Ren, S., Lang, R. A. & Duffield, J. S. Metchnikoff’s Policemen—Macrophages in Development, Homeostasis and Regeneration. Trends Mol Med 17, 743–752, doi: 10.1016/j.molmed.2011.07.009 (2011). · DOI
- Stefater, J. A., 3rd et al. Regulation of angiogenesis by a non-canonical Wnt-Flt1 pathway in myeloid cells. Nature 474, 511–515, doi: 10.1038/nature10085 (2011). · DOI
- Kitamura, Y. & Go, S. Decreased production of mast cells in S1/S1d anemic mice. Blood 53, 492–497 (1979). · DOI
- Kitamura, Y., Shimada, M., Hatanaka, K. & Miyano, Y. Development of mast cells from grafted bone marrow cells in irradiated mice. Nature 268, 442–443 (1977). · DOI
- Kitamura, Y., Go, S. & Hatanaka, K. Decrease of mast cells in W/Wv mice and their increase by bone marrow transplantation. Blood 52, 447–452 (1978). · DOI · Paper page
- Gurish, M. F. & Austen, K. F. Developmental origin and functional specialization of mast cell subsets. Immunity 37, 25–33, doi: 10.1016/j.immuni.2012.07.003 (2012). · DOI
- Sonoda, T., Hayashi, C. & Kitamura, Y. Presence of mast cell precursors in the yolk sac of mice. Dev Biol 97, 89–94, doi: 10.1016/0012-1606(83)90066-0 (1983). · DOI · Paper page
- Hayashi, C., Sonoda, T., Nakano, T., Nakayama, H. & Kitamura, Y. Mast-cell precursors in the skin of mouse embryos and their deficiency in embryos of Sl/Sld genotype. Dev Biol 109, 234–241, doi: 10.1016/0012-1606(85)90363-X (1985). · DOI
- Moon, T. et al. Advances in mast cell biology: new understanding of heterogeneity and function. Mucosal Immunol 3, 111–128, doi: 10.1038/mi.2009.136 (2009). · DOI
- Lilla, J. N. & Werb, Z. Mast cells contribute to the stromal microenvironment in mammary gland branching morphogenesis. Dev Biol 337, 124–133, doi: 10.1016/j.ydbio.2009.10.021 (2010). · DOI · Paper page
- Tharp, M. D., Seelig, L., Tigelaar, R. E. & Bergstresser, P. R. Conjugated avidin binds to mast cell granules. J Histochem Cytochem 33, 27–32 (1985). · DOI
- McNeil B. D. et al. Identification of a mast-cell-specific receptor crucial for pseudo-allergic drug reactions. Nature 519, 237–241, doi: 10.1038/nature14022 (2015). · DOI · Paper page
- Kunder C. A. et al. Mast cell-derived particles deliver peripheral signals to remote lymph nodes. J Exp Med 206, 2455–2467, doi: 10.1084/jem.20090805 (2009). · DOI
- Nilsson, G. et al. Interleukin-4 inhibits the expression of Kit and tryptase during stem cell factor-dependent development of human mast cells from fetal liver cells. Blood 84, 1519–1527 (1994). · DOI
- Zhuang, X., Silverman, A. J. & Silver, R. Distribution and local differentiation of mast cells in the parenchyma of the forebrain. J Comp Neurol 408, 477–488 (1999). · DOI
- Crapper, R. M. & Schrader, J. W. Frequency of mast cell precursors in normal tissues determined by an in vitro assay: antigen induces parallel increases in the frequency of P cell precursors and mast cells. J Immunol 131, 923–928 (1983). · DOI
- Gurish, M. F. et al. Intestinal mast cell progenitors require CD49dbeta7 (alpha4beta7 integrin) for tissue-specific homing. J Exp Med 194, 1243–1252, doi: 10.1084/jem.194.9.1243 (2001). · DOI · Paper page
- Abonia, J. P. et al. Alpha-4 integrins and VCAM-1, but not MAdCAM-1, are essential for recruitment of mast cell progenitors to the inflamed lung. Blood 108, 1588–1594, doi: 10.1182/blood-2005-12-012781 (2006). · DOI
- Hallgren, J. et al. Pulmonary CXCR2 regulates VCAM-1 and antigen-induced recruitment of mast cell progenitors. Proc Natl Acad Sci USA 104, 20478–20483, doi: 10.1073/pnas.0709651104 (2007). · DOI
- Abonia, J. P. et al. Constitutive homing of mast cell progenitors to the intestine depends on autologous expression of the chemokine receptor CXCR2. Blood 105, 4308–4313, doi: 10.1182/blood-2004-09-3578 (2005). · DOI
- Hallgren, J. et al. Pulmonary CXCR2 regulates VCAM-1 and antigen-induced recruitment of mast cell progenitors. Proc Natl Acad Sci USA 104, 20478–20483, doi: 10.1073/pnas.0709651104 (2007). · DOI
- Gurish, M. F. et al. Intestinal mast cell progenitors require CD49dβ7 (α4β7 integrin) for tissue-specific homing. J Exp Med 194, 1243–1252, doi: 10.1084/jem.194.9.1243 (2001). · DOI · Paper page
- Bacon K. et al. Chemokine/chemokine receptor nomenclature. J Interferon Cytokine Res 22, 1067–1068, doi: 10.1089/107999002760624305 (2002). · DOI
- Tsai, M. et al. Induction of mast cell proliferation, maturation and heparin synthesis by the rat c-kit ligand, stem cell factor. Proc Natl Acad Sci USA 88, 6382–6386 (1991). · DOI
- Chorro, L. et al. Langerhans cell (LC) proliferation mediates neonatal development, homeostasis and inflammation-associated expansion of the epidermal LC network. J Exp Med 206, 3089–3100, doi: 10.1084/jem.20091586 (2009). · DOI
- Ajami, B., Bennett, J. L., Krieger, C., Tetzlaff, W. & Rossi, F. M. Local self-renewal can sustain CNS microglia maintenance and function throughout adult life. Nat Neurosci 10, 1538–1543, doi: 10.1038/nn2014 (2007). · DOI · Paper page
- Blennerhassett, M. G. Nerve and mast cell interaction: cell conflict or information exchange? Prog Clin Biol Res 390, 225–241 (1994).
- Purcell, W. M. & Atterwill, C. K. Mast cells in neuroimmune function: neurotoxicological and neuropharmacological perspectives. Neurochem Res 20, 521–532, doi: 10.1007/BF01694534 (1995). · DOI
- Dines, K. C. & Powell, H. C. Mast cell interactions with the nervous system: relationship to mechanisms of disease. J Neuropathol Exp Neurol 56, 627–640 (1997). · DOI · Paper page
- Lang, R. A. & Bishop, J. M. Macrophages are required for cell death and tissue remodeling in the developing mouse eye. Cell 74, 453–462, doi: 10.1016/0092-8674(93)80047-I (1993). · DOI
- Ovchinnikov, D. A. Macrophages in the embryo and beyond: much more than just giant phagocytes. Genesis 46, 447–462, doi: 10.1002/dvg.20417 (2008). · DOI
- Henson, P. M. & Hume, D. A. Apoptotic cell removal in development and tissue homeostasis. Trends Immunol 27, 244–250, doi: 10.1016/j.it.2006.03.005 (2006). · DOI
- Metz, M. et al. Mast cells in the promotion and limitation of chronic inflammation. Immunol Rev 217, 304–328, doi: 10.1111/j.1600-065X.2007.00520.x (2007). · DOI
- Hershko, A. Y. et al. Mast cell interleukin-2 production contributes to suppression of chronic allergic dermatitis. Immunity 35, 562–571, doi: 10.1016/j.immuni.2011.07.013 (2011). · DOI
- Nakamura, Y. et al. Mast cells mediate neutrophil recruitment and vascular leakage through the NLRP3 inflammasome in histamine-independent urticaria. J Exp Med 206, 1037–1046, doi: 10.1084/jem.20082179 (2009). · DOI
- Jagannathan-Bogdan, M. & Zon, L. I. Hematopoiesis. Development 140, 2463–2467, doi: 10.1242/dev.083147 (2013). · DOI
- Zieske, J. D. Corneal development associated with eyelid opening. Int J Dev Biol 48, 903–911 (2004). · DOI
- Olszak, T. et al. Microbial exposure during early life has persistent effects on natural killer T cell function. Science 336, 489–493, doi: 10.1126/science.1219328 (2012). · DOI · Paper page
- Hallgren, J. & Gurish, M. F. Pathways of murine mast cell development and trafficking: tracking the roots and routes of the mast cell. Immunol Rev 217, 8–18, doi: 10.1111/j.1600-065X.2007.00502.x (2007). · DOI
- Reutershan, J. et al. Critical role of endothelial CXCR2 in LPS-induced neutrophil migration into the lung. J Clin Invest 116, 695–702, doi: 10.1172/JCI27009 (2006). · DOI
- Alcaide, P. et al. Dendritic cell expression of the transcription factor T-bet regulates mast cell progenitor homing to mucosal tissue. J Exp Med 204, 431–439, doi: 10.1084/jem.20060626 (2007). · DOI
- Rodewald, H. R. & Feyerabend, T. B. Widespread immunological functions of mast cells: fact or fiction? Immunity 37, 13–24, doi: 10.1016/j.immuni.2012.07.007 (2012). · DOI · Paper page
- Metcalfe, D. D., Baram, D. & Mekori, Y. A. Mast cells. Physiol Rev 77, 1033–1079 (1997). · DOI
- Qu, Z. et al. Mast cells are a major source of basic fibroblast growth factor in chronic inflammation and cutaneous hemangioma. Am J Pathol 147, 564–573 (1995).
- Reed, J. A., Albino, A. P. & McNutt, N. S. Human cutaneous mast cells express basic fibroblast growth factor. Lab Invest 72, 215–222 (1995).
- Boesiger, J. et al. Mast cells can secrete vascular permeability factor/vascular endothelial cell growth factor and exhibit enhanced release after immunoglobulin E-dependent upregulation of fc epsilon receptor I expression. J Exp Med 188, 1135–1145, doi: 10.1084/jem.188.6.1135 (1998). · DOI
- Grutzkau, A. et al. Synthesis, storage and release of vascular endothelial growth factor/vascular permeability factor (VEGF/VPF) by human mast cells: implications for the biological significance of VEGF206. Mol Biol Cell 9, 875–884, doi: 10.1091/mbc.9.4.8 (1998). · DOI
- Jones, C. V. & Ricardo, S. D. Macrophages and CSF-1: implications for development and beyond. Organogenesis 9, 249–260, doi: 10.4161/org.25676 (2013). · DOI
- Watanabe, H., Tisdale, A. S. & Gipson, I. Eyelid opening induces expression of a glycocalyx glycoprotein of rat ocular surface epithelium. Invest Ophthalmol Vis Sci 34, 327–338 (1993).
- Markey, A., CHURCHILL, L. J. & MacDonald, D. Human cutaneous mast cells–a study of fixative and staining reactions in normal skin. Br J Dermatol 120, 625–631 (1989). · DOI
- Li, Z., Burns, A. R., Miller, S. B. & Smith, C. W. CCL20, γδ T cells and IL-22 in corneal epithelial healing. FASEB J 25, 2659–2668, doi: 10.1096/fj.11-184804 (2011). · DOI
- Li, Z., Burns, A. R., Han, L., Rumbaut, R. E. & Smith, C. W. IL-17 and VEGF are necessary for efficient corneal nerve regeneration. Am J Pathol 178, 1106–1116, doi: 10.1016/j.ajpath.2010.12.001 (2011). · DOI
- Li, Z., Burns, A. R., Rumbaut, R. E. & Smith, C. W. γδ T cells are necessary for platelet and neutrophil accumulation in limbal vessels and efficient epithelial repair after corneal abrasion. Am J Pathol 171, 838–845, doi: 10.2353/ajpath.2007.070008 (2007). · DOI
- Li, Z., Rumbaut, R. E., Burns, A. R. & Smith, C. W. Platelet response to corneal abrasion is necessary for acute inflammation and efficient re-epithelialization. Invest Ophthalmol Vis Sci 47, 4794–4802, doi: 10.1167/iovs.06-0381 (2006). · DOI
- Li, Z., Burns, A. R., Han, L., Rumbaut, R. E. & Smith, C. W. IL-17 and VEGF are necessary for efficient corneal nerve regeneration. Am J Pathol 178, 1106–1116, doi: 10.1016/j.ajpath.2010.12.001 (2011). · DOI
- Sun, Y. et al. TLR4 and TLR5 on corneal macrophages regulate Pseudomonas aeruginosa keratitis by signaling through MyD88-dependent and-independent pathways. J Immunol 185, 4272–4283, doi: 10.4049/jimmunol.1000874 (2010). · DOI
- Yin, J., Wang, H., Racey, P. & Zhang, S. Distribution and ultrastructure of Merkel cell of the fishing bat (Myotis ricketti). Sci China C Life Sci 52, 802–806, doi: 10.1007/s11427-009-0118-0 (2009). · DOI
Cited by
Sorted by citations
Mast cell ontogeny: From fetal development to life‐long health and disease
Chia, S. L., Kapoor, S., Carvalho, C., Bajénoff, M., & Gentek, R. (2023) · Immunological Reviews · doi:10.1111/imr.13191 · Cited by 60
Metadata
- Authors
- Liu, J., Fu, T., Song, F., Xue, Y., Xia, C., Liu, P., Wang, H., Zhong, J., Li, Q., Chen, J., Li, Y., Cai, D., & Li, Z.
- Venue
- Scientific Reports
- Published
- 2015-12-02
- Volume
- 5
- Issue
- 1
- ISSN
- 2045-2322
- PMC
- PMC4667177
- Cited by
- 39
- References
- 1
- Language
- en
About these checks
Registry, retraction, Cites and statistics results are computed, not judged, with one exception: a printed reference that no index lists is read once by a model before it counts as a citation error. Claims are extracted by a model and kept only when their quote appears verbatim in the text; each cited source is then checked, with a model’s help, for whether it says what the claim relies on. Those verdicts can be wrong — read the claim’s quote and the cited source before relying on one.
Statistics and arithmetic are recomputed, not judged.
Confidence bands are shown only for fields calibrated on our annotated test set. None is calibrated yet, so no band is shown.
What counts as a claim ›How we measure confidence ›How we check this ›
Are you an author, or do you see a problem with this page? Request a review
How to cite
Cite CoChat for the checks on this page, and the paper for its own findings.
- This page
- CoChat. (2026). Citation check: Mast Cells Participate in Corneal Development in Mice. https://app.cochat.ai/papers/10.1038/srep17569
- The paper
- Liu, J., Fu, T., Song, F., Xue, Y., Xia, C., Liu, P., Wang, H., Zhong, J., Li, Q., Chen, J., Li, Y., Cai, D., & Li, Z. (2015). Mast Cells Participate in Corneal Development in Mice. Scientific Reports. https://doi.org/10.1038/srep17569
