

Consciousness and cortical responsiveness: a within-state study during non-rapid eye movement sleep
Open accessThe DOI matches its Crossref record; 52 of the 52 references it cites were found in a registry or an index.
Abstract
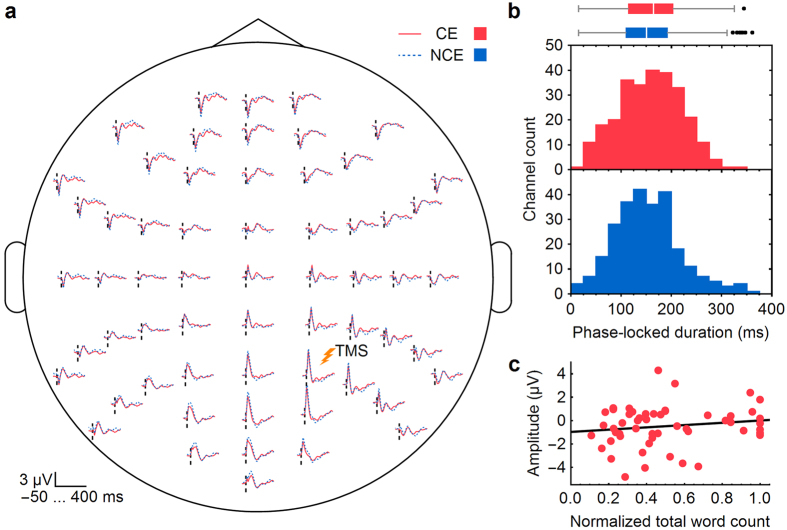
When subjects become unconscious, there is a characteristic change in the way the cerebral cortex responds to perturbations, as can be assessed using transcranial magnetic stimulation and electroencephalography (TMS–EEG). For instance, compared to wakefulness, during non-rapid eye movement (NREM) sleep TMS elicits a larger positive–negative wave, fewer phase-locked oscillations and an overall simpler response. However, many physiological variables also change when subjects go from wake to sleep, anesthesia, or coma. To avoid these confounding factors, we focused on NREM sleep only and measured TMS-evoked EEG responses before awakening the subjects and asking them if they had been conscious (dreaming) or not. As shown here, when subjects reported no conscious experience upon awakening, TMS evoked a larger negative deflection and a shorter phase-locked response compared to when they reported a dream. Moreover, the amplitude of the negative deflection—a hallmark of neuronal bistability according to intracranial studies—was inversely correlated with the length of the dream report (i.e., total word count). These findings suggest that variations in the level of consciousness within the same physiological state are associated with changes in the underlying bistability in cortical circuits.
Overview
The claims and statistics of this paper haven’t been checked yet.
Free: it reads the open-access text and checks the first 5 claims that cite a source we can check. Create a free account to check every claim.
Integrity signals
Registry
Cites
Statistics
Figures


Verification
Claims the paper makes
The claims and statistics of this paper haven’t been checked yet.
Free: it reads the open-access text and checks the first 5 claims that cite a source we can check. Create a free account to check every claim.
Claims other papers make about this one
Each is checked against this paper’s own text: does it say what the citing paper says it does?
The check wasn’t confident either way, so it gives no verdict — never disputed.
In the citing paper
“However, sleep strongly affected auditory-induced alpha–beta (10–30 Hz) desynchronization, which might reflect a lack of top-down attention, perhaps similar to what happens in neglect163.”
From Consciousness and sleep (2024) · cites this paper as [163]
Experimental — accuracy not yet measured
Self-check
Percentages, sums and reported differences re-computed from the paper’s own numbers.
The self-check needs the paper’s full text.
Citations
Cites
The Pittsburgh Sleep Quality Index: a new instrument for psychiatric practice and research
Buysse, D. J., Reynolds, C. F., Monk, T. H., Berman, S. R., & Kupfer, D. J. (1989) · Psychiatry Research · doi:10.1016/0165-1781(89)90047-4 · Cited by 35,234
Delorme, A., & Makeig, S. (2004) · Journal of Neuroscience Methods · doi:10.1016/j.jneumeth.2003.10.009 · Cited by 24,371
Cook, R. J., Dickens, B. M., & Fathalla, M. F. (2003) · Reproductive Health and Human Rights · doi:10.1093/acprof:oso/9780199241323.003.0025 · Cited by 10,769
Nonparametric statistical testing of EEG- and MEG-data
Maris, E., & Oostenveld, R. (2007) · Journal of Neuroscience Methods · doi:10.1016/j.jneumeth.2007.03.024 · Cited by 8,496
(2007) · Cited by 6,530
Mapping the structural core of human cerebral cortex
Hagmann, P., Cammoun, L., Gigandet, X., Meuli, R., Honey, C. J., Wedeen, V. J., & Sporns, O. (2008) · PLoS Biology · doi:10.1371/journal.pbio.0060159 · Cited by 4,173
Wassermann, E. M. (1998) · Electroencephalography and Clinical Neurophysiology/Evoked Potentials Section · doi:10.1016/s0168-5597(97)00096-8 · Cited by 2,293
Neural correlates of consciousness: progress and problems
Koch, C., Massimini, M., Boly, M., & Tononi, G. (2016) · Nature Reviews Neuroscience · doi:10.1038/nrn.2016.22 · Cited by 1,600
Self-citationCellular and network mechanisms of rhythmic recurrent activity in neocortex
Sanchez-Vives, M. V., & McCormick, D. A. (2000) · Nature Neuroscience · doi:10.1038/79848 · Cited by 1,539
Cited by
State-dependent effects of neural stimulation on brain function and cognition
Bradley, C., Nydam, A. S., Dux, P. E., & Mattingley, J. B. (2022) · Nature Reviews Neuroscience · doi:10.1038/s41583-022-00598-1 · Cited by 238
TMS combined with EEG: Recommendations and open issues for data collection and analysis
Hernandez-Pavon, J. C., Veniero, D., Bergmann, T. O., Belardinelli, P., Bortoletto, M., Casarotto, S., Casula, E. P., Farzan, F., Fecchio, M., Julkunen, P., et al. (2023) · Brain Stimulation · doi:10.1016/j.brs.2023.02.009 · Cited by 238
“The sourceinformed reconstruction (SIR) allows for interpolation of the channels based on the cortical current estimates based on the noncontaminated channels [218,224].”
Vucic, S., Stanley Chen, K.-H., Kiernan, M. C., Hallett, M., Benninger, D. H., Di Lazzaro, V., Rossini, P. M., Benussi, A., Berardelli, A., Currà, A., et al. (2023) · Clinical Neurophysiology · doi:10.1016/j.clinph.2023.03.010 · Cited by 212
Self-citationLocal aspects of sleep and wakefulness
Siclari, F., & Tononi, G. (2017) · Current Opinion in Neurobiology · doi:10.1016/j.conb.2017.05.008 · Cited by 207
Self-citationThe cognitive neuroscience of lucid dreaming
Baird, B., Mota-Rolim, S. A., & Dresler, M. (2019) · Neuroscience & Biobehavioral Reviews · doi:10.1016/j.neubiorev.2019.03.008 · Cited by 192
Automatic and robust noise suppression in EEG and MEG: The SOUND algorithm
Mutanen, T. P., Metsomaa, J., Liljander, S., & Ilmoniemi, R. J. (2018) · NeuroImage · doi:10.1016/j.neuroimage.2017.10.021 · Cited by 162
“…the most common approach to tackle the sensorspecific noise is to identify and reject the noisy channels and to interpolate the data in the rejected channels using, e.g., the spherical-spline basis functions (Perrin et al., 1989) or source modeling (Mutanen et al., 2016; Nieminen et al., 2016).”
BackgroundDreaming in NREM Sleep: A High-Density EEG Study of Slow Waves and Spindles
Siclari, F., Bernardi, G., Cataldi, J., & Tononi, G. (2018) · The Journal of Neuroscience · doi:10.1523/jneurosci.0855-18.2018 · Cited by 143
“Our results are also consistent with those of a previous study (Nieminen et al., 2016) showing that within NREM sleep, TMS applied to posterior cortical regions evokes a larger negative deflection and a shorter phase-locked response when subjects reported unconsciousness compared with when they…”
ResultSelf-citationDoes Consciousness Disappear in Dreamless Sleep?
Windt, J., Nielsen, T., & Thompson, E. T. (2016) · Trends in Cognitive Sciences · doi:10.1016/j.tics.2016.09.006 · Cited by 179
Network Properties in Transitions of Consciousness during Propofol-induced Sedation
Lee, M., Sanders, R. D., Yeom, S.-K., Won, D.-O., Seo, K.-S., Kim, H. J., Tononi, G., & Lee, S.-W. (2017) · Scientific Reports · doi:10.1038/s41598-017-15082-5 · Cited by 127
Self-citationLee, M., Sanz, L. R. D., Barra, A., Wolff, A., Nieminen, J. O., Boly, M., Rosanova, M., Casarotto, S., Bodart, O., Annen, J., et al. (2022) · Nature Communications · doi:10.1038/s41467-022-28451-0 · Cited by 154
Self-citationImplicit Vocabulary Learning during Sleep Is Bound to Slow-Wave Peaks
Züst, M. A., Ruch, S., Wiest, R., & Henke, K. (2019) · Current Biology · doi:10.1016/j.cub.2018.12.038 · Cited by 98
“We speculate that the cortical silence during the troughs, which tend to follow the peaks, prevented stimulus awareness [50], because troughs prevent the build-up of global information broadcasting in the brain.”
Lee, M., Baird, B., Gosseries, O., Nieminen, J. O., Boly, M., Postle, B. R., Tononi, G., & Lee, S.-W. (2019) · Scientific Reports · doi:10.1038/s41598-019-41274-2 · Cited by 90
Self-citationTononi, G., Boly, M., & Cirelli, C. (2024) · Neuron · doi:10.1016/j.neuron.2024.04.011 · Cited by 70
Self-citationNielsen, T. (2017) · Neuroscience of Consciousness · doi:10.1093/nc/nix001 · Cited by 56
“Nieminen et al. (2016) combined serial awakenings with transcranial magnetic stimulation (TMS) to show that TMS during non-REM (NREM) sleep evokes smaller negative deflections when there is recall of dreaming than when there is no recall; in fact, deflection amplitude correlates negatively with…”
BackgroundInfluentialMutz, J., & Javadi, A.-H. (2017) · Neuroscience of Consciousness · doi:10.1093/nc/nix009 · Cited by 53
“Novel brain stimulation methods including transcranial alternating current stimulation (tACS) and transcranial magnetic stimulation can be used to make causal inferences on the relationship between brain activity and behaviour (e.g. Nieminen et al. 2016).”
MethodAre we really unconscious in “unconscious” states? Common assumptions revisited
Sevenius Nilsen, A., Juel, B. E., Thürer, B., Aamodt, A., & Storm, J. F. (2022) · Frontiers in Human Neuroscience · doi:10.3389/fnhum.2022.987051 · Cited by 49
“Frontiers in Human Neuroscience 03 frontiersin.org these conditions have often been termed “dreamless” and “unconscious” (e.g., Tononi and Massimini, 2008; MacDonald et al., 2015; Nieminen et al., 2016).”
BackgroundEvoked Alpha Power is Reduced in Disconnected Consciousness During Sleep and Anesthesia
Darracq, M., Funk, C. M., Polyakov, D., Riedner, B. A., Gosseries, O., Nieminen, J. O., Bonhomme, V. L., Brichant, J. F., Boly, M., Laureys, S., et al. (2018) · Scientific Reports · doi:10.1038/s41598-018-34957-9 · Cited by 50
Self-citationWong, W., Noreika, V., Móró, L., Revonsuo, A., Windt, J., Valli, K., & Tsuchiya, N. (2020) · Neuroscience of Consciousness · doi:10.1093/nc/niaa006 · Cited by 40
“2017), stronger phase coherence between brain areas (Nieminen et al. 2016; Bola et al. 2017; Lee et al. 2017; Mikulan et al. 2017) and more causally integrated brain areas (Barrett et al.”
BackgroundBehavioural and brain responses in cognitive trance: A TMS-EEG case study
Gosseries, O., Fecchio, M., Wolff, A., Sanz, L. R. D., Sombrun, C., Vanhaudenhuyse, A., & Laureys, S. (2020) · Clinical Neurophysiology · doi:10.1016/j.clinph.2019.11.011 · Cited by 31
Self-citationSource-based artifact-rejection techniques for TMS–EEG
Mutanen, T. P., Metsomaa, J., Makkonen, M., Varone, G., Marzetti, L., & Ilmoniemi, R. J. (2022) · Journal of Neuroscience Methods · doi:10.1016/j.jneumeth.2022.109693 · Cited by 37
The avalanche-like behaviour of large-scale haemodynamic activity from wakefulness to deep sleep
Bocaccio, H., Pallavicini, C., Castro, M. N., Sánchez, S. M., Pino, G. D., Laufs, H., Villarreal, M. F., & Tagliazucchi, E. (2019) · Journal of The Royal Society Interface · doi:10.1098/rsif.2019.0262 · Cited by 32
‘Consciousnessoids’: clues and insights from human cerebral organoids for the study of consciousness
Lavazza, A. (2021) · Neuroscience of Consciousness · doi:10.1093/nc/niab029 · Cited by 35
EEG Lempel-Ziv complexity varies with sleep stage, but does not seem to track dream experience
Aamodt, A., Sevenius Nilsen, A., Markhus, R., Kusztor, A., HasanzadehMoghadam, F., Kauppi, N., Thürer, B., Storm, J. F., & Juel, B. E. (2023) · Frontiers in Human Neuroscience · doi:10.3389/fnhum.2022.987714 · Cited by 30
“Other studies have reported differences in TMS-evoked response between dream and non-dream awakenings from NREM sleep, indicating altered connectivity in posterior cortical areas (Nieminen et al., 2016; Lee et al., 2019) (reliable calculation of the perturbational complexity index (PCI) was not possible due to insuffi…”
ResultEEG predictors of dreaming outside of REM sleep.
Zhang, J., & Wamsley, E. J. (2019) · Psychophysiology · doi:10.1111/psyp.13368 · Cited by 29
“One recent theory attributes loss of consciousness during such states to reduced information-integration capacity resulting from the “bistable” neuronal firing patterns occurring during low-frequency dominated EEG (Nieminen et al., 2016; Tononi, 2004).”
BackgroundInvestigation on Neurobiological Mechanisms of Dreaming in the New Decade
Scarpelli, S., Alfonsi, V., Gorgoni, M., Giannini, A. M., & Gennaro, L. D. (2021) · Brain Sciences · doi:10.3390/brainsci11020220 · Cited by 38
Sleep spindle and psychopathology characteristics of frequent nightmare recallers
Picard‐Deland, C., Carr, M., Paquette, T., Saint‐Onge, K., & Nielsen, T. (2017) · Sleep Medicine · doi:10.1016/j.sleep.2017.10.003 · Cited by 30
Bola, M., Barrett, A. B., Pigorini, A., Nobili, L., Seth, A. K., & Marchewka, A. (2018) · NeuroImage · doi:10.1016/j.neuroimage.2017.11.030 · Cited by 27
Sleep and Dreaming in the Predictive Processing Framework
Bucci, A., & Grasso, M. (2017) · Gutenberg Open Science · doi:10.15502/9783958573079 · Cited by 41
“2010) and some instances of NREM sleep (Nieminen et al. 2016) the level of integrated information in the brain is high enough for exhibiting conscious experience (dreams, reported upon awakening).”
BackgroundInfluentialDecreased Evoked Slow-Activity After tDCS in Disorders of Consciousness
Mensen, A., Bodart, O., Thibaut, A., Wannez, S., Annen, J., Laureys, S., & Gosseries, O. (2020) · Frontiers in Systems Neuroscience · doi:10.3389/fnsys.2020.00062 · Cited by 29
Self-citationArai, N., Nakanishi, T., Nakajima, S., Li, X., Wada, M., Daskalakis, Z. J., Goodman, M. S., Blumberger, D. M., Mimura, M., & Noda, Y. (2021) · Neuroscience & Biobehavioral Reviews · doi:10.1016/j.neubiorev.2021.09.029 · Cited by 26
EEG Signal Diversity Varies With Sleep Stage and Aspects of Dream Experience
Aamodt, A., Nilsen, A. S., Thürer, B., Moghadam, F. H., Kauppi, N., Juel, B. E., & Storm, J. F. (2021) · Frontiers in Psychology · doi:10.3389/fpsyg.2021.655884 · Cited by 23
Pereira, A., Foz, F. B., & da Rocha, A. F. (2017) · Psychology of Consciousness Theory Research and Practice · doi:10.1037/cns0000115 · Cited by 24
“Two examples are recent findings by Nieminen et al. (2016), showing that during non-REM sleep (a phase of sleep without conscious activity, i.e., mostly without dreams) there is a negative deflection of the EEG with a dominance of delta rhythms in the posterior associative cortex, while in REM…”
BackgroundManger, P. R., & Siegel, J. M. (2020) · Journal of Comparative Neurology · doi:10.1002/cne.24860 · Cited by 22
“…of slow waves during non-REM sleep may interfere with the generation of conscious experiences and thus dreams in humans (Massimini et al., 2005; Nieminen et al., 2016), and this has been shown to occur most consistently when these variations in slow waves occur in the parieto-occipital cortex…”
BackgroundGallucci, A., Varoli, E., Mauro, L. D., Hassan, G., Rovida, M., Comanducci, A., Casarotto, S., Re, V. L., & Lauro, L. J. R. (2023) · European Journal of Neuroscience · doi:10.1111/ejn.16149 · Cited by 24
Meditation-induced modulation of brain response to transcranial magnetic stimulation
Bodart, O., Fecchio, M., Massimini, M., Wannez, S., Virgillito, A., Casarotto, S., Rosanova, M., Antoine Lutz, A., Ricard, M., Laureys, S., et al. (2018) · Brain stimulation · doi:10.1016/j.brs.2018.08.018 · Cited by 18
Self-citationPanda, R., Vanhaudenhuyse, A., Piarulli, A., Annen, J., Demertzi, A., Alnagger, N., Chennu, S., Laureys, S., Faymonville, M.-É., & Gosseries, O. (2023) · Journal of Cognitive Neuroscience · doi:10.1162/jocn_a_02019 · Cited by 16
“Note however that previous studies on consciousness have comparable numbers of participants (Martial et al., 2019; Bharath, Panda, Saini, Sriganesh, & Rao, 2017; Nieminen et al., 2016).”
MethodResultSelf-citationInfluence of Large-Scale Brain State Dynamics on the Evoked Response to Brain Stimulation
Anaraki, A. K., Dhami, P., Gomez, M.-A. D., Blumberger, D. M., Daskalakis, Z. J., Moreno, S., & Farzan, F. (2024) · Journal of Neuroscience · doi:10.1523/jneurosci.0782-24.2024 · Cited by 18
Conscious experiences during non-rapid eye movement sleep parasomnias
Castelnovo, A., Siclari, F., Spaggiari, S., Borth, D., Manconi, M., Arnulf, I., & Schenck, C. H. (2024) · Neuroscience & Biobehavioral Reviews · doi:10.1016/j.neubiorev.2024.105919 · Cited by 18
“For example, Castelnovo et al. (Castelnovo et al., 2022) observed higher levels of connectivity using phase transfer entropy during DOA episodes compared to those during slow wave sleep, and more similar to those during wakefulness (Nieminen et al., 2016).”
ResultSelf-citationLocal Patterns of Sleep and Wakefulness
Bernardi, G., & Siclari, F. (2019) · Handbook of behavioral neuroscience · doi:10.1016/b978-0-12-813743-7.00003-7 · Cited by 16
Self-citationThe Relationship of Transcranial Magnetic Stimulation With Sleep and Plasticity
Centorino, M. B., Bajor, L., Gootam, P. K., Nakase‐Richardson, R., & Kozel, F. A. (2020) · Journal of Psychiatric Practice · doi:10.1097/pra.0000000000000506 · Cited by 12
DREAM: A Dream EEG and Mentation databasePreprint
Wong, W., Andrade, K. C., Andrillon, T., de Araújo, D. B., Arnulf, I., Avvenuti, G., Baird, B., Bellesi, M., Bergamo, D., Bernardi, G., et al. (2023) · doi:10.31234/osf.io/69e43 · Cited by 12
Self-citationHacking the functions of sleep: noninvasive approaches to stimulate sleep neurophysiology
Krugliakova, E., Breuer, F., Adelhöfer, N., Alonso, A., Besedovsky, L., Murphy, K. R., Peters, E., Raczek, K., Rasch, B., Salvesen, L., et al. (2025) · Physiological Reviews · doi:10.1152/physrev.00007.2025 · Cited by 23
Resting state dynamic functional connectivity: Network topology analysis
Knyazeva, I., Poyda, A. A., Orlov, V. A., Verkhlyutov, V. M., Makarenko, N., Kozlov, S., Velichkovsky, B. M., & Ushakov, V. (2017) · Biologically Inspired Cognitive Architectures · doi:10.1016/j.bica.2017.10.001 · Cited by 9
Bareham, C. A., Oxner, M., Gastrell, T., & Carmel, D. (2020) · Journal of the Royal Society of New Zealand · doi:10.1080/03036758.2020.1840405 · Cited by 9
Relationship Between Epilepsy and Dreaming: Current Knowledge, Hypotheses, and Perspectives
de la Chapelle, A., Frauscher, B., Valomon, A., Ruby, P. M., & Peter‐Derex, L. (2021) · Frontiers in Neuroscience · doi:10.3389/fnins.2021.717078 · Cited by 9
Stucky, B. (2025) · Nature and Science of Sleep · doi:10.2147/nss.s506461 · Cited by 7
Bajwa, I. J., Nilsen, A. S., Skukies, R., Aamodt, A., Ernst, G., Storm, J. F., & Juel, B. E. (2025) · Scientific Reports · doi:10.1038/s41598-025-12695-z · Cited by 6
“One such attempt at achieving more time-resolved measurements is by Nieminen et al. 17 who examined TMS-evoked responses immediately prior to awakening from sleep.”
Can you hear me now? Information processing in primary auditory cortex at loss of consciousness
Eagleman, S. L., & MacIver, M. B. (2018) · British Journal of Anaesthesia · doi:10.1016/j.bja.2018.06.008 · Cited by 5
Orchestration of dreams: a possible tool for enhancement of mental productivity and efficiency
Krishnan, D. (2021) · Sleep and Biological Rhythms · doi:10.1007/s41105-021-00313-0 · Cited by 6
Graph Theoretical Analysis of Cortical Networks based on Conscious Experience
Lee, M., Baird, B., Gosseries, O., Nieminen, J. O., Boly, M., Tononi, G., & Lee, S. (2019) · Annual International Conference of the IEEE Engineering in Medicine and Biology Society (EMBC) · doi:10.1109/embc.2019.8857648 · Cited by 4
Self-citationOn a Strategy of Advancement of TMS Based Methods for Studying NCC
Bachmann, T. (2018) · Frontiers in Psychology · doi:10.3389/fpsyg.2018.02026 · Cited by 3
“The powerfulness of TMS approaches is enhanced by combining TMS with EEG recording, allowing understand the nature of TMS effects and their relation to consciousness mechanisms better (e.g., Massimini et al., 2012; Sarasso et al., 2015; Vernet et al., 2015; Nieminen et al., 2016).”
MethodOne Experiment to Start Them All: The Missing Foundation of Consciousness SciencePreprint
Rosseinsky, N. M. (2019) · PsyArXiv (OSF Preprints) · doi:10.31234/osf.io/zgb9w · Cited by 3
Honjoh, S., Imamura, A., Akahira, S., Chérasse, Y., Ihara, A., Sakurai, T., & Miyatake, K. (2025) · Neuroscience Research · doi:10.1016/j.neures.2025.104969 · Cited by 6
Experimental approaches to study sensory disconnection in humans during sleep and anesthesia
Cecconi, B., Bonhomme, V. L., Laureys, S., Gosseries, O., Boly, M., & Annen, J. (2025) · Current Opinion in Behavioral Sciences · doi:10.1016/j.cobeha.2025.101505 · Cited by 3
Self-citationCausal Connectivity According to Conscious Experience in Non-Rapid Eye Movement Sleep
Lee, M., Baird, B., Gosseries, O., Nieminen, J. O., Boly, M., Tononi, G., & Lee, S. (2019) · Conference proceedings/Conference proceedings - IEEE International Conference on Systems, Man, and Cybernetics · doi:10.1109/smc.2019.8914541 · Cited by 1
“In other words, the characteristics of consciousness and unconsciousness in the same physiological state can be investigated, thus eliminating other effects such as changes in the respiratory and cardiovascular systems [15-17].”
BackgroundMethodInfluentialSelf-citationSiclari, F. (2022) · Elsevier eBooks · doi:10.1016/b978-0-12-822963-7.00119-5 · Cited by 1
Self-citationLocal Aspects of Sleep and Wakefulness
(2020) · Frontiers research topics · doi:10.3389/978-2-88963-565-8 · Cited by 1
Neurophysiological Markers of (Dis)Connectedness: Insights from Ketamine
Alnagger, N., Cardone, P., Montupil, J., Annen, J., Martial, C., Bonhomme, V. L., & Gosseries, O. (2025) · Neuromethods · doi:10.1007/978-1-0716-4603-8_8
Self-citationHuman brain zero: uncovering the lowest neural state for consciousness engineering
Donoso, M. (2026) · Frontiers in Neuroscience · doi:10.3389/fnins.2026.1819370
Insights into the sleeping mind: Neural correlates of dreaming
Camaioni, M., Gennaro, L. D., & Scarpelli, S. (2026) · Elsevier eBooks · doi:10.1016/b978-0-443-29258-3.00035-5
Metadata
- Authors
- Nieminen, J. O., Gosseries, O., Massimini, M., Saad, E., Sheldon, A. D., Boly, M., Siclari, F., Postle, B. R., & Tononi, G.
- Affiliations
- University of Wisconsin–Madison (US)
- University of Milan (IT)
- Corresponding author
- Tononi, Giulio
- ORCID
- Venue
- Scientific Reports
- Published
- 2016-08-05
- Volume
- 6
- Issue
- 1
- Pages
- 30932-30932
- ISSN
- 2045-2322 (ISSN-L)
- PMC
- PMC4974655
- OpenAlex
- W2482192283
- Cited by
- 61
- References
- 52
- Citations by year
- 2026: 2 · 2025: 6 · 2024: 3 · 2023: 6 · 2022: 5 · 2021: 6 · 2020: 7 · 2019: 10 · 2018: 5 · 2017: 10 · 2016: 1
- FWCI
- 5.50
- Type
- journal article
- Language
- en
- Open access
- gold
- doi.org
- Licence
- cc-by
- creativecommons.org/licenses/by/4.0 (tdm)
- creativecommons.org/licenses/by/4.0 (vor)
- Locations
- Scientific Reports (publishedVersion, cc-by)
- PubMed Central (publishedVersion, cc-by)
- PubMed (publishedVersion)
- IRIS (submittedVersion, cc-by)
- Aaltodoc (Aalto University) (submittedVersion, cc-by)
- Archivio Istituzionale della Ricerca (Universita Degli Studi Di Milano) (submittedVersion, other-oa)
- ORBi (University of Liège) (submittedVersion, other-oa)
- SERVAL (Université de Lausanne) (submittedVersion, other-oa)
- Funders
- National Science Foundation
- Schweizerischer Nationalfonds zur Förderung der Wissenschaftlichen Forschung (145763, 151743, 139778, 145571)
- Academy of Finland (265680)
- Fonds De La Recherche Scientifique - FNRS
- Wallonie-Bruxelles International
- National Institutes of Health (5p20mh077967-04, 5p01ns083514-05, 686764)
- National Institute of Mental Health (R01MH099231, R01MH064498, P20MH-077967, R01MH095984)
- National Institute of General Medical Sciences (T32GM007507, T32GM008692)
- National Institute of Neurological Disorders and Stroke (P01 NS-083514)
- Topics
- Life Sciences › Neuroscience › Cognitive Neuroscience › Sleep and Wakefulness Research
- Life Sciences › Neuroscience › Neurology › Transcranial Magnetic Stimulation Studies
- Life Sciences › Neuroscience › Cognitive Neuroscience › Neural dynamics and brain function
- Keywords
- consciousness, NREM sleep, transcranial magnetic stimulation, dream narrative, phase-locked oscillations, sleep-wake transition
- MeSH terms
- Cerebral Cortex, Consciousness, Dreams, Electroencephalography, Female, Humans, Male, Synaptic Transmission, Neuronal Plasticity, Sleep, Sleep, REM, Wakefulness, Transcranial Magnetic Stimulation
About these checks
Registry, retraction, Cites and statistics results are computed, not judged, with one exception: a printed reference that no index lists is read once by a model before it counts as a citation error. Claims are extracted by a model and kept only when their quote appears verbatim in the text; each cited source is then checked, with a model’s help, for whether it says what the claim relies on. Those verdicts can be wrong — read the claim’s quote and the cited source before relying on one.
Statistics and arithmetic are recomputed, not judged.
Confidence bands are shown only for fields calibrated on our annotated test set. None is calibrated yet, so no band is shown.
What counts as a claim ›How we measure confidence ›How we check this ›
Are you an author, or do you see a problem with this page? Request a review
Data sources
Bibliographic data: Semantic Scholar, OpenAlex, Crossref.
Contains information from the Semantic Scholar Academic Graph Datasets, made available under the ODC Attribution License (ODC-BY 1.0).
Semantic Scholar’s data is described in: Kinney, R., et al. (2023). The Semantic Scholar Open Data Platform. arXiv:2301.10140.
