

The DOI matches its Crossref record; 44 of the 46 references it cites were found in a registry or an index.
Trimethylamine N-oxide in atherogenesis: impairing endothelial self-repair capacity and enhancing monocyte adhesion
Open accessAbstract
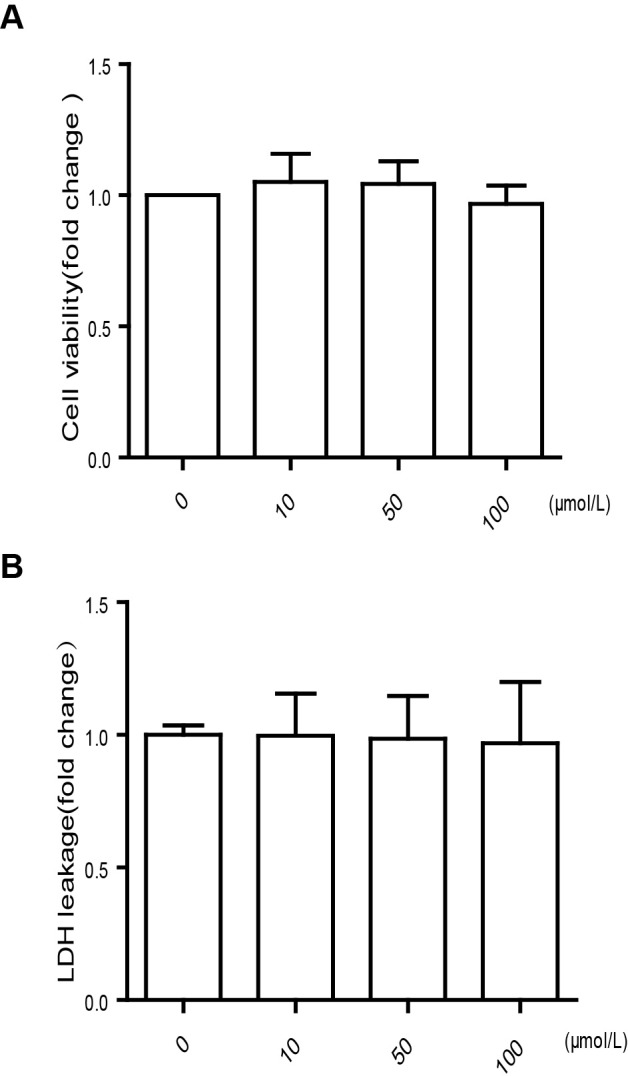
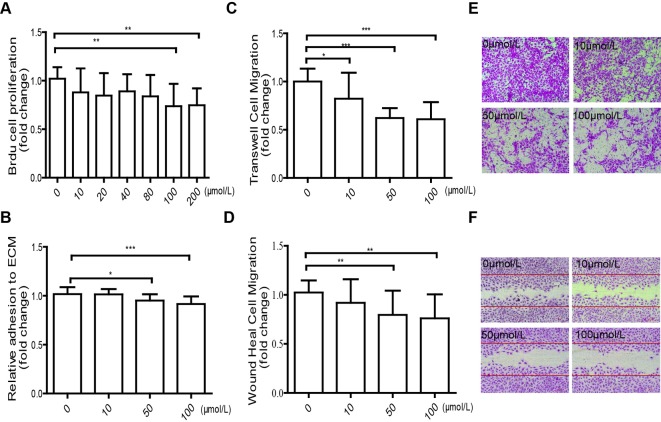
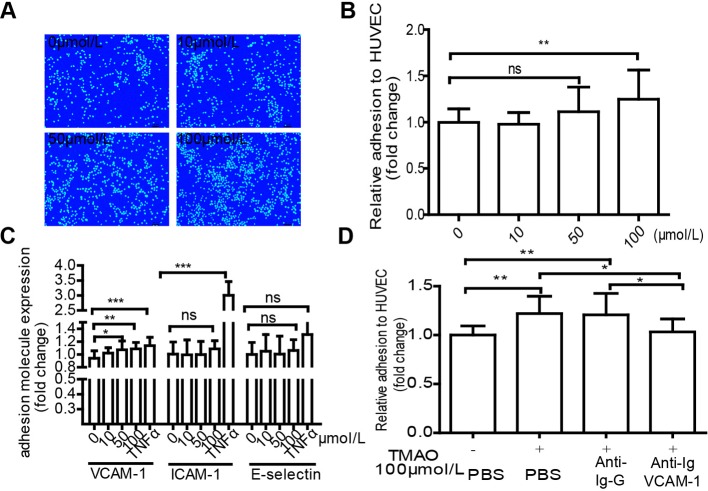
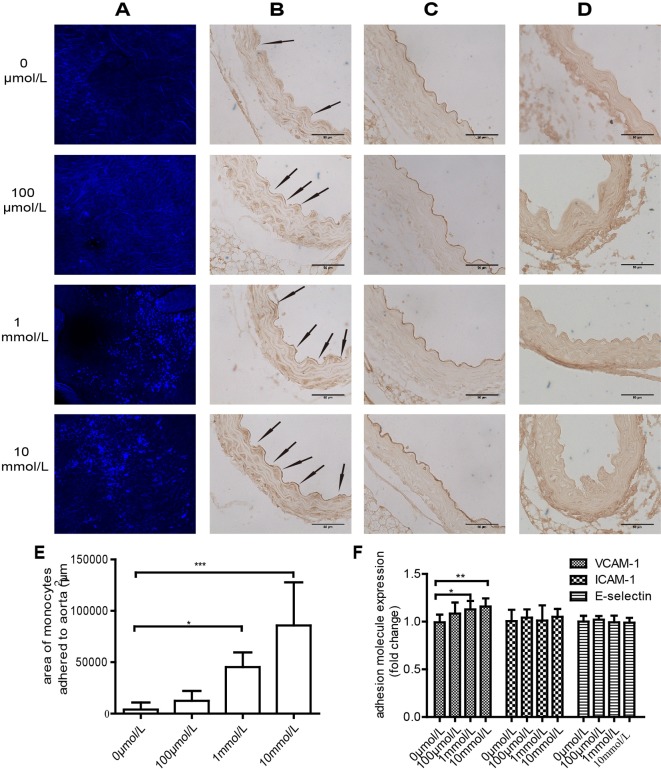
Several studies have reported a strong association between high plasma level of trimethylamine N-oxide (TMAO) and atherosclerosis development. However, the exact mechanism underlying this correlation is unknown. In the present study, we try to explore the impact of TMAO on endothelial dysfunction. After TMAO treatment, human umbilical vein endothelial cells (HUVECs) showed significant impairment in cellular proliferation and HUVECs-extracellular matrix (ECM) adhesion compared with control. Likewise, TMAO markedly suppressed HUVECs migration in transwell migration assay and wound healing assay. In addition, we found TMAO up-regulated vascular cell adhesion molecule-1 (VCAM-1) expression, promoted monocyte adherence, activated protein kinase C (PKC) and p-NF-κB. Interestingly, TMAO-stimulated VCAM-1 expression and monocyte adherence were diminished by PKC inhibitor. These results demonstrate that TMAO promotes early pathological process of atherosclerosis by accelerating endothelial dysfunction, including decreasing endothelial self-repair and increasing monocyte adhesion. Furthermore, TMAO-induced monocyte adhesion is partly attributable to activation of PKC/NF-κB/VCAM-1.
Overview
The claims and statistics of this paper haven’t been checked yet.
Run the check — free, no account needed. It reads the open-access text and checks the sources it cites.
Integrity signals
Registry
Cites
Statistics
Figures
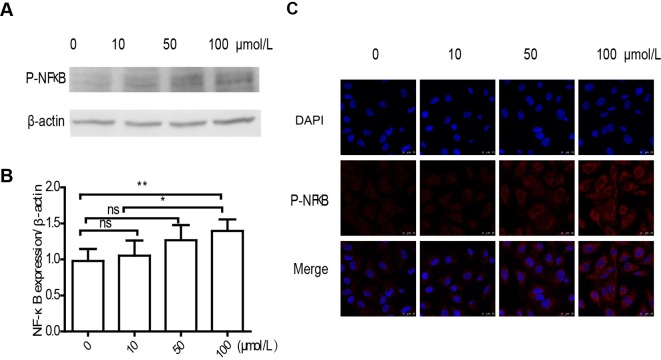
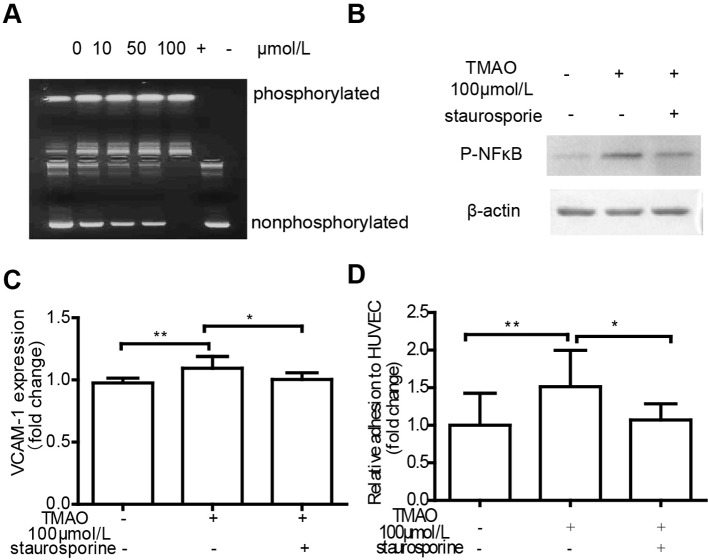
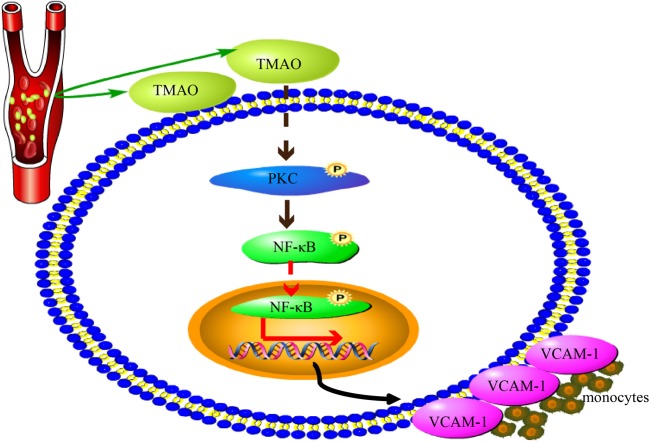
Verification
Claims the paper makes
The claims and statistics of this paper haven’t been checked yet.
Run the check — free, no account needed. It reads the open-access text and checks the sources it cites.
Claims other papers make about this one
Each is checked against this paper’s own text: does it say what the citing paper says it does?
In the citing paper
“some studies performed on human monocytic THP-1 cells and human umbilical vein endothelial cells (HUVEC) showed that TMAO treatment enhanced monocyte adhesion through the PKC/NF-κB pathway, thus increasing the expression of VCAM-1 [58].”
From Implication of Trimethylamine N-Oxide (TMAO) in Disease: Potential Biomarker or New Therapeutic Target (2018) · cites this paper as [58]
Self-check
Percentages, sums and reported differences re-computed from the paper’s own numbers.
The self-check needs the paper’s full text.
Citations
Cites
Jaffe, E. A., Nachman, R., Becker, C. G., & Minick, C. (1973) · Journal of Clinical Investigation · doi:10.1172/jci107470 · Cited by 7,146
Heart Disease and Stroke Statistics—2015 Update: A Report From the American Heart Association
Mozaffarian, D., Benjamin, E. J., Go, A. S., Arnett, D. K., Blaha, M. J., Cushman, M., de Ferranti, S., Després, J.-P., Fullerton, H. J., Howard, V. J., et al. (2015) · Circulation · doi:10.1161/cir.0000000000000152 · Cited by 5,797
Gut flora metabolism of phosphatidylcholine promotes cardiovascular disease
Wang, Z., Klipfell, E., Bennett, B. J., Koeth, R., Levison, B. S., DuGar, B., Feldstein, A. E., Britt, E. B., Fu, X., Chung, Y.-M., et al. (2011) · Nature · doi:10.1038/nature09922 · Cited by 5,597
HEART DISEASE AND STROKE STATISTICS–2014 UPDATE: A REPORT FROM THE AMERICAN HEART ASSOCIATION
Tarver, T. (2014) · Journal of Consumer Health on the Internet · doi:10.1080/15398285.2014.902284 · Cited by 5,595
Intestinal microbiota metabolism of l-carnitine, a nutrient in red meat, promotes atherosclerosis
Koeth, R. A., Wang, Z., Levison, B. S., Buffa, J. A., Org, E., Sheehy, B. T., Britt, E. B., Fu, X., Wu, Y., Li, L., et al. (2013) · Nature Medicine · doi:10.1038/nm.3145 · Cited by 4,386
Intestinal microbial metabolism of phosphatidylcholine and cardiovascular risk
Tang, W. H. W., Wang, Z., Levison, B. S., Koeth, R. A., Britt, E. B., Fu, X., Wu, Y., & Hazen, S. L. (2013) · New England Journal of Medicine · doi:10.1056/nejmoa1109400 · Cited by 3,400
Bonetti, P. O., Lerman, L. O., & Lerman, A. (2003) · Arteriosclerosis Thrombosis and Vascular Biology · doi:10.1161/01.atv.0000051384.43104.fc · Cited by 2,234
Tang, W. H. W., Wang, Z., Kennedy, D. J., Wu, Y., Buffa, J. A., Agatisa-Boyle, B., Li, X. S., Levison, B. S., & Hazen, S. L. (2015) · Circulation Research · doi:10.1161/circresaha.116.305360 · Cited by 1,223
Activation of Protein Kinase C Isoforms and Its Impact on Diabetic Complications
Geraldes, P., & King, G. L. (2010) · Circulation Research · doi:10.1161/circresaha.110.217117 · Cited by 1,019
Seldin, M. M., Meng, Y., Qi, H., Zhu, W., Wang, Z., Hazen, S. L., Lusis, A. J., & Shih, D. M. (2016) · Journal of the American Heart Association · doi:10.1161/jaha.115.002767 · Cited by 911
Vascular Adhesion Molecules in Atherosclerosis
Galkina, E., & Ley, K. F. (2007) · Arteriosclerosis Thrombosis and Vascular Biology · doi:10.1161/atvbaha.107.149179 · Cited by 831
Tang, W. H. W., Wang, Z., Fan, Y., Levison, B., Hazen, J. E., Donahue, L. M., Wu, Y., & Hazen, S. L. (2014) · Journal of the American College of Cardiology · doi:10.1016/j.jacc.2014.02.617 · Cited by 681
The contributory role of gut microbiota in cardiovascular disease
Tang, W. H. W., & Hazen, S. L. (2014) · Journal of Clinical Investigation · doi:10.1172/jci72331 · Cited by 641
Wang, Z., Tang, W. H. W., Buffa, J. A., Fu, X., Britt, E. B., Koeth, R. A., Levison, B. S., Fan, Y., Wu, Y., & Hazen, S. L. (2014) · European Heart Journal · doi:10.1093/eurheartj/ehu002 · Cited by 559
Dietary trimethylamine N-oxide exacerbates impaired glucose tolerance in mice fed a high fat diet
Gao, X., Liu, X., Xu, J., Xue, C., Xue, Y., & Wang, Y. (2014) · Journal of Bioscience and Bioengineering · doi:10.1016/j.jbiosc.2014.03.001 · Cited by 360
Endothelial Dysfunction: Clinical Implications in Cardiovascular Disease and Therapeutic Approaches
Park, K., & Park, W. J. (2015) · Journal of Korean Medical Science · doi:10.3346/jkms.2015.30.9.1213 · Cited by 345
Tang, W. H. W., Wang, Z., Shrestha, K., Borowski, A. G., Wu, Y., Troughton, R. W., Klein, A. L., & Hazen, S. L. (2015) · Journal of Cardiac Failure · doi:10.1016/j.cardfail.2014.11.006 · Cited by 325
Pathophysiology of Acute Coronary Syndrome
Santos‐Gallego, C. G., Picatoste, B., & Badimón, J. J. (2014) · Current Atherosclerosis Reports · doi:10.1007/s11883-014-0401-9 · Cited by 264
PKCζ Regulates TNF-α–Induced Activation of NADPH Oxidase in Endothelial Cells
Frey, R. S., Rahman, A., Kefer, J., Minshall, R. D., & Malik, A. B. (2002) · Circulation Research · doi:10.1161/01.res.0000017631.28815.8e · Cited by 227
Min, J., Kim, Y., Kim, S. W., Kwon, M.-C., Kong, Y., Hwang, I. K., Won, M. H., Rho, J., & Kwon, Y. (2005) · The Journal of Immunology · doi:10.4049/jimmunol.175.1.531 · Cited by 218
Ufnal, M., Jazwiec, R., Dadlez, M., Drapala, A., Sikora, M., & Skrzypecki, J. (2014) · Canadian Journal of Cardiology · doi:10.1016/j.cjca.2014.09.010 · Cited by 205
Lim, S., Longley, R. L., Couchman, J., & Woods, A. (2003) · Journal of Biological Chemistry · doi:10.1074/jbc.m208300200 · Cited by 121
Majdalawieh, A. F., & Ro, J. (2010) · Mediators of Inflammation · doi:10.1155/2010/823821 · Cited by 108
Booth, G., Stalker, T. J., Lefer, A. M., & Scalia, R. G. (2002) · Diabetes · doi:10.2337/diabetes.51.5.1556 · Cited by 102
Kawakami, A., Aikawa, M., Nitta, N., Yoshida, M., Libby, P., & Sacks, F. M. (2006) · Arteriosclerosis Thrombosis and Vascular Biology · doi:10.1161/01.atv.0000249620.68705.0d · Cited by 99
Deficiency of the NR4A Orphan Nuclear Receptor NOR1 Decreases Monocyte Adhesion and Atherosclerosis
Zhao, Y., Howatt, D. A., Gizard, F., Nomiyama, T., Findeisen, H. M., Heywood, E. B., Jones, K. L., Conneely, O. M., Daugherty, A., & Bruemmer, D. (2010) · Circulation Research · doi:10.1161/circresaha.110.222083 · Cited by 89
Devlin, G. L., Parfrey, H., Tew, D. J., Lomas, D. A., & Bottomley, S. (2001) · American Journal of Respiratory Cell and Molecular Biology · doi:10.1165/ajrcmb.24.6.4407 · Cited by 88
Worldwide disparities in cardiovascular disease: Challenges and solutions
Okwuosa, I. S., Lewsey, S. C., Adesiyun, T. A., Blumenthal, R. S., & Yancy, C. W. (2015) · International Journal of Cardiology · doi:10.1016/j.ijcard.2015.08.172 · Cited by 86
Metaorganismal nutrient metabolism as a basis of cardiovascular disease
Brown, J. M., & Hazen, S. L. (2014) · Current Opinion in Lipidology · doi:10.1097/mol.0000000000000036 · Cited by 80
Gamble, J. R., & Vadas, M. A. (1988) · Journal of Immunological Methods · doi:10.1016/0022-1759(88)90240-2 · Cited by 78
Durpès, M.-C., Morin, C., Paquin-Veillette, J., Beland, R., Paré, M., Guimond, M., Rekhter, M. D., King, G. L., & Geraldes, P. (2015) · Cardiovascular Research · doi:10.1093/cvr/cvv107 · Cited by 74
Wei, C., Zhu, P., Shah, S. J., & Blair, I. A. (2009) · Molecular Pharmacology · doi:10.1124/mol.109.057489 · Cited by 70
Pan, B., Ren, H., Lv, X., Zhao, Y., Yu, B., He, Y., Ma, Y., Niu, C., Kong, J., Yu, F., et al. (2012) · Journal of Translational Medicine · doi:10.1186/1479-5876-10-65 · Cited by 64
Self-citationTreating Coronary Disease and the Impact of Endothelial Dysfunction
Matsuzawa, Y., Guddeti, R. R., Kwon, T., Lerman, L. O., & Lerman, A. (2014) · Progress in Cardiovascular Diseases · doi:10.1016/j.pcad.2014.10.004 · Cited by 61
Song, J., & Chuang, D. (2001) · Journal of Biological Chemistry · doi:10.1074/jbc.m107242200 · Cited by 49
Pan, B., Ma, Y., Ren, H., He, Y., Wang, Y., Lv, X., Liu, D., Liang, J., Yu, B., Wang, Y., et al. (2012) · PLoS ONE · doi:10.1371/journal.pone.0048530 · Cited by 49
Self-citationDisturbed Flow-Enhanced Endothelial Turnover in Atherosclerosis
Xu, Q. (2009) · Trends in Cardiovascular Medicine · doi:10.1016/j.tcm.2009.12.002 · Cited by 40
Ma, L., Guo, X., & Chen, W. (2015) · Europe PMC (PubMed Central) · Cited by 29
Dong, S., Kong, J., Kong, J., Shen, Q., Kong, F., Sun, W., & Zheng, L. (2015) · Anti-Cancer Agents in Medicinal Chemistry · doi:10.2174/1871520615666150209110832 · Cited by 27
Self-citationBodiga, V. L., Kudle, M. R., & Bodiga, S. (2015) · Biochemical Pharmacology · doi:10.1016/j.bcp.2015.08.101 · Cited by 25
Takahashi, K., Shimokado, K., & Yoshida, M. (2006) · European Journal of Pharmacology · doi:10.1016/j.ejphar.2006.09.028 · Cited by 19
Shi, R., Ré, D., Dudl, E. P., Cuddy, M., Okolotowicz, K. J., Dahl, R. S., Su, Y., Hurder, A., Kitada, S., Peddibhotla, S., et al. (2010) · ACS Chemical Biology · doi:10.1021/cb9003089 · Cited by 16
Jiang, R., Teng, Y., Huang, Y., Gu, J., & Li, M. (2009) · Gynecologic and Obstetric Investigation · doi:10.1159/000261788 · Cited by 11
Mechanism of PKC activity affecting the adhesion reaction of endothelial cells with monocytes
Li, L., Xu, S., Yan, J., Li, Y., Wang, X., Du, R., Zhu, J., Fu, X., Xiao, X., & Wang, Z. (2014) · International Journal of Cardiology · doi:10.1016/j.ijcard.2014.12.136 · Cited by 5
Cited by
Sorted by citations
Dietary metabolism, the gut microbiome, and heart failure
Tang, W. H. W., Li, D. Y., & Hazen, S. L. (2019) · Nature Reviews Cardiology · doi:10.1038/s41569-018-0108-7 · Cited by 789
The Gut Microbiota and Inflammation: An Overview
Bander, Z. A., Nitert, M. D., Mousa, A., & Naderpoor, N. (2020) · International Journal of Environmental Research and Public Health · doi:10.3390/ijerph17207618 · Cited by 804
Janeiro, M., Ramírez, M., Milagro, F., Martínez, J., & Solas, M. (2018) · Nutrients · doi:10.3390/nu10101398 · Cited by 631
Functions of Gut Microbiota Metabolites, Current Status and Future Perspectives
Liu, J., Tan, Y., Cheng, H., Zhang, D., Feng, W., & Peng, C. (2022) · Aging and disease · doi:10.14336/ad.2022.0104 · Cited by 529
“domain–containing 3 (NLRP3) inflammasome [143].”
Gut microbiota and cardiovascular disease: opportunities and challenges
Kazemian, N., Mahmoudi, M., Halperin, F. A., Wu, J. C., & Pakpour, S. (2020) · Microbiome · doi:10.1186/s40168-020-00821-0 · Cited by 404
Metadata
- Authors
- Ma, G., Pan, B., Chen, Y., Guo, C., Zhao, M., Zheng, L., & Chen, B.
- Affiliations
- Department of Cardiology, Beijing Tian Tan Hospital, Capital Medical University, Beijing 100050, China
- Peking University (CN)
- Capital Medical University (CN)
- Corresponding author
- Zheng, LeMin
- Chen, BuXing
- Venue
- Bioscience Reports
- Publisher
- Portland Press Ltd.
- Published
- 2017-03-02
- Volume
- 37
- Issue
- 2
- ISSN
- 0144-8463 (ISSN-L)
- 1573-4935
- PMC
- PMC5333780
- OpenAlex
- W2583372114
- Cited by
- 267
- References
- 46
- Citations by year
- 2026: 14 · 2025: 35 · 2024: 29 · 2023: 45 · 2022: 36 · 2021: 31 · 2020: 35 · 2019: 18 · 2018: 16 · 2017: 8
- FWCI
- 15.59
- Type
- journal article
- Language
- en
- Open access
- gold
- doi.org
- Locations
- Bioscience Reports (publishedVersion, cc-by)
- Europe PMC (PubMed Central) (publishedVersion, cc-by)
- PubMed Central (publishedVersion, cc-by)
- PubMed (publishedVersion)
- Greater South Information System
- Funders
- Academy of Medical Sciences
- National Natural Science Foundation of China (81172500, 81170101, 81570321, 81370235)
- Chinese Academy of Sciences
- Chinese Academy of Medical Sciences
- Topics
- Health Sciences › Medicine › Physiology (medical) › Nitric Oxide and Endothelin Effects
- Life Sciences › Immunology and Microbiology › Immunology › Atherosclerosis and Cardiovascular Diseases
- Health Sciences › Medicine › Immunology and Allergy › Cell Adhesion Molecules Research
- Keywords
- trimethylamine N-oxide, atherosclerosis, endothelial dysfunction, monocyte adhesion, VCAM-1, protein kinase C, NF-κB, endothelial cell migration, endothelial cell proliferation, extracellular matrix adhesion, human umbilical vein endothelial cells
- MeSH terms
- Cell Adhesion, Cells, Cultured, Humans, Methylamines, Monocytes, Protein Kinase C, Signal Transduction, NF-kappa B, Vascular Cell Adhesion Molecule-1, Atherosclerosis, Human Umbilical Vein Endothelial Cells
About these checks
Registry, retraction, Cites and statistics results are computed, not judged, with one exception: a printed reference that no index lists is read once by a model before it counts as a citation error. Claims are extracted by a model and kept only when their quote appears verbatim in the text; each cited source is then checked, with a model’s help, for whether it says what the claim relies on. Those verdicts can be wrong — read the claim’s quote and the cited source before relying on one.
Statistics and arithmetic are recomputed, not judged.
Confidence bands are shown only for fields calibrated on our annotated test set. None is calibrated yet, so no band is shown.
What counts as a claim ›How we measure confidence ›How we check this ›
Are you an author, or do you see a problem with this page? Request a review
