

The DOI matches its Crossref record; 59 of the 59 references it cites were found in a registry or an index.
Behavior-dependent cis regulation reveals genes and pathways associated with bower building in cichlid fishes
Abstract
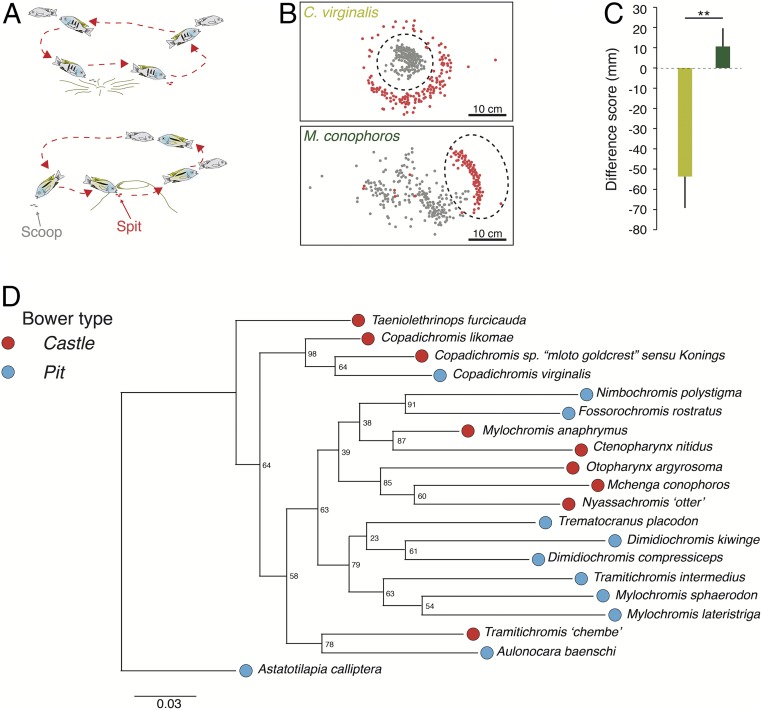
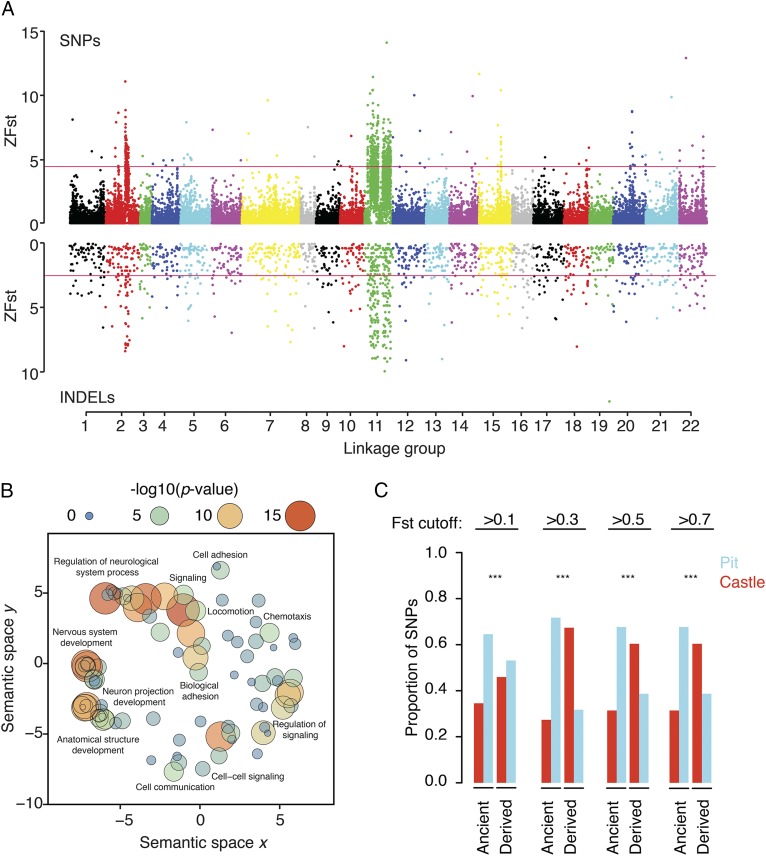
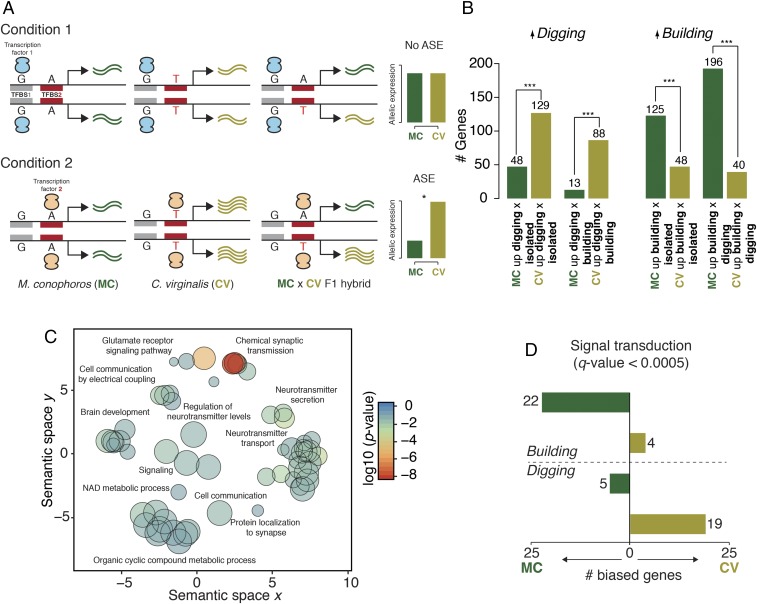
Significance: We do not fully understand how behavior evolves. Here we investigate the genomic basis of bower building among Lake Malawi cichlid fishes. Males construct bowers of two major types, pits and castles, to attract females in mating displays. Thousands of genetic variants are strongly associated with divergence in bower behavior. Remarkably, F 1 hybrids of pit-digging and castle-building species perform sequential construction of first pit and then castle bowers. Analysis of brain gene expression in hybrids showed behavior-dependent allele-specific expression with preferential expression of pit-digging alleles during pit digging and castle-building alleles during castle building. Our results suggest that behaviors evolve via complex genetic architectures featuring cis -regulatory differences whose effects on gene expression are specific and context dependent.
Overview
The claims and statistics of this paper haven’t been checked yet.
Run the check — free, no account needed. It reads the open-access text and checks the sources it cites.
Integrity signals
Registry
Cites
Statistics
Figures
Verification
Claims the paper makes
The claims and statistics of this paper haven’t been checked yet.
Run the check — free, no account needed. It reads the open-access text and checks the sources it cites.
Claims other papers make about this one
Each is checked against this paper’s own text: does it say what the citing paper says it does?
In the citing paper
“They identified behavior-associated genetic variants and reported allele-specific brain gene expression that depended on behavioral context.”
From Behavior-related gene regulatory networks: A new level of organization in the brain (2020) · cites this paper as [93]
In the citing paper
“Their study provides a concrete example of the connection between cis-regulatory evolution and diversity of social behavior.”
From Behavior-related gene regulatory networks: A new level of organization in the brain (2020) · cites this paper as [93]
Self-check
Percentages, sums and reported differences re-computed from the paper’s own numbers.
The self-check needs the paper’s full text.
Citations
Cites
The Sequence Alignment/Map format and SAMtools
Li, H., Handsaker, B., Wysoker, A., Fennell, T., Ruan, J., Homer, N., Marth, G., Abecasis, G., Durbin, R., & 1000 Genome Project Data Processing Subgroup (2009) · Bioinformatics · doi:10.1093/bioinformatics/btp352 · Cited by 62,041
Fast and accurate short read alignment with Burrows-Wheeler transform
Li, H., & Durbin, R. (2009) · Bioinformatics · doi:10.1093/bioinformatics/btp324 · Cited by 58,607
STAR: ultrafast universal RNA-seq aligner
Dobin, A., Davis, C. A., Schlesinger, F., Drenkow, J., Zaleski, C., Jha, S., Batut, P., Chaisson, M., & Gingeras, T. R. (2013) · Bioinformatics · doi:10.1093/bioinformatics/bts635 · Cited by 51,709
The Genome Analysis Toolkit: A MapReduce framework for analyzing next-generation DNA sequencing data
McKenna, A., Hanna, M., Banks, E., Sivachenko, A., Cibulskis, K., Kernytsky, A., Garimella, K., Altshuler, D., Gabriel, S., Daly, M., et al. (2010) · Genome Research · doi:10.1101/gr.107524.110 · Cited by 27,895
The variant call format and VCFtools
Danecek, P., Auton, A., Abecasis, G., Albers, C. A., Banks, E., DePristo, M. A., Handsaker, R. E., Lunter, G., Marth, G. T., Sherry, S. T., et al. (2011) · Bioinformatics · doi:10.1093/bioinformatics/btr330 · Cited by 16,200
Cingolani, P., Platts, A., Wang, L. L., Coon, M., Nguyen, T., Wang, L., Land, S. J., Lu, X., & Ruden, D. M. (2012) · Fly · doi:10.4161/fly.19695 · Cited by 11,816
A framework for variation discovery and genotyping using next-generation DNA sequencing data
DePristo, M. A., Banks, E., Poplin, R. E., Garimella, K. V., Maguire, J., Hartl, C., Philippakis, A., del Angel, G., Rivas, M. A., Hanna, M., et al. (2011) · Nature Genetics · doi:10.1038/ng.806 · Cited by 11,562
Van der Auwera, G. A., Carneiro, M. O., Hartl, C., Poplin, R., del Angel, G., Levy‐Moonshine, A., Jordan, T., Shakir, K., Roazen, D., Thibault, J., et al. (2013) · Current Protocols in Bioinformatics · doi:10.1002/0471250953.bi1110s43 · Cited by 6,687
REVIGO summarizes and visualizes long lists of gene ontology terms
Supek, F., Bošnjak, M., Škunca, N., & Šmuc, T. (2011) · PLoS ONE · doi:10.1371/journal.pone.0021800 · Cited by 6,264
Aligning sequence reads, clone sequences and assembly con*gs with BWA-MEM
Li, H. (2014) · arXiv (Cornell University) · doi:10.6084/m9.figshare.963153.v1 · Cited by 4,932
Genome-wide efficient mixed-model analysis for association studies
Zhou, X., & Stephens, M. (2012) · Nature Genetics · doi:10.1038/ng.2310 · Cited by 3,627 · cited 1×
“Proceedings of the National Academy of Sciences of the United States of America, 115(47), E11081-E11090.”
BackgroundPANTHER: A Library of Protein Families and Subfamilies Indexed by FunctionPreprint
Thomas, P. D., Campbell, M. J., Kejariwal, A., Mi, H., Karlak, B., Daverman, R., Diemer, K., Muruganujan, A., & Narechania, A. (2003) · Genome Research · doi:10.1101/gr.772403 · Cited by 2,979
NGS QC Toolkit: A Toolkit for Quality Control of Next Generation Sequencing Data
Patel, R. K., & Jain, M. (2012) · PLoS ONE · doi:10.1371/journal.pone.0030619 · Cited by 2,921
An Expanded View of Complex Traits: From Polygenic to Omnigenic
Boyle, E. A., Li, Y. I., & Pritchard, J. K. (2017) · Cell · doi:10.1016/j.cell.2017.05.038 · Cited by 2,851
Inference of population splits and mixtures from genome-wide allele frequency data
Pickrell, J. K., & Pritchard, J. K. (2012) · PLoS Genetics · doi:10.1371/journal.pgen.1002967 · Cited by 2,731
The genomic basis of adaptive evolution in threespine sticklebacks
Jones, F. C., Grabherr, M. G., Chan, Y. F., Russell, P. H., Mauceli, E., Johnson, J., Swofford, R., Pirun, M., Zody, M. C., White, S. J., et al. (2012) · Nature · doi:10.1038/nature10944 · Cited by 1,810
BreakDancer: an algorithm for high-resolution mapping of genomic structural variation
Chen, K., Wallis, J. W., McLellan, M. D., Larson, D. E., Kalicki, J. M., Pohl, C. S., McGrath, S. D., Wendl, M. C., Zhang, Q., Locke, D. P., et al. (2009) · Nature Methods · doi:10.1038/nmeth.1363 · Cited by 1,489
Adaptive seeds tame genomic sequence comparisonPreprint
Kiełbasa, S. M., Wan, R., Sato, K., Horton, P., & Frith, M. C. (2011) · Genome Research · doi:10.1101/gr.113985.110 · Cited by 1,296
Cis-regulatory elements: Molecular mechanisms and evolutionary processes underlying divergence
Wittkopp, P. J., & Kalay, G. (2012) · Nature Reviews Genetics · doi:10.1038/nrg3095 · Cited by 1,231
Chromosome inversions, local adaptation and speciation
Kirkpatrick, M., & Barton, N. (2006) · Genetics · doi:10.1534/genetics.105.047985 · Cited by 1,178
Evolution of Darwin’s finches and their beaks revealed by genome sequencing
Lamichhaney, S., Berglund, J., Almén, M. S., Maqbool, K., Grabherr, M. G., Barrio, Á. M., Promerová, M., Rubin, C., Wang, C., Zamani, N., et al. (2015) · Nature · doi:10.1038/nature14181 · Cited by 993
The genomic substrate for adaptive radiation in African cichlid fish
Brawand, D., Wagner, C. E., Li, Y. I., Malinsky, M., Keller, I., Fan, S., Simakov, O., Ng, A. Y., Lim, Z. W., Bezault, E., et al. (2014) · Nature · doi:10.1038/nature13726 · Cited by 986
Self-citationEvaluating the Use of ABBA–BABA Statistics to Locate Introgressed Loci
Martin, S. H., Davey, J. W., & Jiggins, C. D. (2014) · Molecular Biology and Evolution · doi:10.1093/molbev/msu269 · Cited by 751
Ancient hybridization fuels rapid cichlid fish adaptive radiations
Meier, J. I., Marques, D. A., Mwaiko, S., Wagner, C. E., Excoffier, L., & D, O. S. C. (2017) · Nature Communications · doi:10.1038/ncomms14363 · Cited by 745
fdrtool: a versatile R package for estimating local and tail area-based false discovery rates
Strimmer, K. (2008) · Bioinformatics · doi:10.1093/bioinformatics/btn209 · Cited by 723
DensiTree: making sense of sets of phylogenetic trees
Bouckaert, R. (2010) · Bioinformatics · doi:10.1093/bioinformatics/btq110 · Cited by 704
DNase I sensitivity QTLs are a major determinant of human expression variation
Degner, J. F., Pai, A. A., Piqué-Regi, R., Veyrieras, J., Gaffney, D. J., Pickrell, J. K., Leon, S. D., Michelini, K., Lewellen, N., Crawford, G. E., et al. (2012) · Nature · doi:10.1038/nature10808 · Cited by 636
Robinson, G. E., Fernald, R. D., & Clayton, D. F. (2008) · Science · doi:10.1126/science.1159277 · Cited by 597
Self-citationSNPhylo: a pipeline to construct a phylogenetic tree from huge SNP data
Lee, T., Guo, H., Wang, X., Kim, C., & Paterson, A. H. (2014) · BMC Genomics · doi:10.1186/1471-2164-15-162 · Cited by 549
A supergene determines highly divergent male reproductive morphs in the ruff
Küpper, C., Stocks, M., Risse, J. E., dos Remedios, N., Farrell, L. L., McRae, S. B., Morgan, T. C., Karlionova, N., Pinchuk, P., Verkuil, Y. I., et al. (2015) · Nature Genetics · doi:10.1038/ng.3443 · Cited by 549
Single-cell analysis of experience-dependent transcriptomic states in the mouse visual cortex
Hrvatin, S., Hochbaum, D. R., Nagy, M. A., Cicconet, M., Robertson, K., Cheadle, L., Zilionis, R., Ratner, A., Borges-Monroy, R., Klein, A. M., et al. (2018) · Nature Neuroscience · doi:10.1038/s41593-017-0029-5 · Cited by 497
Lamichhaney, S., Fan, G., Widemo, F., Gunnarsson, U., Schwochow, D., Hoeppner, M. P., Kerje, S., Gustafson, U., Shi, C., Zhang, H., et al. (2015) · Nature Genetics · doi:10.1038/ng.3430 · Cited by 431
Genetics and genomics of psychiatric disease
Geschwind, D. H., & Flint, J. (2015) · Science · doi:10.1126/science.aaa8954 · Cited by 424
Genomic islands of speciation separate cichlid ecomorphs in an East African crater lake
Malinsky, M., Challis, R. J., Tyers, A. M., Schiffels, S., Terai, Y., Ngatunga, B. P., Miska, E. A., Durbin, R., Genner, M. J., & Turner, G. F. (2015) · Science · doi:10.1126/science.aac9927 · Cited by 420
Self-citationSupergenes and Complex Phenotypes
Schwander, T., Libbrecht, R., & Keller, L. (2014) · Current Biology · doi:10.1016/j.cub.2014.01.056 · Cited by 412
Integrated genome browser: visual analytics platform for genomics
Freese, N. H., Norris, D. C., & Loraine, A. E. (2016) · Bioinformatics · doi:10.1093/bioinformatics/btw069 · Cited by 371
Sexual Conflict Resolved by Invasion of a Novel Sex Determiner in Lake Malawi Cichlid Fishes
Roberts, R. B., Ser, J. R., & Kocher, T. D. (2009) · Science · doi:10.1126/science.1174705 · Cited by 337
Exploring Evolutionary Relationships Across the Genome Using Topology Weighting
Martin, S. H., & Belleghem, S. M. V. (2017) · Genetics · doi:10.1534/genetics.116.194720 · Cited by 283
Orr, H. A. (1998) · Genetics · doi:10.1093/genetics/149.4.2099 · Cited by 276
Fuchs, S. B.-A., Lieder, I., Stelzer, G., Mazor, Y., Buzhor, E., Kaplan, S., Bogoch, Y., Plaschkes, I., Shitrit, A., Rappaport, N., et al. (2016) · OMICS A Journal of Integrative Biology · doi:10.1089/omi.2015.0168 · Cited by 256
Parallel evolution of domesticated Caenorhabditis species targets pheromone receptor genes
McGrath, P. T., Xu, Y., Ailion, M., Garrison, J. L., Butcher, R. A., & Bargmann, C. I. (2011) · Nature · doi:10.1038/nature10378 · Cited by 231
Self-citationIrisarri, I., Singh, P., Koblmüller, S., Torres‐Dowdall, J., Henning, F., Franchini, P., Fischer, C., Lemmon, A. R., Lemmon, E. M., Thallinger, G., et al. (2018) · Nature Communications · doi:10.1038/s41467-018-05479-9 · Cited by 218
Chandrasekaran, S., Ament, S. A., Eddy, J. A., Rodriguez-Zas, S. L., Schatz, B. R., Price, N. D., & Robinson, G. E. (2011) · Proceedings of the National Academy of Sciences · doi:10.1073/pnas.1114093108 · Cited by 176
MBASED: allele-specific expression detection in cancer tissues and cell lines
Mayba, O., Gilbert, H., Liu, J., Haverty, P. M., Jhunjhunwala, S., Jiang, Z., Watanabe, C. K., & Zhang, Z. (2014) · Genome biology · doi:10.1186/s13059-014-0405-3 · Cited by 139
High-throughput allele-specific expression across 250 environmental conditionsPreprint
Moyerbrailean, G. A., Richards, A. L., Kurtz, D. A., Kalita, C. A., Davis, G. O., Harvey, C. T., Alazizi, A., Watza, D., Sorokin, Y., Hauff, N., et al. (2016) · Genome Research · doi:10.1101/gr.209759.116 · Cited by 124
Loh, Y. E., Katz, L. S., Mims, M. C., Kocher, T. D., Yi, S. V., & Streelman, J. T. (2008) · Genome biology · doi:10.1186/gb-2008-9-7-r113 · Cited by 112
Self-citationOrigins of Shared Genetic Variation in African Cichlids
Loh, Y. E., Bezault, É., Muenzel, F. M., Roberts, R. B., Swofford, R., Barluenga, M., Kidd, C. E., Howe, A. E., Palma, F. D., Lindblad‐Toh, K., et al. (2012) · Molecular Biology and Evolution · doi:10.1093/molbev/mss326 · Cited by 101
Self-citationAlbertson, R. C., Powder, K. E., Hu, Y., Coyle, K. P., Roberts, R. B., & Parsons, K. J. (2014) · Molecular Ecology · doi:10.1111/mec.12900 · Cited by 93
Parnell, N. F., & Streelman, J. T. (2012) · Heredity · doi:10.1038/hdy.2012.73 · Cited by 81
Self-citationAmores, A., Catchen, J., Nanda, I., Warren, W. C., Walter, R., Schartl, M., & Postlethwait, J. H. (2014) · Genetics · doi:10.1534/genetics.114.164293 · Cited by 74
Geography disentangles introgression from ancestral polymorphism in Lake Malawi cichlids
Mims, M. C., Hulsey, C. D., Fitzpatrick, B. M., & Streelman, J. T. (2010) · Molecular Ecology · doi:10.1111/j.1365-294x.2010.04529.x · Cited by 73
Self-citationAn improved genome reference for the African cichlid, Metriaclima zebra
Conte, M. A., & Kocher, T. D. (2015) · BMC Genomics · doi:10.1186/s12864-015-1930-5 · Cited by 69
Self-citationSystematic Detection of Polygenic cis-Regulatory Evolution
Fraser, H. B., Babak, T., Tsang, J. S., Zhou, Y., Zhang, B., Mehrabian, M., & Schadt, E. E. (2011) · PLoS Genetics · doi:10.1371/journal.pgen.1002023 · Cited by 65
Self-citationHsu, R., Schofield, C. M., Cruz, C. G. D., Jones, D. M., Blelloch, R. H., & Ullian, E. M. (2012) · Molecular and Cellular Neuroscience · doi:10.1016/j.mcn.2012.06.002 · Cited by 56
Mapping of pigmentation QTL on an anchored genome assembly of the cichlid fish, Metriaclima zebra
O’Quin, C. T., DRILEA, A. C., Conte, M. A., & Kocher, T. D. (2013) · BMC Genomics · doi:10.1186/1471-2164-14-287 · Cited by 42
Self-citationEvolution of bower building in Lake Malawi cichlid fish: phylogeny, morphology, and behavior
York, R. A., Patil, C., Hulsey, C. D., Streelman, J. T., & Fernald, R. D. (2015) · Frontiers in Ecology and Evolution · doi:10.3389/fevo.2015.00018 · Cited by 37
Self-citationGenome-wide protein phylogenies for four African cichlid species
Varadarajan, A. R., Mopuri, R., Streelman, J. T., & McGrath, P. T. (2018) · BMC Evolutionary Biology · doi:10.1186/s12862-017-1072-2 · Cited by 31
Self-citationEvolution of Na,K-ATPase βm-subunit into a coregulator of transcription in placental mammals
Pestov, N. B., Ahmad, N., Korneenko, T. V., Zhao, H., Radkov, R., Schaer, D., Roy, S., Bibert, S., Geering, K., & Modyanov, N. N. (2007) · Proceedings of the National Academy of Sciences · doi:10.1073/pnas.0704809104 · Cited by 29
Magalhaes, I. S., Croft, G. E., & Joyce, D. A. (2013) · PeerJ · doi:10.7717/peerj.209 · Cited by 12
Research works printed but not linked: 1
- MHA Keenleyside Cichlid Fishes: Behavior, Ecology and Evolution (Chapman and Hall, 1st Ed, London, 1991).
Cited by
Behavior-related gene regulatory networks: A new level of organization in the brain
Sinha, S., Jones, B. M., Traniello, I. M., Bukhari, S. A., Halfon, M. S., Hofmann, H. A., Huang, S., Katz, P. S., Keagy, J., Lynch, V. J., et al. (2020) · Proceedings of the National Academy of Sciences · doi:10.1073/pnas.1921625117 · Cited by 85
Metadata
- Authors
- York, R. A., Patil, C., Abdilleh, K., Johnson, Z. V., Conte, M. A., Genner, M. J., McGrath, P. T., Fraser, H. B., Fernald, R. D., & Streelman, J. T.
- Affiliations
- Department of Biology, Stanford University, Stanford, CA 94305;
- School of Biological Sciences, Georgia Institute of Technology, Atlanta, GA 30332;
- Department of Biology, University of Maryland, College Park, MD 20742;
- School of Biological Sciences, University of Bristol, BS8 1TH Bristol, United Kingdom
- ORCID
- Patil, Chinar
- Venue
- Proceedings of the National Academy of Sciences
- Publisher
- National Academy of Sciences
- Published
- 2018-11-05
- Volume
- 115
- Issue
- 47
- ISSN
- 0027-8424
- 1091-6490
- PMC
- PMC6255178
- Cited by
- 60
- References
- 59
- Language
- en
- Funders
- HHS | National Institutes of Health (R01GM101095, 2R01GM097171-05A1, R21AG050304, R01GM114170)
- HHS | NIH | National Institute of Neurological Disorders and Stroke (R01NINDS034950)
About these checks
Registry, retraction, Cites and statistics results are computed, not judged, with one exception: a printed reference that no index lists is read once by a model before it counts as a citation error. Claims are extracted by a model and kept only when their quote appears verbatim in the text; each cited source is then checked, with a model’s help, for whether it says what the claim relies on. Those verdicts can be wrong — read the claim’s quote and the cited source before relying on one.
Statistics and arithmetic are recomputed, not judged.
Confidence bands are shown only for fields calibrated on our annotated test set. None is calibrated yet, so no band is shown.
What counts as a claim ›How we measure confidence ›How we check this ›
Are you an author, or do you see a problem with this page? Request a review
Data sources
Bibliographic data: Semantic Scholar, OpenAlex, Crossref.
Contains information from the Semantic Scholar Academic Graph Datasets, made available under the ODC Attribution License (ODC-BY 1.0).
Semantic Scholar’s data is described in: Kinney, R., et al. (2023). The Semantic Scholar Open Data Platform. arXiv:2301.10140.
