

The DOI matches its Crossref record; 53 of the 53 references it cites were found in a registry or an index.
Paf1C regulates RNA polymerase II progression by modulating elongation rate
Open accessAbstract
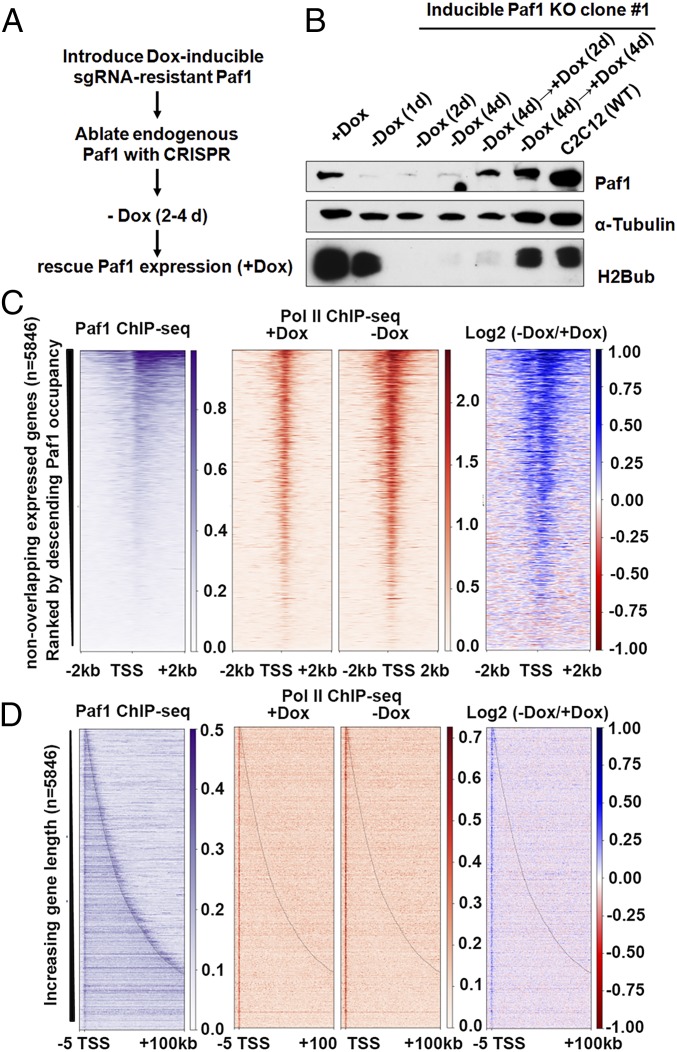
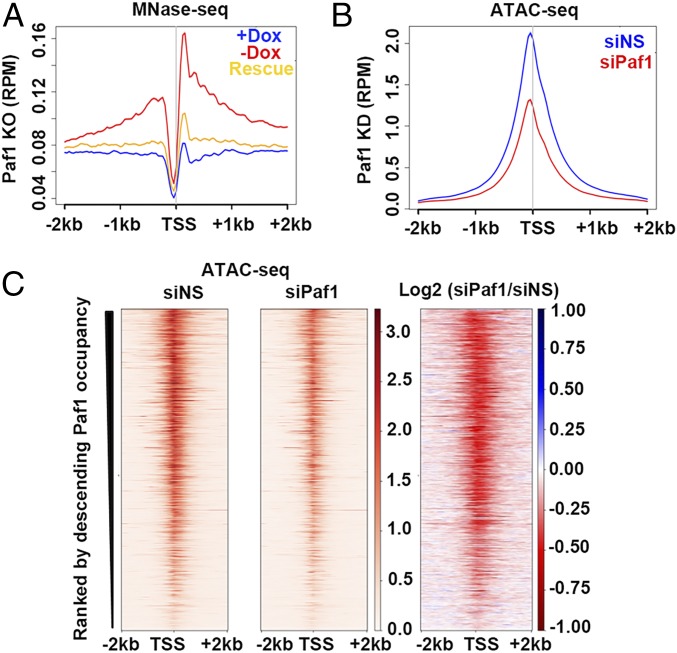
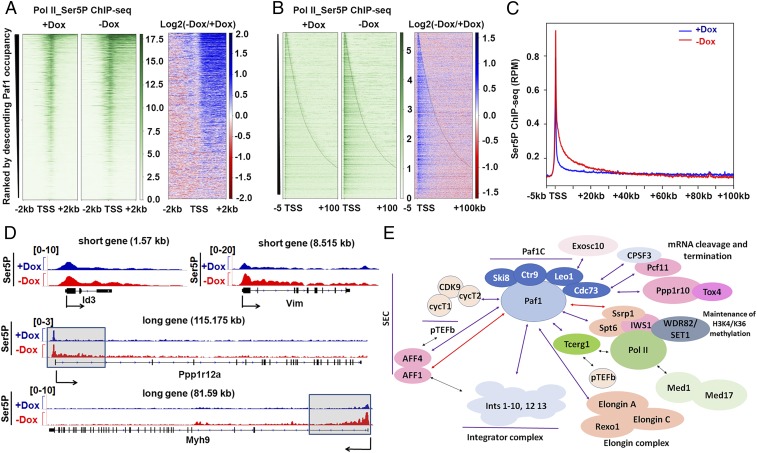
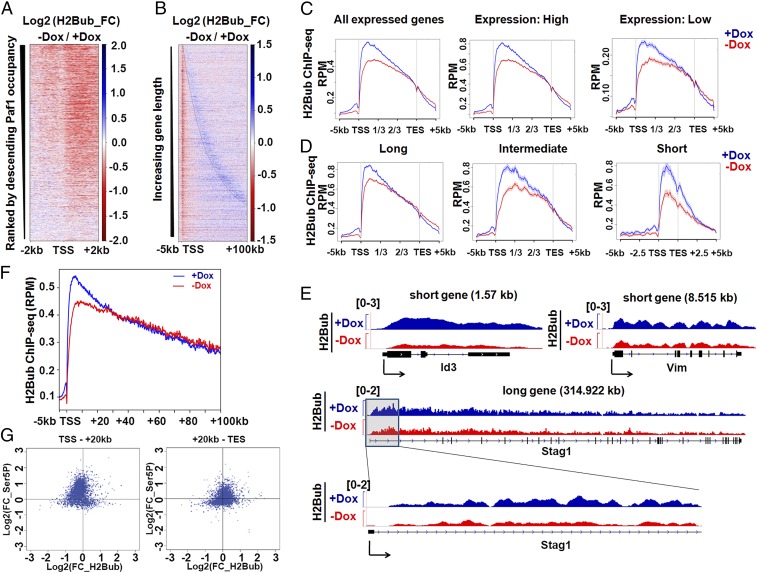
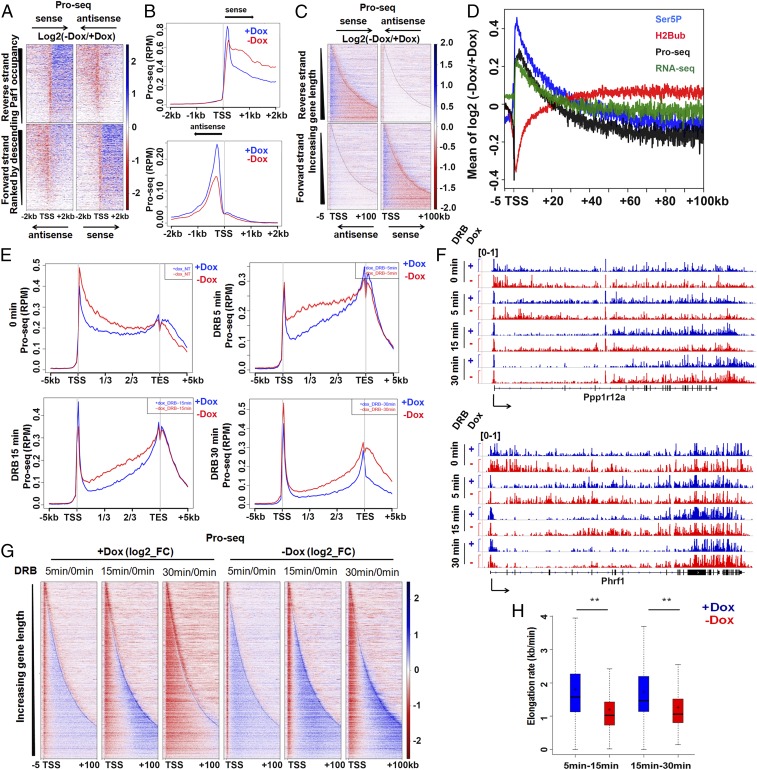
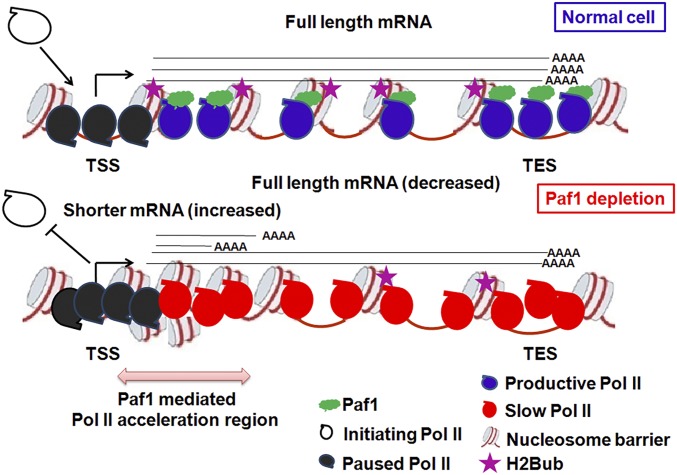
Elongation factor Paf1C regulates several stages of the RNA polymerase II (Pol II) transcription cycle, although it is unclear how it modulates Pol II distribution and progression in mammalian cells. We found that conditional ablation of Paf1 resulted in the accumulation of unphosphorylated and Ser5 phosphorylated Pol II around promoter-proximal regions and within the first 20 to 30 kb of gene bodies, respectively. Paf1 ablation did not impact the recruitment of other key elongation factors, namely, Spt5, Spt6, and the FACT complex, suggesting that Paf1 function may be mechanistically distinguishable from each of these factors. Moreover, loss of Paf1 triggered an increase in TSS-proximal nucleosome occupancy, which could impose a considerable barrier to Pol II elongation past TSS-proximal regions. Remarkably, accumulation of Ser5P in the first 20 to 30 kb coincided with reductions in histone H2B ubiquitylation within this region. Furthermore, we show that nascent RNA species accumulate within this window, suggesting a mechanism whereby Paf1 loss leads to aberrant, prematurely terminated transcripts and diminution of full-length transcripts. Importantly, we found that loss of Paf1 results in Pol II elongation rate defects with significant rate compression. Our findings suggest that Paf1C is critical for modulating Pol II elongation rates by functioning beyond the pause-release step as an “accelerator” over specific early gene body regions.
Overview
The claims and statistics of this paper haven’t been checked yet.
Run the check — free, no account needed. It reads the open-access text and checks the sources it cites.
Integrity signals
Registry
Cites
Statistics
Figures
Verification
Claims the paper makes
The claims and statistics of this paper haven’t been checked yet.
Run the check — free, no account needed. It reads the open-access text and checks the sources it cites.
Claims other papers make about this one
Each is checked against this paper’s own text: does it say what the citing paper says it does?
The cited source says what the claim attributes to it.
In the citing paper
“Paf1C specifically increases RNA Pol II velocity within the first part of gene bodies in mice (Hou et al, 2019), although no effect of the loss of this factor could be measured in budding yeast (Mason & Struhl, 2005).”
From RNA polymerase II speed: a key player in controlling and adapting transcriptome composition (2021) · cites this paper as Hou et al, 2019
Self-check
Percentages, sums and reported differences re-computed from the paper’s own numbers.
The self-check needs the paper’s full text.
Citations
Cites
c-Myc Regulates Transcriptional Pause Release
Rahl, P. B., Lin, C. Y., Seila, A. C., Flynn, R. A., McCuine, S., Burge, C. B., Sharp, P. A., & Young, R. A. (2010) · Cell · doi:10.1016/j.cell.2010.03.030 · Cited by 1,279
Promoter-proximal pausing of RNA polymerase II: emerging roles in metazoans
Adelman, K., & Lis, J. T. (2012) · Nature Reviews Genetics · doi:10.1038/nrg3293 · Cited by 1,221
Precise Maps of RNA Polymerase Reveal How Promoters Direct Initiation and Pausing
Kwak, H., Fuda, N. J., Core, L. J., & Lis, J. T. (2013) · Science · doi:10.1126/science.1229386 · Cited by 849
Nascent transcript sequencing visualizes transcription at nucleotide resolution
Churchman, L. S., & Weissman, J. S. (2011) · Nature · doi:10.1038/nature09652 · Cited by 823
RNA Exosome Depletion Reveals Transcription Upstream of Active Human Promoters
Preker, P., Nielsen, J. S., Kammler, S., Lykke‐Andersen, S., Christensen, M. S., Mapendano, C. K., Schierup, M. H., & Jensen, T. H. (2008) · Science · doi:10.1126/science.1164096 · Cited by 777
Pavri, R., Zhu, B., Li, G., Trojer, P., Mandal, S. S., Shilatifard, A., & Reinberg, D. (2006) · Cell · doi:10.1016/j.cell.2006.04.029 · Cited by 708
Transcription Elongation Factors Repress Transcription Initiation from Cryptic Sites
Kaplan, C. D., Laprade, L., & Winston, F. (2003) · Science · doi:10.1126/science.1087374 · Cited by 597
Jonkers, I., Kwak, H., & Lis, J. T. (2014) · eLife · doi:10.7554/elife.02407 · Cited by 581
Baillat, D., Hakimi, M., Näär, A. M., Shilatifard, A., Cooch, N. S., & Shiekhattar, R. (2005) · Cell · doi:10.1016/j.cell.2005.08.019 · Cited by 548
Mahat, D. B., Kwak, H., Booth, G. T., Jonkers, I. H., Danko, C. G., Patel, R. K., Waters, C. T., Munson, K. M., Core, L. J., & Lis, J. T. (2016) · Nature Protocols · doi:10.1038/nprot.2016.086 · Cited by 517
RNA Polymerase II Elongation Factors of Saccharomyces cerevisiae: a Targeted Proteomics Approach
Krogan, N. J., Kim, M., Ahn, S., Zhong, G., Kobor, M. S., Cagney, G., Emili, A., Shilatifard, A., Buratowski, S., & Greenblatt, J. (2002) · Molecular and Cellular Biology · doi:10.1128/mcb.22.20.6979-6992.2002 · Cited by 497
The regulation and functions of the nuclear RNA exosome complex
Kilchert, C., Wittmann, S., & Vasiljeva, L. (2016) · Nature Reviews Molecular Cell Biology · doi:10.1038/nrm.2015.15 · Cited by 464
Uniform transitions of the general RNA polymerase II transcription complex
Mayer, A., Lidschreiber, M., Siebert, M., Leike, K., Söding, J., & Cramer, P. (2010) · Nature Structural & Molecular Biology · doi:10.1038/nsmb.1903 · Cited by 446
Ng, H., Xu, R.-M., Zhang, Y., & Struhl, K. (2002) · Journal of Biological Chemistry · doi:10.1074/jbc.c200433200 · Cited by 432
Structure of activated transcription complex Pol II–DSIF–PAF–SPT6
Vos, S. M., Farnung, L., Boehning, M., Wigge, C., Linden, A., Urlaub, H., & Cramer, P. (2018) · Nature · doi:10.1038/s41586-018-0440-4 · Cited by 432
Nucleosomes Are Context-Specific, H2A.Z-Modulated Barriers to RNA Polymerase
Weber, C. M., Ramachandran, S., & Henikoff, S. (2014) · Molecular Cell · doi:10.1016/j.molcel.2014.02.014 · Cited by 418
Gilchrist, D. A., dos Santos, G., Fargo, D. C., Xie, B., Gao, Y., Li, L., & Adelman, K. (2010) · Cell · doi:10.1016/j.cell.2010.10.004 · Cited by 414
Structure of paused transcription complex Pol II–DSIF–NELF
Vos, S. M., Farnung, L., Urlaub, H., & Cramer, P. (2018) · Nature · doi:10.1038/s41586-018-0442-2 · Cited by 399
Histone H2B Ubiquitylation Is Associated with Elongating RNA Polymerase II
Xiao, T., Kao, C.-F., Krogan, N. J., Sun, Z., Greenblatt, J., Osley, M. A., & Strahl, B. D. (2005) · Molecular and Cellular Biology · doi:10.1128/mcb.25.2.637-651.2005 · Cited by 338
Danko, C. G., Hah, N., Luo, X., Martins, A. L., Core, L., Lis, J. T., Siepel, A., & Kraus, W. L. (2013) · Molecular Cell · doi:10.1016/j.molcel.2013.02.015 · Cited by 333
Integrator mediates the biogenesis of enhancer RNAs
Lai, F., Gardini, A., Zhang, A., & Shiekhattar, R. (2015) · Nature · doi:10.1038/nature14906 · Cited by 331
Squazzo, S. L., Costa, P. J., Lindstrom, D. L., Kumer, K. E., Simic, R., Jennings, J. L., Link, A. J., Arndt, K. M., & Hartzog, G. A. (2002) · The EMBO Journal · doi:10.1093/emboj/21.7.1764 · Cited by 322
Nucleosomes Can Form a Polar Barrier to Transcript Elongation by RNA Polymerase II
Bondarenko, V. A., Steele, L. M., Újvári, A., Gaykalova, D. A., Kulaeva, O. I., Polikanov, Y. S., Luse, D. S., & Studitsky, V. M. (2006) · Molecular Cell · doi:10.1016/j.molcel.2006.09.009 · Cited by 272
The Paf1 complex: Platform or player in RNA polymerase II transcription?
Jaehning, J. A. (2010) · Biochimica et Biophysica Acta (BBA) - Gene Regulatory Mechanisms · doi:10.1016/j.bbagrm.2010.01.001 · Cited by 260
PAF1, a Molecular Regulator of Promoter-Proximal Pausing by RNA Polymerase II
Chen, F., Woodfin, A. R., Gardini, A., Rickels, R. A., Marshall, S. A., Smith, E. R., Shiekhattar, R., & Shilatifard, A. (2015) · Cell · doi:10.1016/j.cell.2015.07.042 · Cited by 253
CDK9-dependent RNA polymerase II pausing controls transcription initiation
Gressel, S., Schwalb, B., Decker, T.-M., Qin, W., Leonhardt, H., Eick, D., & Cramer, P. (2017) · eLife · doi:10.7554/elife.29736 · Cited by 247
Yu, M., Yang, W., Ni, T., Tang, Z., Nakadai, T., Zhu, J., & Roeder, R. G. (2015) · Science · doi:10.1126/science.aad2338 · Cited by 241
Paused RNA polymerase II inhibits new transcriptional initiation
Shao, W.-Q., & Zeitlinger, J. (2017) · Nature Genetics · doi:10.1038/ng.3867 · Cited by 240
The human PAF complex coordinates transcription with events downstream of RNA synthesisPreprint
Zhu, B., Mandal, S. S., Pham, A.-D., Zheng, Y., Erdjument‐Bromage, H., Batra, S. K., Tempst, P., & Reinberg, D. (2005) · Genes & Development · doi:10.1101/gad.1292105 · Cited by 237
Growth-related Changes in Phosphorylation of Yeast RNA Polymerase II
Patturajan, M., Schulte, R. J., Sefton, B. M., Berezney, R., Vincent, M., Bensaude, O., Warren, S. L., & Corden, J. L. (1998) · Journal of Biological Chemistry · doi:10.1074/jbc.273.8.4689 · Cited by 223
Fong, N., Brannan, K., Erickson, B., Kim, H., Cortazar, M. A., Sheridan, R. M., Nguyen, T., Karp, S., & Bentley, D. L. (2015) · Molecular Cell · doi:10.1016/j.molcel.2015.09.026 · Cited by 217
Stadelmayer, B., Micas, G., Gamot, A., Martin, P. G. P., Laviolette‐Malirat, N., Koval, S., Raffel, R., Sobhian, B., Séverac, D., Rialle, S., et al. (2014) · Nature Communications · doi:10.1038/ncomms6531 · Cited by 213
Boehm, A. K., Saunders, A., Werner, J. K., & Lis, J. T. (2003) · Molecular and Cellular Biology · doi:10.1128/mcb.23.21.7628-7637.2003 · Cited by 212
Structural basis of the nucleosome transition during RNA polymerase II passage
Kujirai, T., Ehara, H., Fujino, Y., Shirouzu, M., Sekine, S., & Kurumizaka, H. (2018) · Science · doi:10.1126/science.aau9904 · Cited by 210
Liu, Y., Warfield, L., Zhang, C., Luo, J., Allen, J. J., Lang, W. H., Ranish, J. A., Shokat, K. M., & Hahn, S. (2009) · Molecular and Cellular Biology · doi:10.1128/mcb.00609-09 · Cited by 191
Self-citationEmerging Insights into the Roles of the Paf1 Complex in Gene Regulation
Oss, S. B. V., Cucinotta, C. E., & Arndt, K. M. (2017) · Trends in Biochemical Sciences · doi:10.1016/j.tibs.2017.08.003 · Cited by 166
Antosz, W., Pfab, A., Ehrnsberger, H. F., Holzinger, P., Köllen, K., Mortensen, S. A., Bruckmann, A., Schubert, T. E. O., Längst, G., Griesenbeck, J., et al. (2017) · The Plant Cell · doi:10.1105/tpc.16.00735 · Cited by 147
The tumor suppressor Cdc73 functionally associates with CPSF and CstF 3′ mRNA processing factors
Rozenblatt–Rosen, O., Nagaike, T., Francis, J. M., Kaneko, S., Glatt, K. A., Hughes, C. M., LaFramboise, T., Manley, J. L., & Meyerson, M. M. (2009) · Proceedings of the National Academy of Sciences · doi:10.1073/pnas.0812023106 · Cited by 141
PAF1 regulation of promoter-proximal pause release via enhancer activation
Chen, F., Xie, P., Collings, C. K., Cao, K., Aoi, Y., Marshall, S. A., Rendleman, E. J., Ugarenko, M., Ozark, P. A., Zhang, A., et al. (2017) · Science · doi:10.1126/science.aan3269 · Cited by 134
Mechanistic Interpretation of Promoter-Proximal Peaks and RNAPII Density Maps
Ehrensberger, A. H., Kelly, G. P., & Svejstrup, J. Q. (2013) · Cell · doi:10.1016/j.cell.2013.07.032 · Cited by 125
Tracking rates of transcription and splicing in vivo
Ardehali, M. B., & Lis, J. T. (2009) · Nature Structural & Molecular Biology · doi:10.1038/nsmb1109-1123 · Cited by 125
Genome-wide Analysis of RNA Polymerase II Termination at Protein-Coding Genes
Baejen, C., Andréani, J., Torkler, P., Battaglia, S., Schwalb, B., Lidschreiber, M., Maier, K. C., Boltendahl, A., Rus, P., Esslinger, S., et al. (2017) · Molecular Cell · doi:10.1016/j.molcel.2017.02.009 · Cited by 122
Fuchs, G., Hollander, D., Voichek, Y., Ast, G., & Oren, M. (2014) · Genome Research · doi:10.1101/gr.176487.114 · Cited by 102
DeGennaro, C. M., Alver, B. H., Marguerat, S., Stepanova, E. N., Davis, C. P., Bähler, J., Park, P. J., & Winston, F. (2013) · Molecular and Cellular Biology · doi:10.1128/mcb.01068-13 · Cited by 99
Fong, N., Saldi, T., Sheridan, R. M., Cortazar, M. A., & Bentley, D. L. (2017) · Molecular Cell · doi:10.1016/j.molcel.2017.04.016 · Cited by 98
Spt5 Plays Vital Roles in the Control of Sense and Antisense Transcription Elongation
Shetty, A., Kallgren, S. P., Demel, C., Maier, K. C., Spatt, D., Alver, B. H., Cramer, P., Park, P. J., & Winston, F. (2017) · Molecular Cell · doi:10.1016/j.molcel.2017.02.023 · Cited by 95
H2B Ubiquitylation Promotes RNA Pol II Processivity via PAF1 and pTEFb
Wu, L., Li, L., Zhou, B. O., Qin, Z. S., & Dou, Y. (2014) · Molecular Cell · doi:10.1016/j.molcel.2014.04.013 · Cited by 91
Integrator: surprisingly diverse functions in gene expression
Baillat, D., & Wagner, E. J. (2015) · Trends in Biochemical Sciences · doi:10.1016/j.tibs.2015.03.005 · Cited by 91
PAF Complex Plays Novel Subunit-Specific Roles in Alternative Cleavage and Polyadenylation
Yang, Y., Li, W., Hoque, M., Hou, L., Shen, S., Tian, B., & Dynlacht, B. D. (2016) · PLoS Genetics · doi:10.1371/journal.pgen.1005794 · Cited by 79
Self-citationFitz, J., Neumann, T., & Pavri, R. (2018) · The EMBO Journal · doi:10.15252/embj.201797965 · Cited by 74
Paf1 Has Distinct Roles in Transcription Elongation and Differential Transcript Fate
Fischl, H., Howe, F. S., Furger, A., & Mellor, J. (2017) · Molecular Cell · doi:10.1016/j.molcel.2017.01.006 · Cited by 69
Liu, X., Freitas, J., Zheng, D., Oliveira, M. S., Hoque, M., Martins, T., Henriques, T., Tian, B., & Moreira, A. (2017) · RNA · doi:10.1261/rna.062661.117 · Cited by 67
Self-citationVethantham, V., Yang, Y., Bowman, C., Asp, P., Lee, J., Skalnik, D. G., & Dynlacht, B. D. (2012) · Molecular and Cellular Biology · doi:10.1128/mcb.06026-11 · Cited by 65
Self-citation
Cited by
Sorted by citations
Structure and mechanism of the RNA polymerase II transcription machineryPreprint
Schier, A. C., & Taatjes, D. J. (2020) · Genes & Development · doi:10.1101/gad.335679.119 · Cited by 327
RNA polymerase II speed: a key player in controlling and adapting transcriptome composition
Muniz, L., Nicolas, E., & Trouche, D. (2021) · The EMBO Journal · doi:10.15252/embj.2020105740 · Cited by 198
“Indeed, in mammalian cells most studies only consider very long genes to accurately decipher an elongation speed (Saponaro et al , 2014; Cortazar et al , 2019; Gregersen et al , 2019; Hou et al , 2019; Sheridan et al , 2019; Fan et al , 2020).”
Structure of complete Pol II–DSIF–PAF–SPT6 transcription complex reveals RTF1 allosteric activation
Vos, S. M., Farnung, L., Linden, A., Urlaub, H., & Cramer, P. (2020) · Nature Structural & Molecular Biology · doi:10.1038/s41594-020-0437-1 · Cited by 160
Understanding the interplay between CpG island-associated gene promoters and H3K4 methylation
Hughes, A. L., Kelley, J. R., & Klose, R. J. (2020) · Biochimica et Biophysica Acta (BBA) - Gene Regulatory Mechanisms · doi:10.1016/j.bbagrm.2020.194567 · Cited by 139
Two distinct mechanisms of RNA polymerase II elongation stimulation in vivo
Žumer, K., Maier, K. C., Farnung, L., Jaeger, M. G., Rus, P., Winter, G. E., & Cramer, P. (2021) · Molecular Cell · doi:10.1016/j.molcel.2021.05.028 · Cited by 112
Metadata
- Authors
- Hou, L., Wang, Y., Liu, Y., Zhang, N., Shamovsky, I., Nudler, E., Tian, B., & Dynlacht, B. D.
- Affiliations
- NYU Langone Health (US)
- Rutgers New Jersey Medical School (US)
- New York University (US)
- Howard Hughes Medical Institute (US)
- Corresponding author
- Dynlacht, Brian David
- ORCID
- Venue
- Proceedings of the National Academy of Sciences
- Publisher
- National Academy of Sciences
- Published
- 2019-06-28
- Volume
- 116
- Issue
- 29
- Pages
- 14583-14592
- ISSN
- 0027-8424 (ISSN-L)
- 1091-6490
- PMC
- PMC6642404
- OpenAlex
- W2955819370
- Cited by
- 129
- References
- 53
- Citations by year
- 2026: 11 · 2025: 13 · 2024: 20 · 2023: 21 · 2022: 18 · 2021: 22 · 2020: 22 · 2019: 2
- FWCI
- 5.29
- Type
- journal article
- Language
- en
- Open access
- hybrid
- doi.org
- Licence
- Locations
- Proceedings of the National Academy of Sciences (publishedVersion, cc-by-nc-nd)
- PubMed Central (publishedVersion, cc-by-nc-nd)
- PubMed (publishedVersion)
- Funders
- NIH (R01GM122395, R01GM126891)
- Topics
- Life Sciences › Biochemistry, Genetics and Molecular Biology › Molecular Biology › Genomics and Chromatin Dynamics
- Life Sciences › Biochemistry, Genetics and Molecular Biology › Molecular Biology › Chromatin Remodeling and Cancer
- Life Sciences › Biochemistry, Genetics and Molecular Biology › Molecular Biology › RNA Research and Splicing
- Keywords
- Paf1C, RNA polymerase II, transcription elongation, elongation rate, Ser5 phosphorylation, histone H2B ubiquitylation, nascent RNA, early termination, Spt5, Spt6, FACT complex, gene body, conditional gene deletion
- MeSH terms
- Animals, Carrier Proteins, Cell Line, Histones, Promoter Regions, Genetic, RNA Polymerase II, Myoblasts, RNA, Small Interfering, Mice, Ubiquitination, Gene Knockout Techniques, Transcription Elongation, Genetic, Transcription Termination, Genetic, CRISPR-Cas Systems
About these checks
Registry, retraction, Cites and statistics results are computed, not judged, with one exception: a printed reference that no index lists is read once by a model before it counts as a citation error. Claims are extracted by a model and kept only when their quote appears verbatim in the text; each cited source is then checked, with a model’s help, for whether it says what the claim relies on. Those verdicts can be wrong — read the claim’s quote and the cited source before relying on one.
Statistics and arithmetic are recomputed, not judged.
Confidence bands are shown only for fields calibrated on our annotated test set. None is calibrated yet, so no band is shown.
What counts as a claim ›How we measure confidence ›How we check this ›
Are you an author, or do you see a problem with this page? Request a review
