

The DOI matches its Crossref record; 41 of the 44 references it cites were found in a registry or an index.
Universals and variations in moral decisions made in 42 countries by 70,000 participants
Open accessAbstract
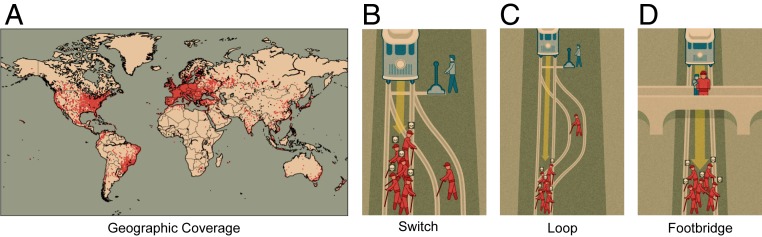
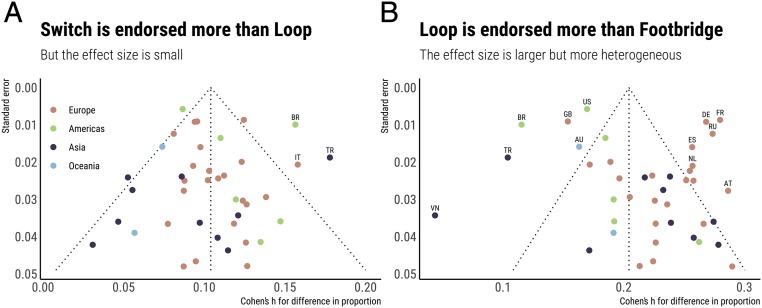
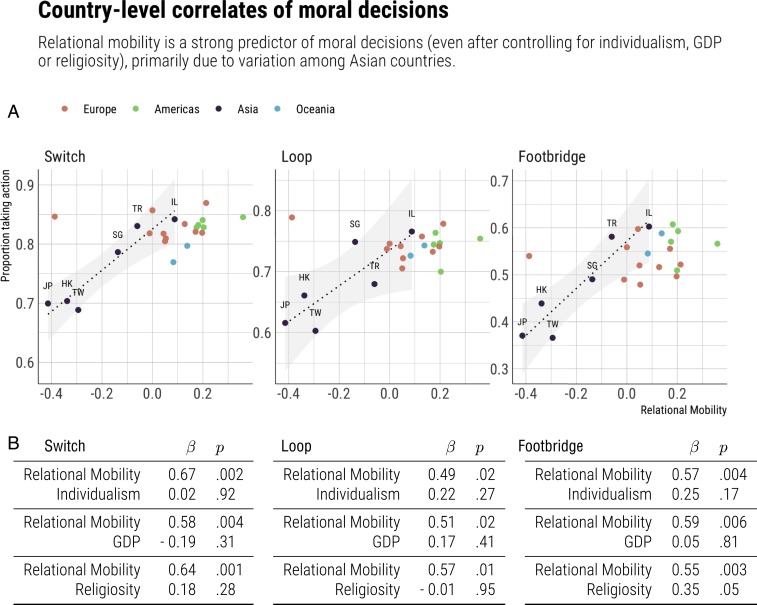
When do people find it acceptable to sacrifice one life to save many? Cross-cultural studies suggested a complex pattern of universals and variations in the way people approach this question, but data were often based on small samples from a small number of countries outside of the Western world. Here we analyze responses to three sacrificial dilemmas by 70,000 participants in 10 languages and 42 countries. In every country, the three dilemmas displayed the same qualitative ordering of sacrifice acceptability, suggesting that this ordering is best explained by basic cognitive processes rather than cultural norms. The quantitative acceptability of each sacrifice, however, showed substantial country-level variations. We show that low relational mobility (where people are more cautious about not alienating their current social partners) is strongly associated with the rejection of sacrifices for the greater good (especially for Eastern countries), which may be explained by the signaling value of this rejection. We make our dataset fully available as a public resource for researchers studying universals and variations in human morality.
Overview
The claims and statistics of this paper haven’t been checked yet.
Run the check — free, no account needed. It reads the open-access text and checks the sources it cites.
Integrity signals
Registry
Cites
Statistics
Figures

Verification
Claims the paper makes
The claims and statistics of this paper haven’t been checked yet.
Run the check — free, no account needed. It reads the open-access text and checks the sources it cites.
Claims other papers make about this one
Each is checked against this paper’s own text: does it say what the citing paper says it does?
In the citing paper
“Ethics should ensure the design of AI technologies for human flourishing around the world [192,193], but this is a very complex matter given that, as the work of Awad et al. [194,195] clearly demonstrates, universally valid and accepted ethical principles do not exist.”
From The sustainability of artificial intelligence: an urbanistic viewpoint from the lens of smart and sustainable cities (2020) · cites this paper as [195]
Self-check
Percentages, sums and reported differences re-computed from the paper’s own numbers.
The self-check needs the paper’s full text.
Citations
Cites
“Economic man” in cross-cultural perspective: behavioral experiments in 15 small-scale societies
Henrich, J., Boyd, R., Bowles, S., Camerer, C., Fehr, E., Gintis, H., McElreath, R., Alvard, M., Barr, A., Ensminger, J., et al. (2005) · Behavioral and Brain Sciences · doi:10.1017/s0140525x05000142 · Cited by 1,898
Awad, E., Dsouza, S., Kim, R., Schulz, J., Henrich, J., Shariff, A., Bonnefon, J.-F., & Rahwan, I. (2018) · Nature · doi:10.1038/s41586-018-0637-6 · Cited by 1,859 · cited 1×
“While the Moral Machine website was primarily designed to explore the ethics of self-driving cars (13), it also offered a “Classic” mode, where visitors made decisions about the traditional Switch, Loop, and Footbridge variants of the trolley problem; these are the data that we report in this article.”
Self-citationThe Problem of Abortion and the Doctrine of the Double Effect
Foot, P. (2002) · Oxford University Press eBooks · doi:10.1093/0199252866.003.0002 · Cited by 1,374
Thomson, J. J. (1985) · The Yale Law Journal · doi:10.2307/796133 · Cited by 1,315
The Role of Conscious Reasoning and Intuition in Moral Judgment
Cushman, F. A., Young, L., & HAUSER, M. D. (2006) · Psychological Science · doi:10.1111/j.1467-9280.2006.01834.x · Cited by 1,061
Many Labs 2: Investigating variation in replicability across samples and settings
Klein, R. A., Vianello, M., Hasselman, F., Adams, B. G., Adams, R. B., Alper, S., Aveyard, M., Axt, J. R., Babalola, M. T., Bahník, Š., et al. (2018) · Advances in Methods and Practices in Psychological Science · doi:10.1177/2515245918810225 · Cited by 944
Universal moral grammar: theory, evidence and the future
Mikhail, J. (2007) · Trends in Cognitive Sciences · doi:10.1016/j.tics.2006.12.007 · Cited by 923
Pushing moral buttons: The interaction between personal force and intention in moral judgment
Greene, J. D., Cushman, F. A., Stewart, L. E., Kelly Lowenberg, C., Nystrom, L. E., & Cohen, J. D. (2009) · Cognition · doi:10.1016/j.cognition.2009.02.001 · Cited by 677
A Dissociation Between Moral Judgments and Justifications
HAUSER, M., CUSHMAN, F., YOUNG, L., KANG‐XING JIN, R., & MIKHAIL, J. (2007) · Mind & Language · doi:10.1111/j.1468-0017.2006.00297.x · Cited by 666
16. The Problem of Abortion and the Doctrine of the Double Effect
Foot, P. (1994) · Fordham University Press eBooks · doi:10.1515/9780823295968-019 · Cited by 454
Cited by
Sorted by citations
Items 201–257 of 257
Thinking of Autonomous Vehicles Ideally
Chiodo, S. (2023) · Studies in applied philosophy, epistemology and rational ethics · doi:10.1007/978-3-031-39991-6_8
Considering the role of self-interest in moral disciplining
Moon, J. W. (2023) · Behavioral and Brain Sciences · doi:10.1017/s0140525x23000432
Beyond behavior: the penitence congruity effect among children
Paruzel‐Czachura, M., & Domurat, A. (2023) · Current Psychology · doi:10.1007/s12144-023-05270-0
Don''t Think it''s Just Entertainment
Esch, M. (2023) · Edition Medienwissenschaft · doi:10.14361/9783839466070-019
The puzzle of wrongless injustice: Reflections on Kürthy and Sousa
Royzman, E. B., & Borislow, S. H. (2023) · Cognition · doi:10.1016/j.cognition.2023.105686
Justice-making institutionsPreprint
Sznycer, D., & Chen, H. (2023) · PsyArXiv (OSF Preprints) · doi:10.31234/osf.io/6cen9
Learning from Examples. The Human and the Non-Human
Beran, O. (2023) · Distinctio · doi:10.56550/d.2.2.3
A Cross-Cultural Study of Everyday Moral ExperiencesPreprint
Murray, S. F., Jiménez‐Leal, W., Amaya, S., Silverstein, P., Kekecs, Z., Chartier, C. R., Wan, M. F., Blackall, T. L., Salvador, C. E., Pfuhl, G., et al. (2024) · PsyArXiv (OSF Preprints) · doi:10.31234/osf.io/jktnv
Robustness and Cultural Difference on Identifiable Victim Effect
Yamamoto, K. (2024) · Lecture notes in computer science · doi:10.1007/978-3-031-55245-8_10
Chinese Moral Psychology in Engineering Ethics Education Assessment
Clancy, R. F. (2024) · Synthesis lectures on engineers, technology, and society · doi:10.1007/978-3-031-53464-5_5
Exploring the Mechanism of Moral Machine Experiment Review
Qiao, Y. (2024) · Journal of Education Humanities and Social Sciences · doi:10.54097/4gymdc34
Effects of Individual Priorities on Ethical Decisions in Traffic Use of Artificial Intelligence
Tunçay, G. Y., Göl, İ., & Çobanoğlu, N. (2024) · International Journal of Automotive Science And Technology · doi:10.30939/ijastech..1415833
Kuan, T. (2023) · Social Analysis · doi:10.3167/sa.2023.670309
Effects of personal force and physical contact on moral decision-making: A replicationPreprint
Lynds, T. M., & Mackinnon, S. P. (2024) · doi:10.31234/osf.io/dca65
Xu, X., & Plaks, J. E. (2024) · Review of General Psychology · doi:10.1177/10892680241270208
Choosing between bad and worse: investigating choice in moral dilemmas through the lens of control
Shivnekar, R. V., & Srinivasan, N. (2024) · Cognitive Processing · doi:10.1007/s10339-024-01226-9
Oxytocin salvages context-specific hyperaltruistic preference through moral framingPreprint
Zhang, H., Ni, Y., & Li, J. (2024) · eLife · doi:10.7554/elife.102756.1
A logical approach in autonomous vehicle ethics: the skeptical reasoning in dilemma
Yoo, D.-H. (2024) · AI and Ethics · doi:10.1007/s43681-024-00616-1
Ethische Dimensionen der Digitalwirtschaft
Frischhut, M. (2024) · Springer eBooks · doi:10.1007/978-3-658-45724-2_5
Oltay, I., Eser, H. Y., & Conway, P. J. (2025) · PsyArXiv (OSF Preprints) · doi:10.31234/osf.io/r3qu7_v2
Permissible Harm for the Greater Good: A Study of Two Moral AttitudesPreprint
Rosas, A. (2025) · SSRN Electronic Journal · doi:10.2139/ssrn.5218827
Delegating moral dilemmas in autonomous vehicles evidence from an online experiment in China
Gao, Y., Blayac, T., & Willinger, M. (2025) · Transport Policy · doi:10.1016/j.tranpol.2025.04.017
Blameocracy: Causal Attribution in Political CommunicationPreprint
Bilotta, F., Binetti, A., & Manferdini, G. (2025) · SSRN Electronic Journal · doi:10.2139/ssrn.5211231
Impact of English L2 Exposure on Lexical Abilities of the Majority Language in School-Age Children
Hu, C. (2025) · English Teaching & Learning · doi:10.1007/s42321-025-00210-6
Construida, imprevisible y plural: afirmaciones fundamentales para analizar la vida social
Albornoz, J. J. (2022) · Revista Mexicana de Sociología · doi:10.22201/iis.01882503p.2022.1.60224
Moral Coherentism in the Age of Artificial Intelligence
Muntean, I. L. (2025) · American Philosophical Quarterly · doi:10.5406/21521123.62.3.06
McKee, P. C., Boulhadi, K., Weymouth, H., & Nadelhoffer, T. (2026) · Philosophical Psychology · doi:10.1080/09515089.2026.2655817
Oxytocin restores context-specific hyperaltruistic preferencePreprint
Zhang, H., Ni, Y., & Li, J. (2025) · eLife · doi:10.7554/elife.102756.2
Intuitions about justice are a consistent part of human nature across cultures and millennia
Sznycer, D., & Patrick, C. (2022) · doi:10.64628/aai.mmdq54e6u
Evaluating CloudResearch’s Approved Group as a Solution for Problematic Data Quality on MTurkPreprint
Moss, A. J., Litman, L., Jaffe, S. N., Rosenzweig, C., & Hauser, D. (2022) · OSF Preprints (OSF Preprints)
Maksimenko, V., Pandey, H., Li, X., & Bansal, P. (2025) · AI and Ethics · doi:10.1007/s43681-025-00856-9
Time as a Moral LensPreprint
Erkut, H., & Michailidou, G. (2026) · SSRN Electronic Journal · doi:10.2139/ssrn.6080629
Li, M. (2026) · Journal of Urban Design · doi:10.1080/13574809.2026.2619145
Takeshita, M. (2026) · Springer eBooks · doi:10.1007/978-3-031-70581-6_204-1
Video games as stimuli in neuroimaging studies: a minireview
Blank, I. B., Klucharev, V. A., & Shestakova, A. N. (2026) · Frontiers in Human Neuroscience · doi:10.3389/fnhum.2026.1687121
Yazıcı, S., Yavas, E., Çakır, F. S., & Şenkaya, A. C. (2026) · Ethics & Behavior · doi:10.1080/10508422.2026.2648634
Who Cares More About Having Moral Traits? Evidence From 67 Countries
Paruzel‐Czachura, M., & McHugh, C. (2026) · Journal of Cross-Cultural Psychology · doi:10.1177/00220221261439284
The Origin of WEIRD Essentialism
Artinian, H., & Morgan, T. J. H. (2026) · Theory and history in the human and social sciences · doi:10.1007/978-3-032-11918-6_7
Sharavdorj, E., Bart, V. K. E., Rieger, M., Boldbaatar, E., & Munkhnasan, D. (2023) · OSF Preprints (OSF Preprints)
Köbis, N., Rahwan, Z., Rilla, R., Supriyatno, B., Bersch, C., Ajaj, T., Bonnefon, J., & Rahwan, I. (2025) · MPG.PuRe (Max Planck Society)
Self-citationAristotle’s intuitionist approach to morality guides a new direction in moral psychology
Amormino, P., Law, K. F., & Inbar, Y. (2026) · Humanities and Social Sciences Communications · doi:10.1057/s41599-026-07942-1
Kinosada, Y., Furukawa, Y., Wakai, T., & Nakashima, K. (2026) · Asian Journal Of Social Psychology · doi:10.1111/ajsp.70099
The Alignment Target Problem: Divergent Moral Judgments of Humans, AI Systems, and Their Designers
Chen, B. M., & Xie, X. (2026) · ACM Conference on Fairness, Accountability, and Transparency (FAccT) · doi:10.1145/3805689.3812297
Opportunities and risks of big data for the methods and culture of psychological science
Ibasco, G. C., Götz, F. M., Clark, L., & Tracy, J. L. (2026) · Nature Reviews Psychology · doi:10.1038/s44159-026-00603-9 · Cited by 1
Can arguments save armchair philosophy?
Wu, S. (2026) · Synthese · doi:10.1007/s11229-026-05766-9
Hazrati, M., & Borhani, K. (2026) · Discover Psychology · doi:10.1007/s44202-026-00881-7
Certainty and Disagreement in the Moral Domain: A Moral Dilemmas PerspectivePreprint
Rosas, A. (2026) · Qeios · doi:10.32388/kinrvo
Modeling the Social and Normative Context of Human–Agent Interactions
Vázquez, M., Güneş, H., Williams, T., & Jackson, R. B. (2026) · Cambridge University Press eBooks · doi:10.1017/9781108872225.013
Fiebrink, R., Gillies, M. F. P., & Ramos, G. (2026) · Cambridge University Press eBooks · doi:10.1017/9781108872225.010
Cultural Orientation Shapes Moral Judgments of Autonomous Vehicle Dilemmas
Sukan, E. I., Bovesi, A., & Guidi, S. (2026) · European Conference on Cognitive Ergonomics · doi:10.1145/3822301.3822337
D’Ottone, S., Tumino, M., & Conway, P. J. (2026) · Political Psychology · doi:10.1111/pops.70198
The moral dilemma of autonomous vehicles: Prioritizing pedestrian protection
Rosas, A., & Lui, Z. (2026) · Transportation Research Interdisciplinary Perspectives · doi:10.1016/j.trip.2026.102299
Shi, L., Shi, H., Lv, B., Guo, F., & Liu, P. (2026) · International Journal of Human-Computer Interaction · doi:10.1080/10447318.2026.2750754
Han, Z., & Mizumoto, M. (2026) · Research Square · doi:10.21203/rs.3.rs-10654027/v1
Metadata
- Authors
- Awad, E., Dsouza, S., Shariff, A., Rahwan, I., & Bonnefon, J.-F.
- Affiliations
- University of Exeter (GB)
- MIT Media Lab (US)
- University of British Columbia (CA)
- Max Planck Institute for Human Development (DE)
- Centre National de la Recherche Scientifique (FR)
- Corresponding author
- Awad, Edmond
- Shariff, Azim
- Rahwan, Iyad
- Bonnefon, Jean-François
- Venue
- Proceedings of the National Academy of Sciences
- Publisher
- National Academy of Sciences
- Published
- 2020-01-21
- Volume
- 117
- Issue
- 5
- Pages
- 2332-2337
- ISSN
- 0027-8424 (ISSN-L)
- 1091-6490
- PMC
- PMC7007553
- OpenAlex
- W3000950628
- Cited by
- 261
- References
- 44
- Citations by year
- 2026: 25 · 2025: 36 · 2024: 44 · 2023: 60 · 2022: 41 · 2021: 37 · 2020: 17
- FWCI
- 20.81
- Type
- journal article
- Language
- en
- Open access
- hybrid
- doi.org
- Licence
- Locations
- Proceedings of the National Academy of Sciences (publishedVersion, cc-by)
- Europe PMC (PubMed Central) (publishedVersion, cc-by)
- PubMed Central (publishedVersion, cc-by)
- PubMed (publishedVersion)
- Open Research Exeter (University of Exeter) (publishedVersion, cc-by)
- HAL (submittedVersion, cc-by)
- DSpace@MIT (Massachusetts Institute of Technology) (submittedVersion, cc-by-nc)
- Figshare (submittedVersion, cc-by)
- Toulouse 1 Capitole Publications (Université Toulouse I Capitole) (submittedVersion)
- MPG.PuRe (Max Planck Society) (submittedVersion, other-oa)
- Funders
- Agence Nationale de la Recherche (ANR-17-EURE-0010, ANR-19-P3IA-0004)
- Topics
- Life Sciences › Neuroscience › Cognitive Neuroscience › Psychology of Moral and Emotional Judgment
- Social Sciences › Psychology › Social Psychology › Cultural Differences and Values
- Social Sciences › Economics, Econometrics and Finance › Economics and Econometrics › Experimental Behavioral Economics Studies
- Keywords
- ethical decision-making, sacrificial dilemmas, trolley problem, moral intuitions, cross-cultural variation, relational mobility, signaling, East-West differences
- MeSH terms
- Cognition, Cross-Cultural Comparison, Decision Making, Humans, Morals, Surveys and Questionnaires, Social Mobility, Ethical Theory
About these checks
Registry, retraction, Cites and statistics results are computed, not judged, with one exception: a printed reference that no index lists is read once by a model before it counts as a citation error. Claims are extracted by a model and kept only when their quote appears verbatim in the text; each cited source is then checked, with a model’s help, for whether it says what the claim relies on. Those verdicts can be wrong — read the claim’s quote and the cited source before relying on one.
Statistics and arithmetic are recomputed, not judged.
Confidence bands are shown only for fields calibrated on our annotated test set. None is calibrated yet, so no band is shown.
What counts as a claim ›How we measure confidence ›How we check this ›
Are you an author, or do you see a problem with this page? Request a review
