

The DOI matches its Crossref record; 50 of the 50 references it cites were found in a registry or an index.
Spatial transcriptome profiling by MERFISH reveals subcellular RNA compartmentalization and cell cycle-dependent gene expression
Open accessAbstract
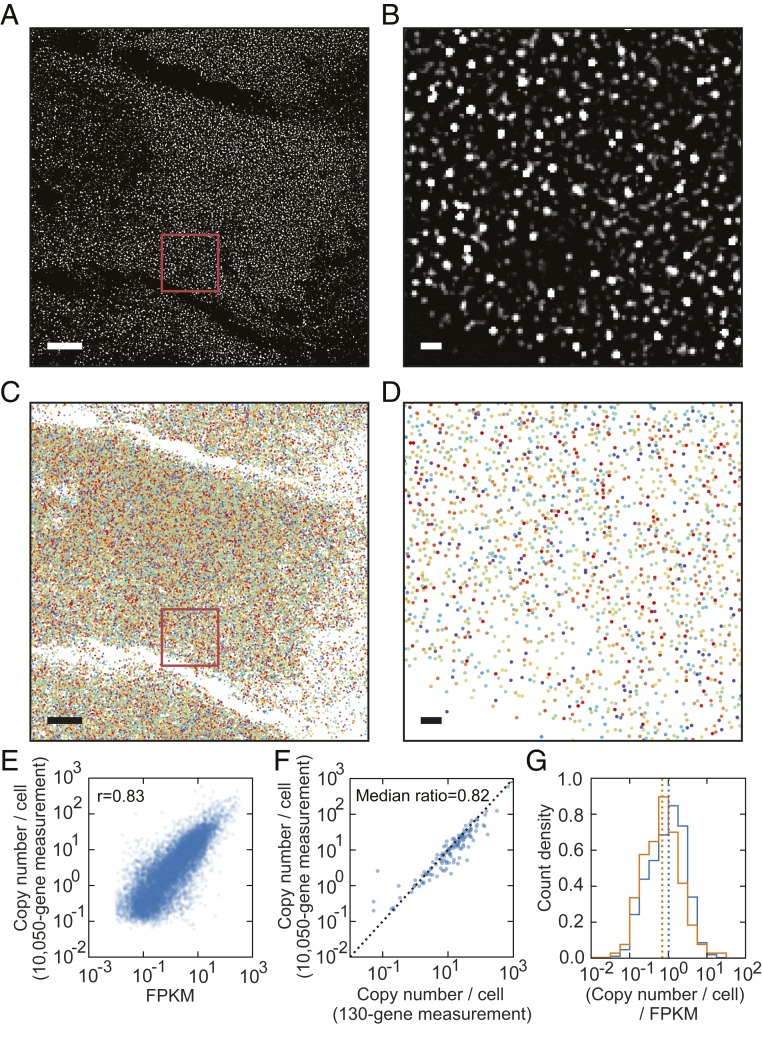
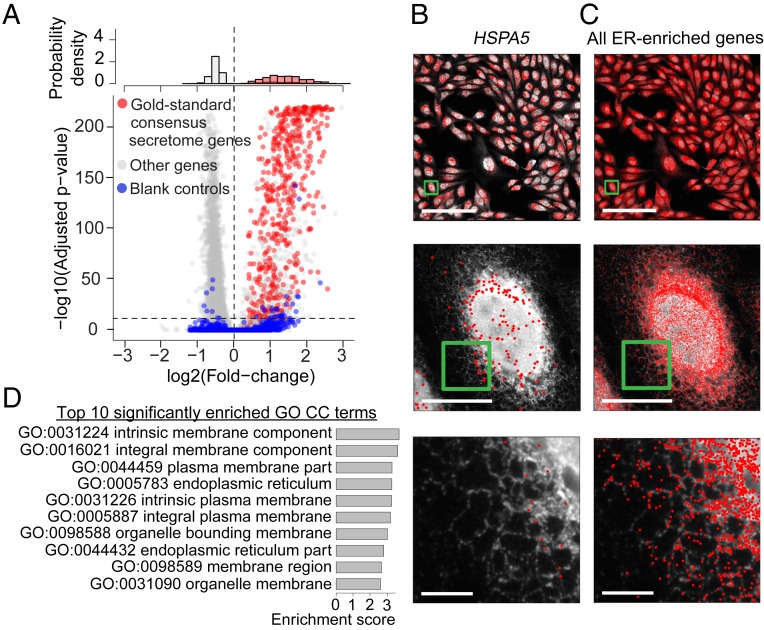
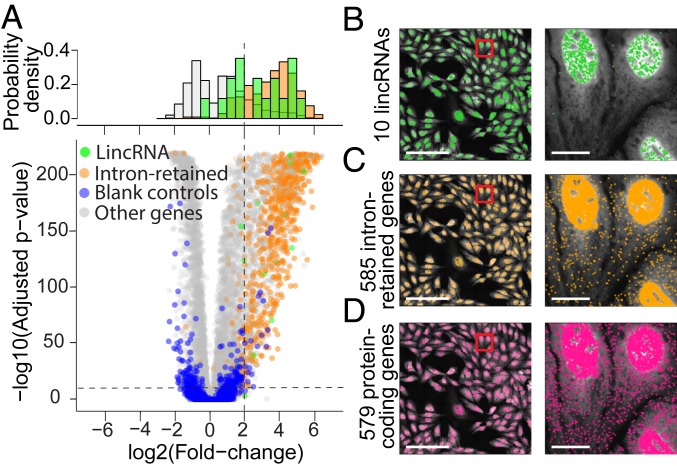
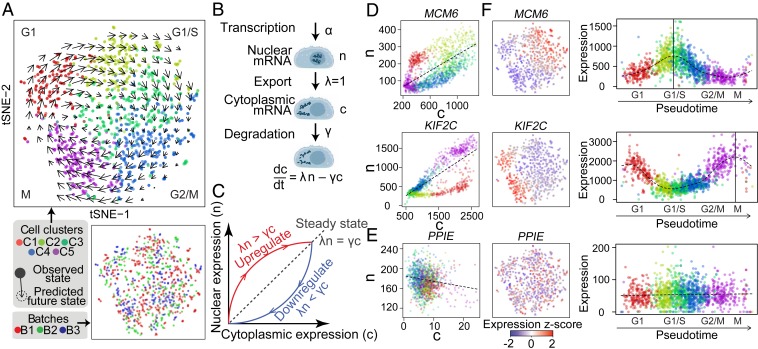
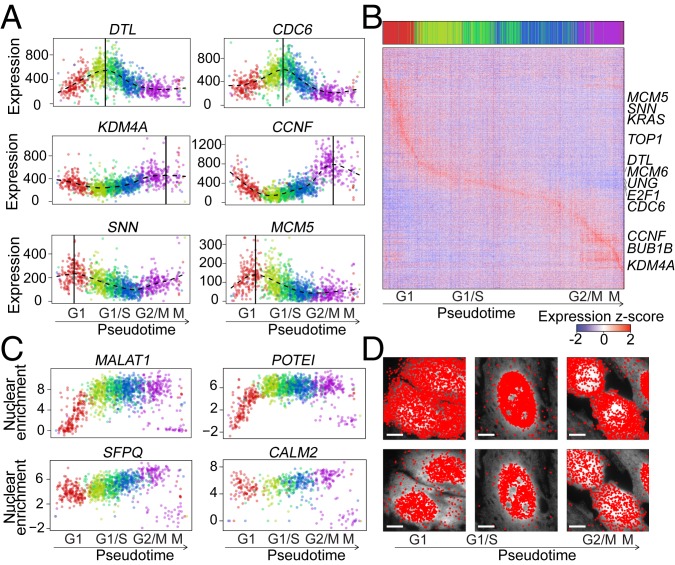
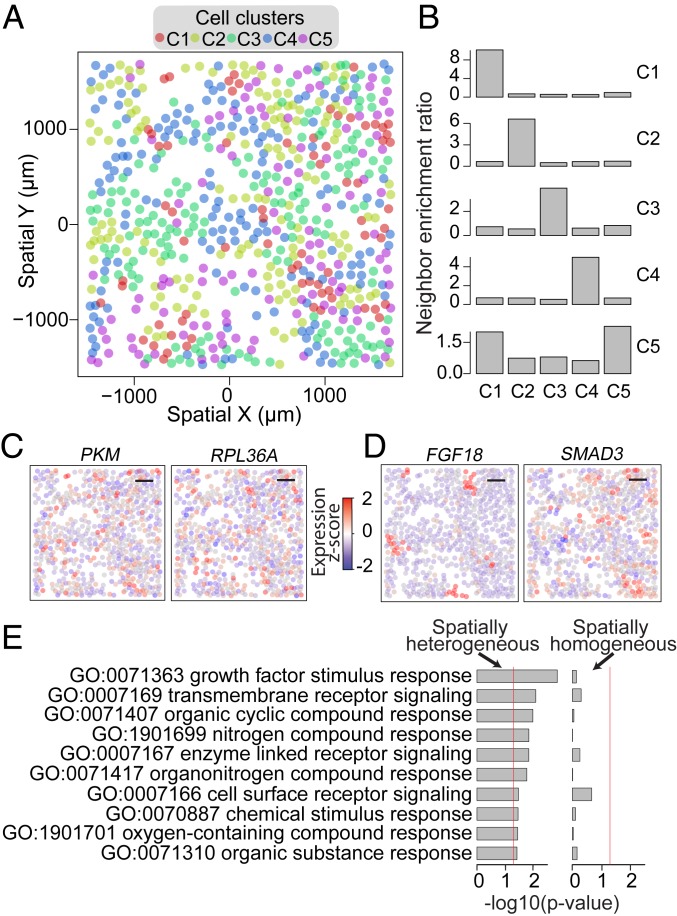
The expression profiles and spatial distributions of RNAs regulate many cellular functions. Image-based transcriptomic approaches provide powerful means to measure both expression and spatial information of RNAs in individual cells within their native environment. Among these approaches, multiplexed error-robust fluorescence in situ hybridization (MERFISH) has achieved spatially resolved RNA quantification at transcriptome scale by massively multiplexing single-molecule FISH measurements. Here, we increased the gene throughput of MERFISH and demonstrated simultaneous measurements of RNA transcripts from ∼10,000 genes in individual cells with ∼80% detection efficiency and ∼4% misidentification rate. We combined MERFISH with cellular structure imaging to determine subcellular compartmentalization of RNAs. We validated this approach by showing enrichment of secretome transcripts at the endoplasmic reticulum, and further revealed enrichment of long noncoding RNAs, RNAs with retained introns, and a subgroup of protein-coding mRNAs in the cell nucleus. Leveraging spatially resolved RNA profiling, we developed an approach to determine RNA velocity in situ using the balance of nuclear versus cytoplasmic RNA counts. We applied this approach to infer pseudotime ordering of cells and identified cells at different cell-cycle states, revealing ∼1,600 genes with putative cell cycle-dependent expression and a gradual transcription profile change as cells progress through cell-cycle stages. Our analysis further revealed cell cycle-dependent and cell cycle-independent spatial heterogeneity of transcriptionally distinct cells. We envision that the ability to perform spatially resolved, genome-wide RNA profiling with high detection efficiency and accuracy by MERFISH could help address a wide array of questions ranging from the regulation of gene expression in cells to the development of cell fate and organization in tissues.
Overview
The claims and statistics of this paper haven’t been checked yet.
Run the check — free, no account needed. It reads the open-access text and checks the sources it cites.
Integrity signals
Registry
Cites
Statistics
Figures
Verification
Claims the paper makes
The claims and statistics of this paper haven’t been checked yet.
Run the check — free, no account needed. It reads the open-access text and checks the sources it cites.
Claims other papers make about this one
Each is checked against this paper’s own text: does it say what the citing paper says it does?
In the citing paper
“Finer spatial resolution can be achieved by super-resolution imaging (Lubeck and Cai, 2012) or isotropic physical expansion of tissue prior to imaging (Chen et al., 2015a; Xia et al., 2019).”
From Single-Cell Sequencing of Brain Cell Transcriptomes and Epigenomes (2021) · cites this paper as Xia et al., 2019
Self-check
Percentages, sums and reported differences re-computed from the paper’s own numbers.
The self-check needs the paper’s full text.
Citations
Cites
Subramanian, A., Tamayo, P., Mootha, V. K., Mukherjee, S., Ebert, B. L., Gillette, M. A., Paulovich, A., Pomeroy, S. L., Golub, T. R., Lander, E. S., et al. (2005) · Proceedings of the National Academy of Sciences · doi:10.1073/pnas.0506580102 · Cited by 53,625
Fast unfolding of communities in large networks
Blondel, V. D., Guillaume, J.-L., Lambiotte, R., & Lefebvre, E. (2008) · Journal of Statistical Mechanics: Theory and Experiment · doi:10.1088/1742-5468/2008/10/p10008 · Cited by 21,424
SignalP 4.0: discriminating signal peptides from transmembrane regions
Petersen, T. N., Brunak, S., von Heijne, G., & Nielsen, H. (2011) · Nature Methods · doi:10.1038/nmeth.1701 · Cited by 8,847
NOTES ON CONTINUOUS STOCHASTIC PHENOMENA
MORAN, P. A. P. (1950) · Biometrika · doi:10.1093/biomet/37.1-2.17 · Cited by 8,622
Derrien, T., Johnson, R., Bussotti, G., Tanzer, A., Djebali, S., Tilgner, H., Guernec, G., Martin, D., Merkel, A., Knowles, D. G., et al. (2012) · Genome Research · doi:10.1101/gr.132159.111 · Cited by 5,061
La Manno, G., Soldatov, R., Zeisel, A., Braun, E., Hochgerner, H., Petukhov, V., Lidschreiber, K., Kastriti, M. E., Lönnerberg, P., Furlan, A., et al. (2018) · Nature · doi:10.1038/s41586-018-0414-6 · Cited by 4,118
Self-citationVisualization and analysis of gene expression in tissue sections by spatial transcriptomics
Ståhl, P. L., Salmén, F., Vickovic, S., Lundmark, A., Navarro, J. F., Magnusson, J., Giacomello, S., Asp, M., Westholm, J. O., Huss, M., et al. (2016) · Science · doi:10.1126/science.aaf2403 · Cited by 3,834
Spatially resolved, highly multiplexed RNA profiling in single cells
Chen, K. H., Boettiger, A. N., Moffitt, J. R., Wang, S., & Zhuang, X. (2015) · Science · doi:10.1126/science.aaa6090 · Cited by 2,969
Self-citationA Combined Transmembrane Topology and Signal Peptide Prediction Method
Käll, L., Krogh, A., & Sonnhammer, E. L. L. (2004) · Journal of Molecular Biology · doi:10.1016/j.jmb.2004.03.016 · Cited by 2,450
Slide-seq: A scalable technology for measuring genome-wide expression at high spatial resolution
Rodriques, S. G., Stickels, R. R., Goeva, A., Martin, C. A., Murray, E., Vanderburg, C. R., Welch, J., Chen, L. M., Chen, F., & Macosko, E. Z. (2019) · Science · doi:10.1126/science.aaw1219 · Cited by 2,424
Cited by
Generalizing RNA velocity to transient cell states through dynamical modeling
Bergen, V., Lange, M., Peidli, S., Wolf, F. A., & Theis, F. J. (2020) · Nature Biotechnology · doi:10.1038/s41587-020-0591-3 · Cited by 2,951
Exploring tissue architecture using spatial transcriptomics
Rao, A., Barkley, D., França, G. S., & Yanai, I. (2021) · Nature · doi:10.1038/s41586-021-03634-9 · Cited by 1,700
Methods and applications for single-cell and spatial multi-omics
Vandereyken, K., Sifrim, A., Thienpont, B., & Voet, T. (2023) · Nature Reviews Genetics · doi:10.1038/s41576-023-00580-2 · Cited by 1,244
Museum of spatial transcriptomics
Moses, L., & Pachter, L. (2022) · Nature Methods · doi:10.1038/s41592-022-01409-2 · Cited by 1,255
Museum of Spatial Transcriptomics
Moses, L., & Pachter, L. (2021) · doi:10.1101/2021.05.11.443152 · Cited by 1,255
Metadata
- Authors
- Xia, C., Fan, J., Emanuel, G., Hao, J., & Zhuang, X.
- Affiliations
- Howard Hughes Medical Institute (US)
- Corresponding author
- Zhuang, Xiaowei
- Venue
- Proceedings of the National Academy of Sciences
- Publisher
- National Academy of Sciences
- Published
- 2019-09-09
- Volume
- 116
- Issue
- 39
- Pages
- 19490-19499
- ISSN
- 0027-8424 (ISSN-L)
- 1091-6490
- PMC
- PMC6765259
- OpenAlex
- W2972445800
- Cited by
- 755
- References
- 50
- Citations by year
- 2026: 99 · 2025: 114 · 2024: 141 · 2023: 110 · 2022: 115 · 2021: 105 · 2020: 65 · 2019: 5
- FWCI
- 23.86
- Type
- journal article
- Language
- en
- Open access
- hybrid
- doi.org
- Licence
- Locations
- Proceedings of the National Academy of Sciences (publishedVersion, cc-by-nc-nd)
- Europe PMC (PubMed Central) (publishedVersion, cc-by-nc-nd)
- PubMed Central (publishedVersion, cc-by-nc-nd)
- PubMed (publishedVersion)
- Funders
- HHS | NIH | National Institute of Mental Health (R01MH113094)
- Howard Hughes Medical Institute (HHMI)
- HHS | National Institutes of Health (K00CA222750)
- Topics
- Life Sciences › Biochemistry, Genetics and Molecular Biology › Molecular Biology › Single-cell and spatial transcriptomics
- Life Sciences › Biochemistry, Genetics and Molecular Biology › Molecular Biology › RNA Research and Splicing
- Life Sciences › Biochemistry, Genetics and Molecular Biology › Biophysics › Advanced Fluorescence Microscopy Techniques
- Keywords
- MERFISH, spatial transcriptomics, cell cycle-dependent gene expression, RNA velocity, nuclear RNA, long non-coding RNA, intron retention, secretome, endoplasmic reticulum, single-molecule FISH
- MeSH terms
- Cell Division, Gene Expression Regulation, Humans, RNA, Messenger, In Situ Hybridization, Fluorescence, Genes, cdc, Gene Expression Profiling, Intracellular Space, Cell Line, Tumor, Single-Cell Analysis, Transcriptome, RNA, Long Noncoding
About these checks
Registry, retraction, Cites and statistics results are computed, not judged, with one exception: a printed reference that no index lists is read once by a model before it counts as a citation error. Claims are extracted by a model and kept only when their quote appears verbatim in the text; each cited source is then checked, with a model’s help, for whether it says what the claim relies on. Those verdicts can be wrong — read the claim’s quote and the cited source before relying on one.
Statistics and arithmetic are recomputed, not judged.
Confidence bands are shown only for fields calibrated on our annotated test set. None is calibrated yet, so no band is shown.
What counts as a claim ›How we measure confidence ›How we check this ›
Are you an author, or do you see a problem with this page? Request a review
How to cite
Cite CoChat for the checks on this page, and the paper for its own findings.
- This page
- CoChat. (2026). Citation check: Spatial transcriptome profiling by MERFISH reveals subcellular RNA compartmentalization and cell cycle-dependent gene expression. https://app.cochat.ai/papers/10.1073/pnas.1912459116
- The paper
- Xia, C., Fan, J., Emanuel, G., Hao, J., & Zhuang, X. (2019). Spatial transcriptome profiling by MERFISH reveals subcellular RNA compartmentalization and cell cycle-dependent gene expression. Proceedings of the National Academy of Sciences. https://doi.org/10.1073/pnas.1912459116
Data sources
Bibliographic data: Semantic Scholar, OpenAlex, Crossref.
Contains information from the Semantic Scholar Academic Graph Datasets, made available under the ODC Attribution License (ODC-BY 1.0).
Semantic Scholar’s data is described in: Kinney, R., et al. (2023). The Semantic Scholar Open Data Platform. arXiv:2301.10140.
