

The DOI matches its Crossref record; 72 of the 72 references it cites were found in a registry or an index.
The 2-Cys Peroxiredoxin Alkyl Hydroperoxide Reductase C Binds Heme and Participates in Its Intracellular Availability in Streptococcus agalactiae
Abstract
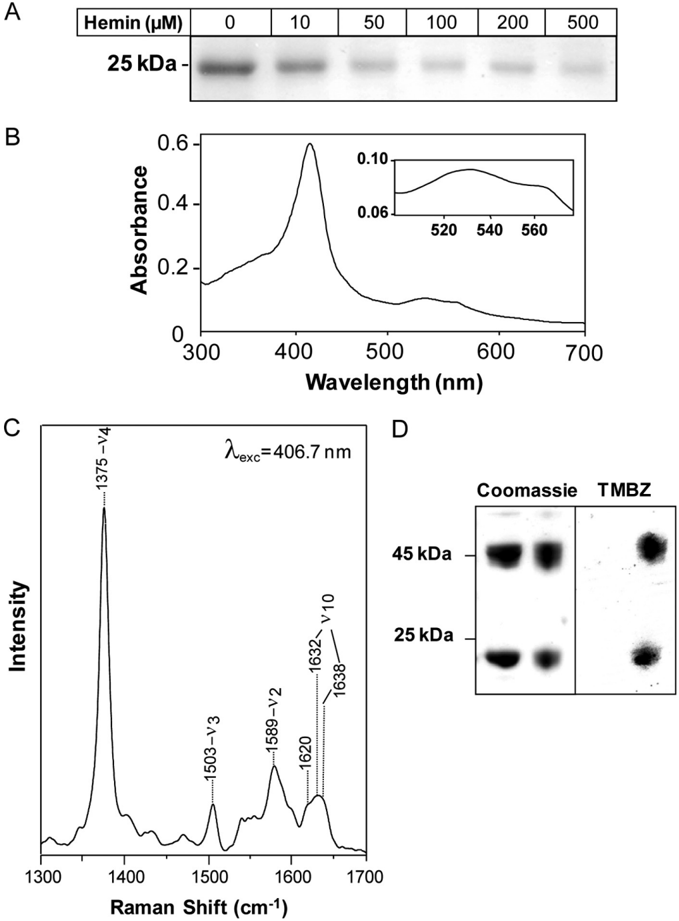
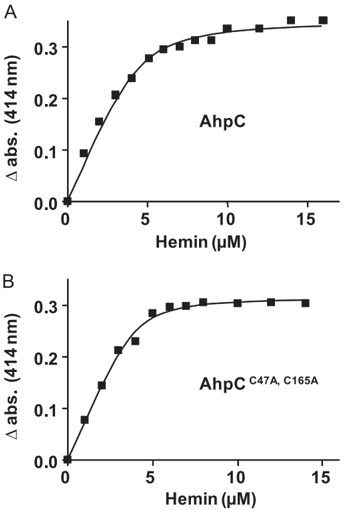
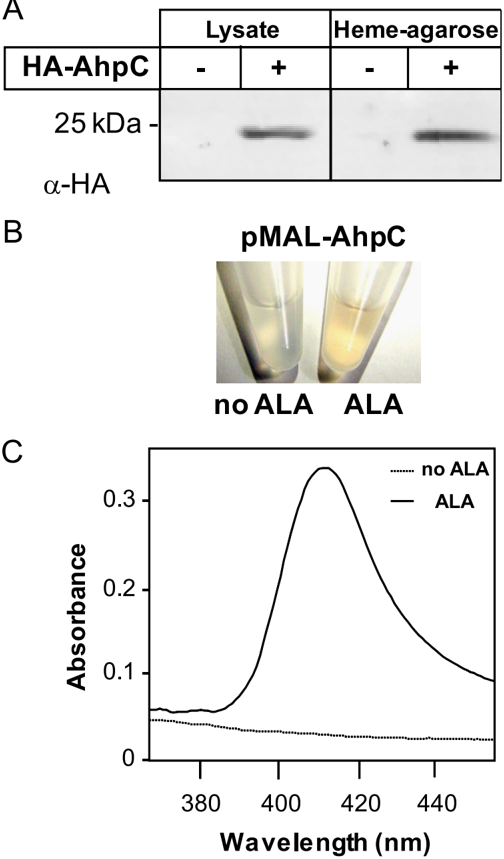
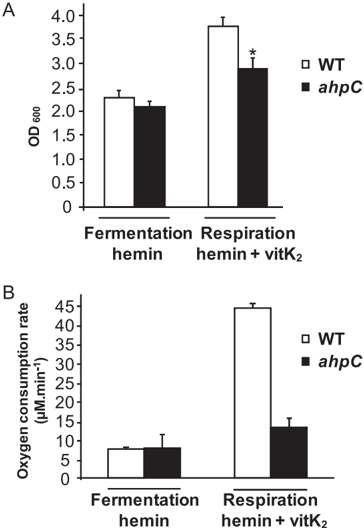
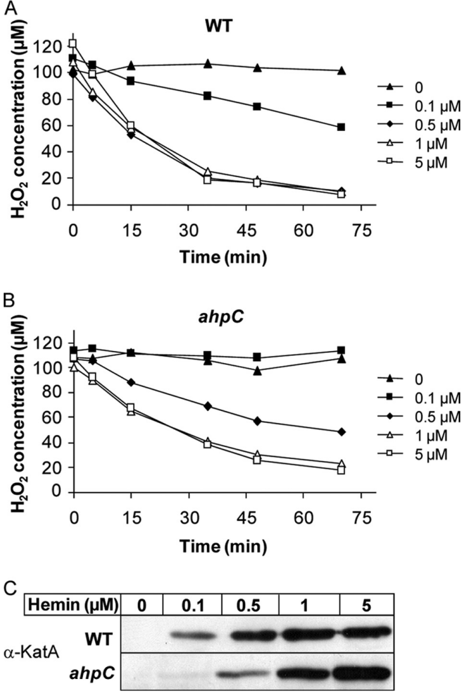
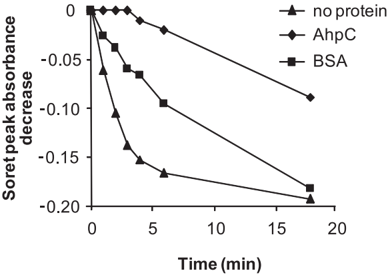
Heme is a redox-reactive molecule with vital and complex roles in bacterial metabolism, survival, and virulence. However, few intracellular heme partners were identified to date and are not well conserved in bacteria. The opportunistic pathogen Streptococcus agalactiae (group B Streptococcus) is a heme auxotroph, which acquires exogenous heme to activate an aerobic respiratory chain. We identified the alkyl hydroperoxide reductase AhpC, a member of the highly conserved thiol-dependent 2-Cys peroxiredoxins, as a heme-binding protein. AhpC binds hemin with a K(d) of 0.5 microm and a 1:1 stoichiometry. Mutagenesis of cysteines revealed that hemin binding is dissociable from catalytic activity and multimerization. AhpC reductase activity was unchanged upon interaction with heme in vitro and in vivo. A group B Streptococcus ahpC mutant displayed attenuation of two heme-dependent functions, respiration and activity of a heterologous catalase, suggesting a role for AhpC in heme intracellular fate. In support of this hypothesis, AhpC-bound hemin was protected from chemical degradation in vitro. Our results reveal for the first time a role for AhpC as a heme-binding protein.
Overview
The claims and statistics of this paper haven’t been checked yet.
Run the check — free, no account needed. It reads the open-access text and checks the sources it cites.
Integrity signals
Registry
Cites
Statistics
Figures
Verification
Claims the paper makes
The claims and statistics of this paper haven’t been checked yet.
Run the check — free, no account needed. It reads the open-access text and checks the sources it cites.
Claims other papers make about this one
Each is checked against this paper’s own text: does it say what the citing paper says it does?
The cited source says what the claim attributes to it.
In the citing paper
“It is thought that instead, these proteins function to store heme and promote its utilization (54, 127).”
From Overcoming the Heme Paradox: Heme Toxicity and Tolerance in Bacterial Pathogens (2010) · cites this paper as [54]
In the citing paper
“The mutation of either of these proteins, however, does not result in increased heme sensitivity (54, 127).”
From Overcoming the Heme Paradox: Heme Toxicity and Tolerance in Bacterial Pathogens (2010) · cites this paper as [54]
In the citing paper
“AhpC is a 2-Cys peroxiredoxin family protein, but its peroxidase activity does not depend on its heme-binding status (54).”
From Overcoming the Heme Paradox: Heme Toxicity and Tolerance in Bacterial Pathogens (2010) · cites this paper as [54]
In the citing paper
“Other cytoplasmic proteins such as AhpC in S. agalactiae and HutZ in V. cholerae also bind heme (54, 127).”
From Overcoming the Heme Paradox: Heme Toxicity and Tolerance in Bacterial Pathogens (2010) · cites this paper as [54]
Self-check
Percentages, sums and reported differences re-computed from the paper’s own numbers.
The self-check needs the paper’s full text.
Citations
Cites
Cleavage of Structural Proteins during the Assembly of the Head of Bacteriophage T4
LAEMMLI, U. K. (1970) · Nature · doi:10.1038/227680a0 · Cited by 249,961
Raza, H., John, A., & Nemmar, A. (2013) · Cellular Physiology and Biochemistry · doi:10.1159/000350087 · Cited by 47,221
Mechanisms for copper acquisition, distribution and regulation
Kim, B.-E., Nevitt, T., & Thiele, D. J. (2008) · Nature Chemical Biology · doi:10.1038/nchembio.72 · Cited by 1,588
Wolff, S. P. (1994) · Methods in Enzymology · doi:10.1016/s0076-6879(94)33021-2 · Cited by 1,244
Free heme toxicity and its detoxification systems in human
Kumar, S., & Bandyopadhyay, U. (2005) · Toxicology Letters · doi:10.1016/j.toxlet.2005.03.004 · Cited by 852
Jang, H. H., Lee, K. O., Chi, Y. H., Jung, B. G., Park, S. K., Park, J. H., Lee, J. R., Lee, S. S., Moon, J. C., Yun, J. W., et al. (2004) · Cell · doi:10.1016/j.cell.2004.05.002 · Cited by 767
Passage of Heme-Iron Across the Envelope of Staphylococcus aureus
Mazmanian, S. K., Skaar, E. P., Gaspar, A. H., Humayun, M., Gornicki, P., Jelenska, J., Joachmiak, A., Missiakas, D. M., & Schneewind, O. (2003) · Science · doi:10.1126/science.1081147 · Cited by 593
Efficient insertional mutagenesis in lactococci and other gram-positive bacteria
Maguin, E., Prévost, H., Ehrlich, S. D., & Gruss, A. (1996) · Journal of Bacteriology · doi:10.1128/jb.178.3.931-935.1996 · Cited by 486
Self-citationHigh-efficiency gene inactivation and replacement system for gram-positive bacteria
Biswas, I., Gruss, A., Ehrlich, S. D., & Maguin, E. (1993) · Journal of Bacteriology · doi:10.1128/jb.175.11.3628-3635.1993 · Cited by 443
Self-citationIron-Source Preference of Staphylococcus aureus Infections
Skaar, E. P., Humayun, M., Bae, T., DeBord, K. L., & Schneewind, O. (2004) · Science · doi:10.1126/science.1099930 · Cited by 440
Research works printed but not linked: 2
- Nagababu, 2004, Antioxid. Redox. Signal., 6, 967
- Sassa, 2004, Antioxid. Redox. Signal., 6, 819
Cited by
Overcoming the Heme Paradox: Heme Toxicity and Tolerance in Bacterial Pathogens
Anzaldi, L. L., & Skaar, E. P. (2010) · Infection and Immunity · doi:10.1128/iai.00613-10 · Cited by 295
Aerobic Respiration Metabolism in Lactic Acid Bacteria and Uses in Biotechnology
Pedersen, M. B., Gaudu, P., Lechardeur, D., Petit, M.-A., & Gruss, A. (2012) · Annual Review of Food Science and Technology · doi:10.1146/annurev-food-022811-101255 · Cited by 197
Self-citationLechardeur, D., Cesselin, B., Liebl, U., Vos, M. H., Fernandez, A., Brun, C., Gruss, A., & Gaudu, P. (2012) · Journal of Biological Chemistry · doi:10.1074/jbc.m111.297531 · Cited by 93
Self-citationAdaptation to Aerobic Environment of Lactobacillus johnsonii/gasseri Strains
Maresca, D., Zotta, T., & Mauriello, G. (2018) · Frontiers in Microbiology · doi:10.3389/fmicb.2018.00157 · Cited by 66
“However, heme-binding proteins and heme homeostasis systems have been investigated in several LAB strains competent for aerobic respiration (Gaudu et al., 2003; Lechardeur et al., 2010, 2011; Sawai et al., 2012).”
BackgroundIron acquisition and regulation systems in Streptococcus species
Ge, R., & Sun, X. (2014) · Metallomics · doi:10.1039/c4mt00011k · Cited by 48
Heme proteins in lactic acid bacteria
Baureder, M., & Hederstedt, L. (2013) · Advances in Microbial Physiology · doi:10.1016/b978-0-12-410515-7.00001-9 · Cited by 45
Saillant, V., Lipuma, D., Ostyn, E., Joubert, L., Boussac, A., Guerin, H., Brandelet, G., Arnoux, P., & Lechardeur, D. (2021) · mBio · doi:10.1128/mbio.03392-20 · Cited by 43
Self-citation
Metadata
- Authors
- Lechardeur, D., Fernandez, A., Robert, B., Gaudu, P., Trieu-Cuot, P., Lamberet, G., & Gruss, A.
- Venue
- Journal of Biological Chemistry
- Publisher
- Elsevier BV
- Published
- 2010-05
- Volume
- 285
- Issue
- 21
- Pages
- 16032-16041
- ISSN
- 0021-9258
- Cited by
- 47
- References
- 72
- Language
- en
- Licence
- www.elsevier.com/tdm/userlicense/1.0/ (tdm)
- creativecommons.org/licenses/by/4.0/ (vor, 3786 d)
About these checks
Registry, retraction, Cites and statistics results are computed, not judged, with one exception: a printed reference that no index lists is read once by a model before it counts as a citation error. Claims are extracted by a model and kept only when their quote appears verbatim in the text; each cited source is then checked, with a model’s help, for whether it says what the claim relies on. Those verdicts can be wrong — read the claim’s quote and the cited source before relying on one.
Statistics and arithmetic are recomputed, not judged.
Confidence bands are shown only for fields calibrated on our annotated test set. None is calibrated yet, so no band is shown.
What counts as a claim ›How we measure confidence ›How we check this ›
Are you an author, or do you see a problem with this page? Request a review
Data sources
Bibliographic data: Semantic Scholar, OpenAlex, Crossref.
Contains information from the Semantic Scholar Academic Graph Datasets, made available under the ODC Attribution License (ODC-BY 1.0).
Semantic Scholar’s data is described in: Kinney, R., et al. (2023). The Semantic Scholar Open Data Platform. arXiv:2301.10140.
