Cited by 203

The DOI matches its Crossref record; 8 of the 8 references it cites were found in a registry or an index.

Dynamics of the Degradation of Ubiquitinated Proteins by Proteasomes and Autophagy

Myeku, Natura, Figueiredo-Pereira, Maria E.·2011·Journal of Biological Chemistry

Overview

The claims and statistics of this paper haven’t been checked yet.

Run the check — free, no account needed. It reads the open-access text and checks the sources it cites.

A few free checks a day · papers already verified open instantly · results are public

Integrity signals

Registry

Crossref · 10.1074/jbc.m110.149252

Cites

8 of 8 references verified0 citation errors · 0 not checkable

Statistics

Figures

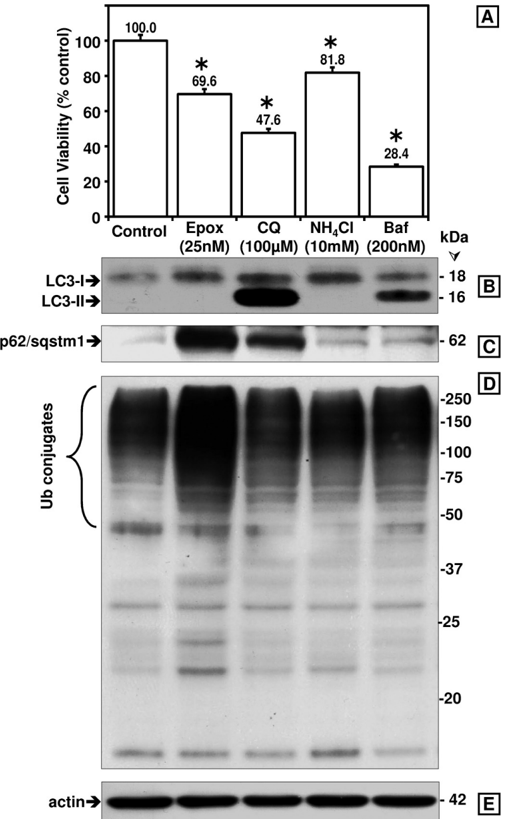
FIGURE 1 Comparison between the effects of proteasome and autophagy inhibitors on cytotoxicity as well as on LC3-I and LC3-II, p62/ SQSTM1,andubiquitinatedproteinlevelsinSK-N-SHcells. A, cell viability was assessed with the 3-(4,5-dimethylthiazol-2-yl)-2,5-diphenyltetrazolium bromide assay. Data represent the mean ± S.E. from at least eight determinations. The viability for each condition was compared with the viability of cells treated with vehicle only (control, 100%). The asterisk identifies the values that are significantly different ( p < 0.001) from the control. Western blot analyses (8 and 10% gels) were used to detect LC3-I and LC3-II ( B ), p62/ SQSTM1( C ), ubiquitinated ( Ub ) proteins ( D ), and actin as loading control ( E ) in total extracts of human SK-N-SH neuroblastoma cells (40 𝛍 gof protein/lane). Cells were treated with the different inhibitors for 24 h. Molecular mass markers in kDa are shown on the right. Similar results were obtained in duplicate experiments. Epx, epoxomicin; CQ, chloroquine; NH 4 Cl , ammonium chloride; Baf, bafilomycin A1; Ub , ubiquitin.
FIGURE 1 Comparison between the effects of proteasome and autophagy inhibitors on cytotoxicity as well as on LC3-I and LC3-II, p62/ SQSTM1,andubiquitinatedproteinlevelsinSK-N-SHcells. A, cell viability was assessed with the 3-(4,5-dimethylthiazol-2-yl)-2,5-diphenyltetrazolium bromide assay. Data represent the mean ± S.E. from at least eight determinations. The viability for each condition was compared with the viability of cells treated with vehicle only (control, 100%). The asterisk identifies the values that are significantly different ( p < 0.001) from the control. Western blot analyses (8 and 10% gels) were used to detect LC3-I and LC3-II ( B ), p62/ SQSTM1( C ), ubiquitinated ( Ub ) proteins ( D ), and actin as loading control ( E ) in total extracts of human SK-N-SH neuroblastoma cells (40 𝛍 gof protein/lane). Cells were treated with the different inhibitors for 24 h. Molecular mass markers in kDa are shown on the right. Similar results were obtained in duplicate experiments. Epx, epoxomicin; CQ, chloroquine; NH 4 Cl , ammonium chloride; Baf, bafilomycin A1; Ub , ubiquitin.CC-BY · From the PDF
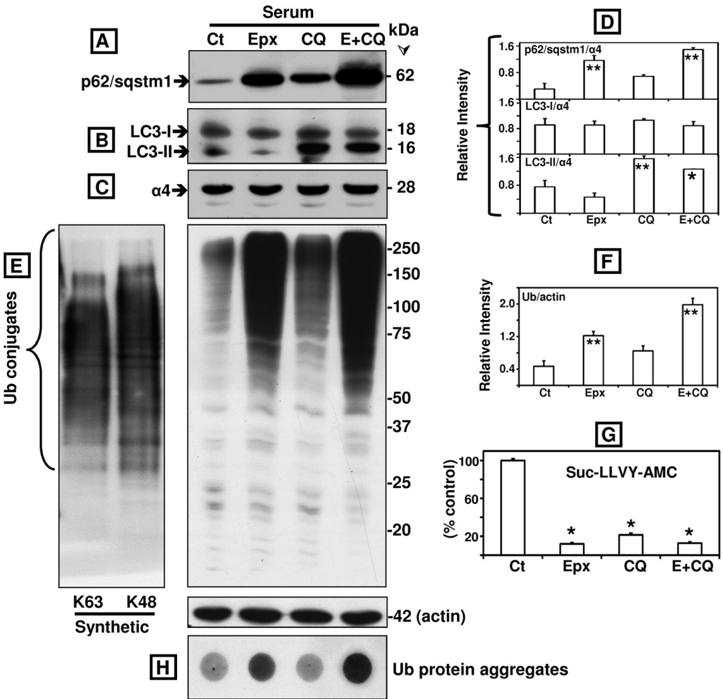
FIGURE 2 Comparison between the effects of epoxomicin ( Epx or E , 25 nM), chloroquine (100 𝛍 M), and the two combined ( E ÷ CQ ) on p62/SQSTM1, LC3-I and LC3-II, ubiquitinated proteins, protein aggregates, and proteasome activity in SK-N-SH cells maintained in serum conditions. Western blot analyses were used to detect p62/SQSTM1 ( A ), LC3-I and LC3-II ( B ), the proteasome subunit 𝛂 4( C ), and ubiquitinated proteins as well as actin as loading control ( E ) in total extracts of human SK-N-SH neuroblastoma cells (40 𝛍 gof protein/lane). In vitro synthesized Lys 63 -only and Lys 48 -only polyubiquitinated substrates (5 𝛍 g of protein/lane) were also loaded in the 1st two lanes in E . Molecular mass markers in kDa are shown on the right. Cells were treated with each inhibitor by itself or in combination for 24 h. The levels of p62/SQSTM1, LC3-I and LC3-II ( D ), and ubiquitinated proteins ( F ) were semi-quantified by densitometry. Data represent the relative intensity for all proteins. Values represent mean ± S.D. from at least duplicate experiments. The asterisks identify values that are significantly different (*, p at least < 0.05; **, p < 0.01) from control ( Ct ). The chymotrypsin-like activity of the proteasome ( G ) was measured in cleared supernatants obtained from total cell homogenates (25 𝛍 g of protein/sample). The peptidase activity was assayed colorimetrically after 24-h incubations at 37 °C with Suc-LLVY-AMC. Data represent the mean ± S.E. from three experiments. The asterisks identify values that are significantly different (*, p at least < 0.001) from control conditions. Aggregates of ubiquitinated ( Ub ) proteins were assessed with the filter trap assay ( H ).
FIGURE 2 Comparison between the effects of epoxomicin ( Epx or E , 25 nM), chloroquine (100 𝛍 M), and the two combined ( E ÷ CQ ) on p62/SQSTM1, LC3-I and LC3-II, ubiquitinated proteins, protein aggregates, and proteasome activity in SK-N-SH cells maintained in serum conditions. Western blot analyses were used to detect p62/SQSTM1 ( A ), LC3-I and LC3-II ( B ), the proteasome subunit 𝛂 4( C ), and ubiquitinated proteins as well as actin as loading control ( E ) in total extracts of human SK-N-SH neuroblastoma cells (40 𝛍 gof protein/lane). In vitro synthesized Lys 63 -only and Lys 48 -only polyubiquitinated substrates (5 𝛍 g of protein/lane) were also loaded in the 1st two lanes in E . Molecular mass markers in kDa are shown on the right. Cells were treated with each inhibitor by itself or in combination for 24 h. The levels of p62/SQSTM1, LC3-I and LC3-II ( D ), and ubiquitinated proteins ( F ) were semi-quantified by densitometry. Data represent the relative intensity for all proteins. Values represent mean ± S.D. from at least duplicate experiments. The asterisks identify values that are significantly different (*, p at least < 0.05; **, p < 0.01) from control ( Ct ). The chymotrypsin-like activity of the proteasome ( G ) was measured in cleared supernatants obtained from total cell homogenates (25 𝛍 g of protein/sample). The peptidase activity was assayed colorimetrically after 24-h incubations at 37 °C with Suc-LLVY-AMC. Data represent the mean ± S.E. from three experiments. The asterisks identify values that are significantly different (*, p at least < 0.001) from control conditions. Aggregates of ubiquitinated ( Ub ) proteins were assessed with the filter trap assay ( H ).CC-BY · From the PDF
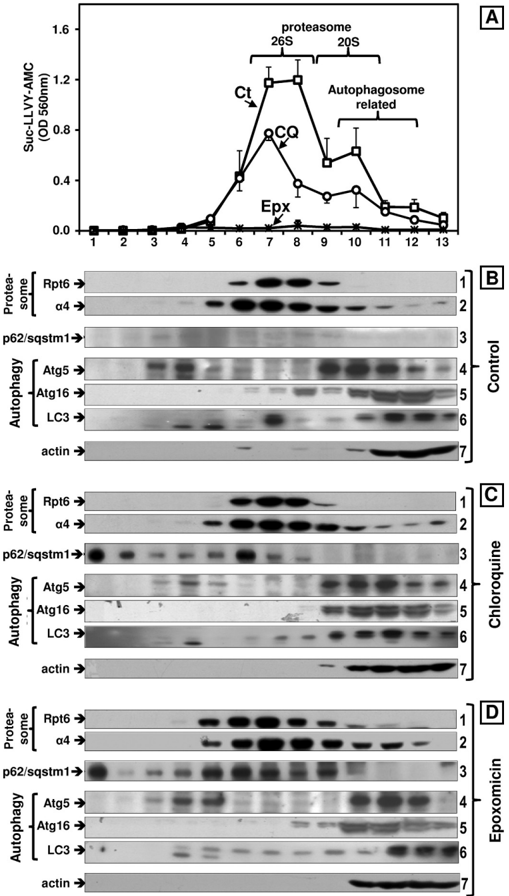
FIGURE 3 Effects of epoxomicin (25 nM) and chloroquine (100 𝛍 M) on the sedimentationvelocityofproteasomesandautophagy-relatedproteins in SK-N-SH cells maintained in serum conditions. Total lysates (2 mg of protein/sample) were fractionated by glycerol density gradient centrifugation (10-40% glycerol corresponding to fractions 13 to 1). A, aliquots (50 𝛍 l) of each fraction obtained from control ( Ct , squares ), chloroquine- ( CQ , circles ), and epoxomicin (Epx, crosses )-treated cells under serum conditions were assayed for chymotrypsin-like activity with Suc-LLVY-AMC. Data represent the mean ± S.E. from three experiments. B-D, immunoblot analyses of each fraction probed with antibodies that react with the proteasome ( 𝛂 4, core particle; Rpt6/S8, 19 S regulatory particle), with autophagy-related proteins (Atg5, Atg16, and LC3) and with p62/SQSTM1. Proteins were precipitated with acetone from 700 𝛍 l of each fraction. The fractions were obtained from control ( B ), chloroquine ( C ), and epoxomicin-treated ( D ) cells. Similar results were obtained in triplicate experiments and under serum and serum-free conditions. The numbers on the right designate each row.
FIGURE 3 Effects of epoxomicin (25 nM) and chloroquine (100 𝛍 M) on the sedimentationvelocityofproteasomesandautophagy-relatedproteins in SK-N-SH cells maintained in serum conditions. Total lysates (2 mg of protein/sample) were fractionated by glycerol density gradient centrifugation (10-40% glycerol corresponding to fractions 13 to 1). A, aliquots (50 𝛍 l) of each fraction obtained from control ( Ct , squares ), chloroquine- ( CQ , circles ), and epoxomicin (Epx, crosses )-treated cells under serum conditions were assayed for chymotrypsin-like activity with Suc-LLVY-AMC. Data represent the mean ± S.E. from three experiments. B-D, immunoblot analyses of each fraction probed with antibodies that react with the proteasome ( 𝛂 4, core particle; Rpt6/S8, 19 S regulatory particle), with autophagy-related proteins (Atg5, Atg16, and LC3) and with p62/SQSTM1. Proteins were precipitated with acetone from 700 𝛍 l of each fraction. The fractions were obtained from control ( B ), chloroquine ( C ), and epoxomicin-treated ( D ) cells. Similar results were obtained in triplicate experiments and under serum and serum-free conditions. The numbers on the right designate each row.CC-BY · From the PDF
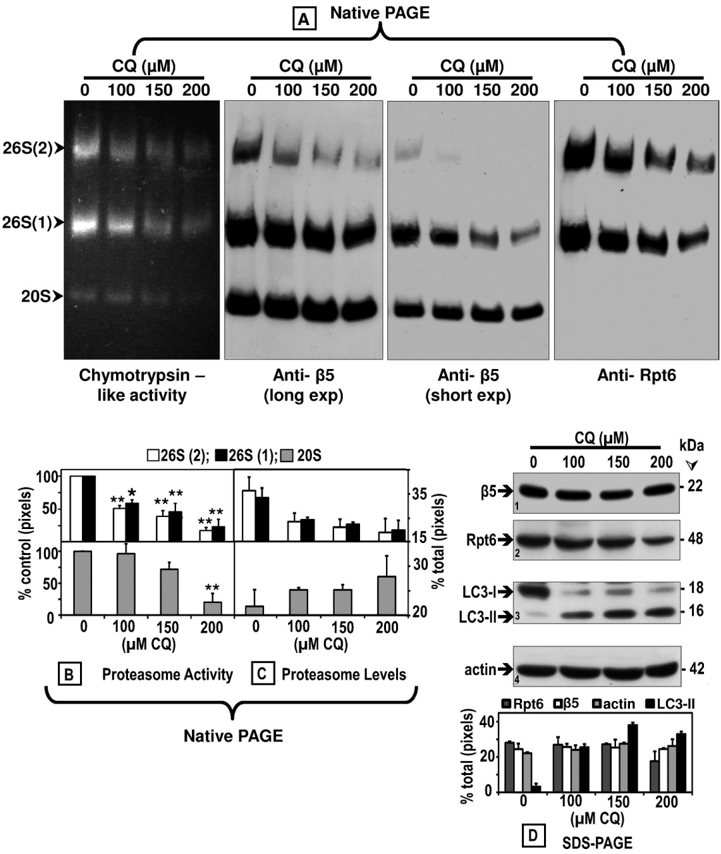
FIGURE 4 Chloroquine inhibits the proteasome activity and affects its assembly. Crude extracts were prepared from control ( 0 ) SK-N-SH cells or cells treated with increasing CQ concentrations for 24 h. Cleared lysates (80 𝛍 g/sample) were subjected to nondenaturing gel electrophoresis. A, proteasomal chymotrypsin-likeactivity was measuredwithSuc-LLVY-AMCbythein-gelassay( left panel ). 26 S and 20 S proteasomes were detected by immunoblottingwith an anti𝛃 5 antibody, a subunit of the core proteasome particle (20 S) ( two middle panels (long and short exposures ( exp ))). The 26 S holoenzyme was further identified with an antibody that reacts with the Rpt6/S8 (ATPase) subunit of the 19 S regulatory particle ( right panel ). Proteasomal 26 S (two capped and one capped) and 20 S forms are indicated by arrowheads onthe left . Activity ( B ) and immunoblot ( C ) bands on the nondenaturing (native) gel were semi-quantified by densitometry. Data represent total pixels compared with control (no chloroquine) and means and S.E. from three experiments. B, asterisks identify values that are significantly different (*, p at least < 0.05; **, p < 0.01) from control ( Ct ). In parallel experiments ( D ), cells were harvested for SDS-PAGE followed by Western blot analyses (40 𝛍 gof protein/lane) to detect proteasome subunits 𝛃 5 and Rpt6/S8, autophagy proteins LC3-I and LC3-II, and actin (loading control) after treatment with increasing chloroquine concentrations for 24 h. The level of each protein band was semi-quantified by densitometry ( graph ). Data represent total pixels and means ± S.D. from duplicate experiments. Molecular mass markers in kDa are shown on the right . The small numbers within the immunoblots designate each row.
FIGURE 4 Chloroquine inhibits the proteasome activity and affects its assembly. Crude extracts were prepared from control ( 0 ) SK-N-SH cells or cells treated with increasing CQ concentrations for 24 h. Cleared lysates (80 𝛍 g/sample) were subjected to nondenaturing gel electrophoresis. A, proteasomal chymotrypsin-likeactivity was measuredwithSuc-LLVY-AMCbythein-gelassay( left panel ). 26 S and 20 S proteasomes were detected by immunoblottingwith an anti𝛃 5 antibody, a subunit of the core proteasome particle (20 S) ( two middle panels (long and short exposures ( exp ))). The 26 S holoenzyme was further identified with an antibody that reacts with the Rpt6/S8 (ATPase) subunit of the 19 S regulatory particle ( right panel ). Proteasomal 26 S (two capped and one capped) and 20 S forms are indicated by arrowheads onthe left . Activity ( B ) and immunoblot ( C ) bands on the nondenaturing (native) gel were semi-quantified by densitometry. Data represent total pixels compared with control (no chloroquine) and means and S.E. from three experiments. B, asterisks identify values that are significantly different (*, p at least < 0.05; **, p < 0.01) from control ( Ct ). In parallel experiments ( D ), cells were harvested for SDS-PAGE followed by Western blot analyses (40 𝛍 gof protein/lane) to detect proteasome subunits 𝛃 5 and Rpt6/S8, autophagy proteins LC3-I and LC3-II, and actin (loading control) after treatment with increasing chloroquine concentrations for 24 h. The level of each protein band was semi-quantified by densitometry ( graph ). Data represent total pixels and means ± S.D. from duplicate experiments. Molecular mass markers in kDa are shown on the right . The small numbers within the immunoblots designate each row.CC-BY · From the PDF
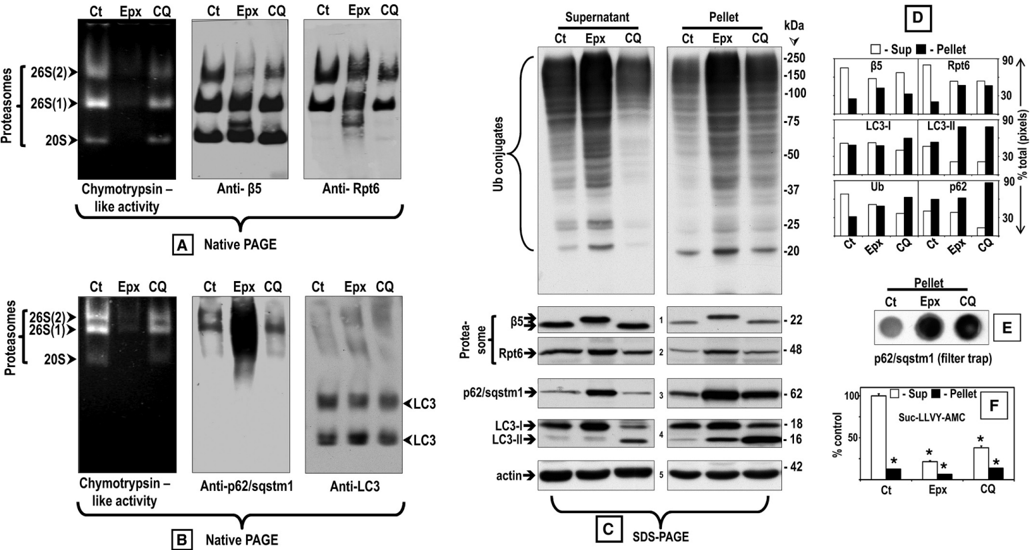
FIGURE5 Comparisonbetweentheeffectsofepoxomicin(25nM)andchloroquine(100 𝛍 M)onp62/SQSTM1anditsassociationwithproteasomesand LC3 in supernatant and pellet fractions. Crude extracts were prepared from SK-N-SH cells control ( Ct ) or treated with each inhibitor for 24 h. Cleared lysates (80 𝛍 g/sample) were subjected to nondenaturing gel electrophoresis. A and B, proteasomal chymotrypsin-like activity was measured with Suc-LLVY-AMC by the in-gel assay ( left panels ). A , 26 S and 20 S proteasomes were detected by immunoblotting with an anti𝛃 5 antibody, a subunit of the core proteasome particle (20 S) ( middle panel ), and with the anti-Rpt6/S8 antibody, an ATPase subunit of the 19 S regulatory particle ( right panel ). Proteasomal 26 S (two capped andonecapped)and20 Sformsareindicatedby arrowheads onthe left . B, p62/SQSTM1( middle panel ) and LC3 ( right panel ) were detected by immunoblotting with the respective antibodies. C, aliquots of the supernatant (cleared lysate) and pellet fractions were run on SDS-PAGE followed by immunoblotting with the anti-ubiquitinated proteins antibody as well as the same antibodies listed in A and B . Molecular mass markers in kDa are shown on the right . The small numbers next to the immunoblots designate each row. The level of the proteins in each immunoblot was semi-quantified by densitometry ( D ). Data represent % of total pixels (total = supernatant + pellet). The pellet fractions were also subjected to the filter trap assay to detect protein aggregates ( E ). The chymotrypsin-like activity of the supernatant ( Sup ) and pellet fractions was measured with Suc-LLVY-AMC ( F ). The asterisks identify values that are significantly different (*, p at least < 0.001) from the control supernatant.
FIGURE5 Comparisonbetweentheeffectsofepoxomicin(25nM)andchloroquine(100 𝛍 M)onp62/SQSTM1anditsassociationwithproteasomesand LC3 in supernatant and pellet fractions. Crude extracts were prepared from SK-N-SH cells control ( Ct ) or treated with each inhibitor for 24 h. Cleared lysates (80 𝛍 g/sample) were subjected to nondenaturing gel electrophoresis. A and B, proteasomal chymotrypsin-like activity was measured with Suc-LLVY-AMC by the in-gel assay ( left panels ). A , 26 S and 20 S proteasomes were detected by immunoblotting with an anti𝛃 5 antibody, a subunit of the core proteasome particle (20 S) ( middle panel ), and with the anti-Rpt6/S8 antibody, an ATPase subunit of the 19 S regulatory particle ( right panel ). Proteasomal 26 S (two capped andonecapped)and20 Sformsareindicatedby arrowheads onthe left . B, p62/SQSTM1( middle panel ) and LC3 ( right panel ) were detected by immunoblotting with the respective antibodies. C, aliquots of the supernatant (cleared lysate) and pellet fractions were run on SDS-PAGE followed by immunoblotting with the anti-ubiquitinated proteins antibody as well as the same antibodies listed in A and B . Molecular mass markers in kDa are shown on the right . The small numbers next to the immunoblots designate each row. The level of the proteins in each immunoblot was semi-quantified by densitometry ( D ). Data represent % of total pixels (total = supernatant + pellet). The pellet fractions were also subjected to the filter trap assay to detect protein aggregates ( E ). The chymotrypsin-like activity of the supernatant ( Sup ) and pellet fractions was measured with Suc-LLVY-AMC ( F ). The asterisks identify values that are significantly different (*, p at least < 0.001) from the control supernatant.CC-BY · From the PDF
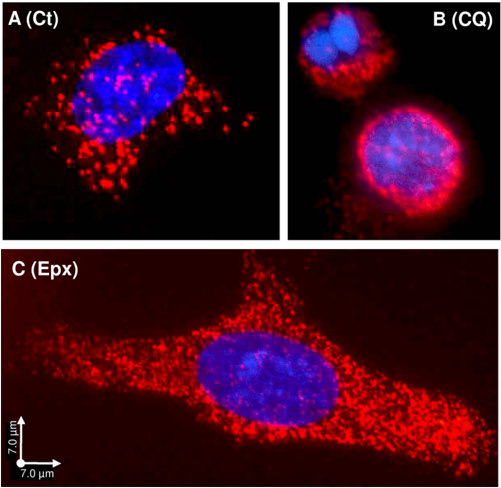
FIGURE 6 Protein interaction between p62/SQSTM1 and proteasomes detectedbythePLA. SK-N-SH cells control ( A, Ct ) or treated for 24 h with 100 𝛍 M chloroquine ( B, CQ ) or 25 nM epoxomicin ( C, Epx ) were co-incubated with aproteasomeantibody(Rpt6/S8)andap62/SQSTM1antibody.Nuclearstaining, DAPI, and PLA signal, Texas Red. Scale bars, 7 𝛍 m.
FIGURE 6 Protein interaction between p62/SQSTM1 and proteasomes detectedbythePLA. SK-N-SH cells control ( A, Ct ) or treated for 24 h with 100 𝛍 M chloroquine ( B, CQ ) or 25 nM epoxomicin ( C, Epx ) were co-incubated with aproteasomeantibody(Rpt6/S8)andap62/SQSTM1antibody.Nuclearstaining, DAPI, and PLA signal, Texas Red. Scale bars, 7 𝛍 m.CC-BY · From the PDF
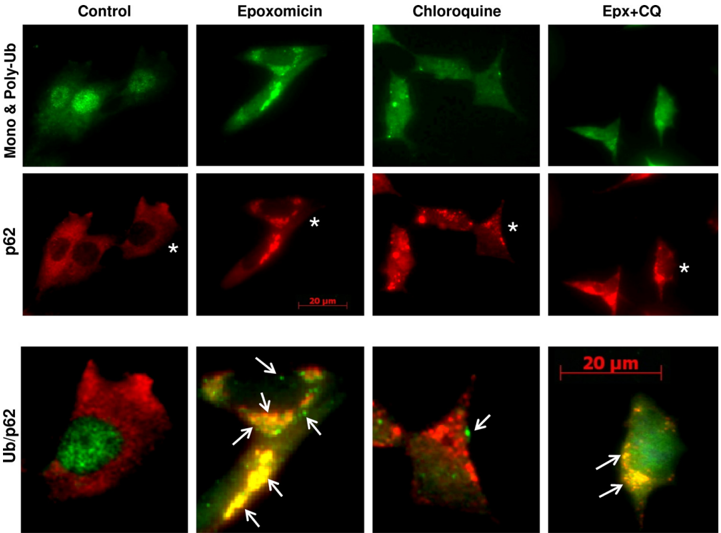
FIGURE 7 Effects of epoxomicin and chloroquine on p62/SQSTM1 and ubiquitin-protein aggregates. Double immunofluorescence staining of SK-N-SH cells control or treated with 25 nM epoxomicin or 100 𝛍 Mchloroquine alone or combined ( Epx + CQ ) is shown. p62/SQSTM1 (p62) aggregates were visualized with the anti-p62/SQSTM1 antibody ( red ), and mono- and polyubiquitinated proteins were visualized with the anti-ubiquitin antibody ( green ). Enlarged merged (ubiquitin /p62) images of cells marked with an asterisk and treated under the different conditions are shown in the bottom panels . Scale bar, 20 𝛍 m. Arrows point to ubiquitin-protein aggregates.
FIGURE 7 Effects of epoxomicin and chloroquine on p62/SQSTM1 and ubiquitin-protein aggregates. Double immunofluorescence staining of SK-N-SH cells control or treated with 25 nM epoxomicin or 100 𝛍 Mchloroquine alone or combined ( Epx + CQ ) is shown. p62/SQSTM1 (p62) aggregates were visualized with the anti-p62/SQSTM1 antibody ( red ), and mono- and polyubiquitinated proteins were visualized with the anti-ubiquitin antibody ( green ). Enlarged merged (ubiquitin /p62) images of cells marked with an asterisk and treated under the different conditions are shown in the bottom panels . Scale bar, 20 𝛍 m. Arrows point to ubiquitin-protein aggregates.CC-BY · From the PDF
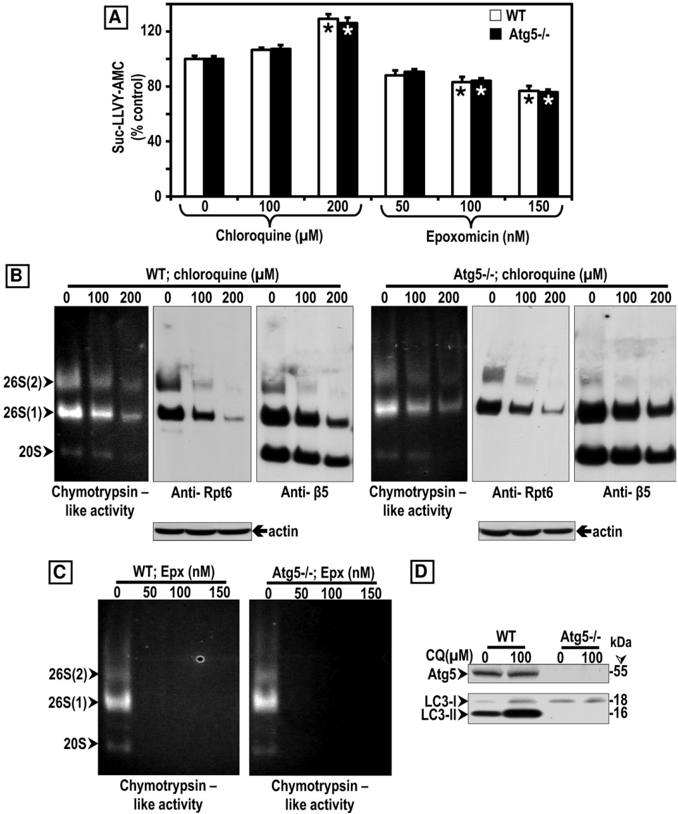
FIGURE 8 ComparisonbetweentheeffectsofCQandEpxonproteasomeactivityinWTandAtg5 H11546 / H11546 MEF. A, chymotrypsin-like activity was measured in cleared supernatants obtained from total cell homogenates (25 𝛍 g of protein/sample). The peptidase activity was assayed colorimetrically after 24-h incubations at 37 °C with Suc-LLVY-AMC. Data represent the mean ± S.E. from eight determinations. The asterisks identify values that are significantly different (*, p at least < 0.01) from control ( 0 ). B and C, crude extracts were prepared from WT and Atg5 -/ -MEFs control ( 0 ) or treated with increasing chloroquine ( B ) or epoxomicin ( C ) concentrations for 24 h. Cleared lysates (80 𝛍 g/sample) were subjected to nondenaturing gel electrophoresis. The proteasomal chymotrypsinlike activity was measured with Suc-LLVY-AMC by the in-gel assay ( left panels ). 26 S and 20 S proteasomes were detected by immunoblotting with the anti-Rpt6/S8 antibody (for 26 S, middle panels ) and the anti𝛃 5 antibody (for 26 S and 20 S, right panels ). Proteasomal 26 S (two capped and one capped) and 20 S forms are indicated by arrowheads on the left . In parallel experiments ( D ), cells were harvested for SDS-PAGE followed by Western blot analyses (40 𝛍 g of protein/lane) to detect the autophagy proteins Atg5, LC3-I, and LC3-II under control ( 0 ) and CQ treatment for 24 h. Molecular mass markers in kDa are shown on the right .
FIGURE 8 ComparisonbetweentheeffectsofCQandEpxonproteasomeactivityinWTandAtg5 H11546 / H11546 MEF. A, chymotrypsin-like activity was measured in cleared supernatants obtained from total cell homogenates (25 𝛍 g of protein/sample). The peptidase activity was assayed colorimetrically after 24-h incubations at 37 °C with Suc-LLVY-AMC. Data represent the mean ± S.E. from eight determinations. The asterisks identify values that are significantly different (*, p at least < 0.01) from control ( 0 ). B and C, crude extracts were prepared from WT and Atg5 -/ -MEFs control ( 0 ) or treated with increasing chloroquine ( B ) or epoxomicin ( C ) concentrations for 24 h. Cleared lysates (80 𝛍 g/sample) were subjected to nondenaturing gel electrophoresis. The proteasomal chymotrypsinlike activity was measured with Suc-LLVY-AMC by the in-gel assay ( left panels ). 26 S and 20 S proteasomes were detected by immunoblotting with the anti-Rpt6/S8 antibody (for 26 S, middle panels ) and the anti𝛃 5 antibody (for 26 S and 20 S, right panels ). Proteasomal 26 S (two capped and one capped) and 20 S forms are indicated by arrowheads on the left . In parallel experiments ( D ), cells were harvested for SDS-PAGE followed by Western blot analyses (40 𝛍 g of protein/lane) to detect the autophagy proteins Atg5, LC3-I, and LC3-II under control ( 0 ) and CQ treatment for 24 h. Molecular mass markers in kDa are shown on the right .CC-BY · From the PDF
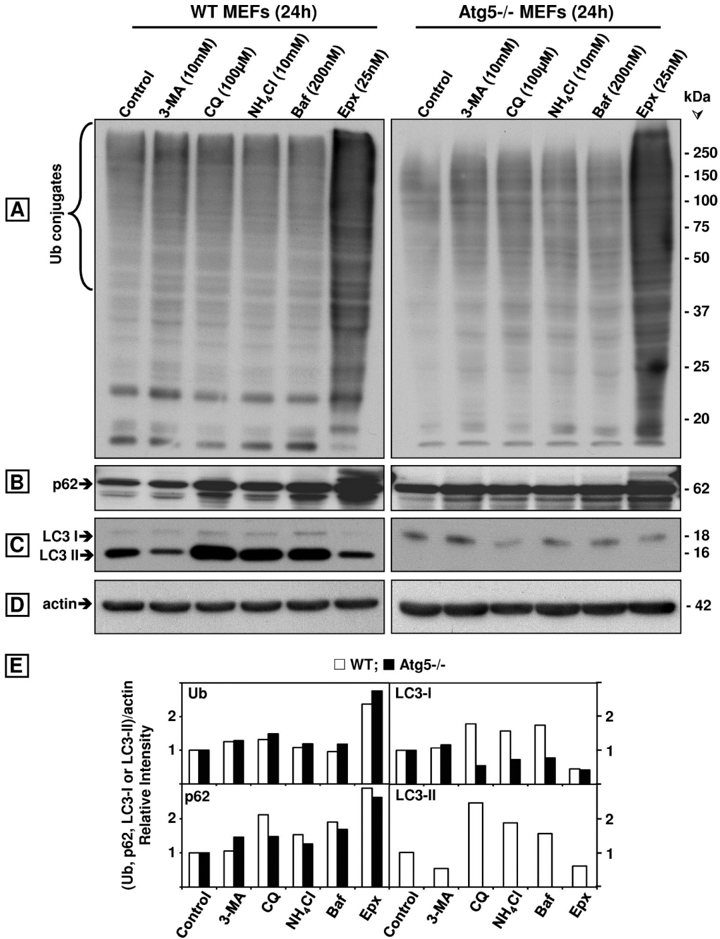
FIGURE 9 Comparison of the effects of the autophagy inhibitors 3-MA, CQ, NH 4 Cl, and bafilomycin A1 ( Baf ) with the proteasome inhibitor Epx on ubiquitinated ( Ub ) proteins, p62/SQSTM1, LC3-I, and LC3-II in wild type (WT) and Atg5 H11546 / H11546 MEFs. Western blot analyses (8 or 10% gels) to detect ubiquitinated proteins ( A ), p62/SQSTM1 (p62, B ), LC3-I and LC3-II ( C ), and actin ( D, loading control) in total extracts (40 𝛍 gofprotein/lane) of MEFs treated with each inhibitor for 24 h. Molecular mass markers in kDa are shown on the right. The protein levels were semi-quantified by densitometry ( E ). Data represent relative intensity obtained from at least four cell culture dishes per condition.
FIGURE 9 Comparison of the effects of the autophagy inhibitors 3-MA, CQ, NH 4 Cl, and bafilomycin A1 ( Baf ) with the proteasome inhibitor Epx on ubiquitinated ( Ub ) proteins, p62/SQSTM1, LC3-I, and LC3-II in wild type (WT) and Atg5 H11546 / H11546 MEFs. Western blot analyses (8 or 10% gels) to detect ubiquitinated proteins ( A ), p62/SQSTM1 (p62, B ), LC3-I and LC3-II ( C ), and actin ( D, loading control) in total extracts (40 𝛍 gofprotein/lane) of MEFs treated with each inhibitor for 24 h. Molecular mass markers in kDa are shown on the right. The protein levels were semi-quantified by densitometry ( E ). Data represent relative intensity obtained from at least four cell culture dishes per condition.CC-BY · From the PDF
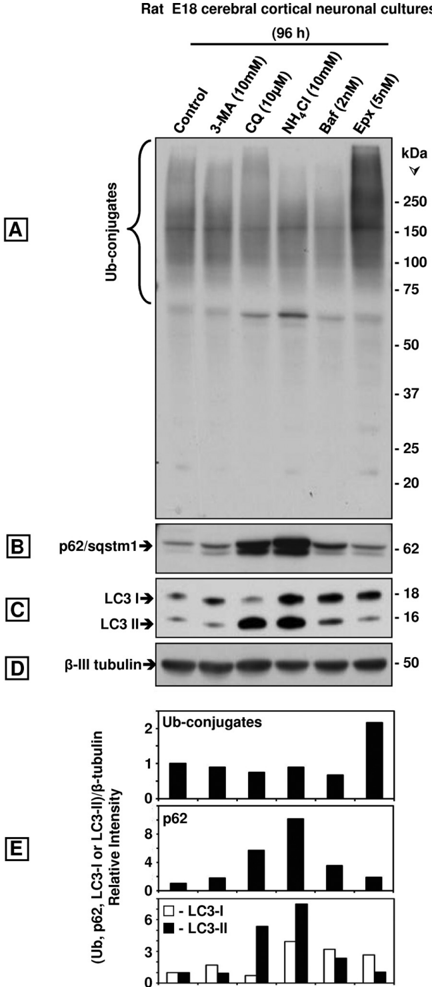
FIGURE 10 Comparison of the effects of the autophagy inhibitors 3-MA, CQ, NH4Cl, and bafilomycin A1 ( Baf ) with the proteasome inhibitor Epx onubiquitinated ( Ub ) proteins, p62/SQSTM1, LC3-I, and LC3-II in rat E18 cerebral cortical neuronal cultures treated with each inhibitor for 96 h. Western blot analyses (8 or 10% gels) to detect ubiquitinated proteins ( A ), p62/SQSTM1(p62, B ), LC3-I, and LC3-II ( C ) and 𝛃 -tubulin ( D, loadingcontrol)in total extracts of the neuronal cultures (40 𝛍 gofprotein/lane). Molecular mass markers in kDa are shown on the right . The protein levels were semi-quantified by densitometry ( E ). Data represent relative intensity obtained from at least three cell culture dishes per condition.
FIGURE 10 Comparison of the effects of the autophagy inhibitors 3-MA, CQ, NH4Cl, and bafilomycin A1 ( Baf ) with the proteasome inhibitor Epx onubiquitinated ( Ub ) proteins, p62/SQSTM1, LC3-I, and LC3-II in rat E18 cerebral cortical neuronal cultures treated with each inhibitor for 96 h. Western blot analyses (8 or 10% gels) to detect ubiquitinated proteins ( A ), p62/SQSTM1(p62, B ), LC3-I, and LC3-II ( C ) and 𝛃 -tubulin ( D, loadingcontrol)in total extracts of the neuronal cultures (40 𝛍 gofprotein/lane). Molecular mass markers in kDa are shown on the right . The protein levels were semi-quantified by densitometry ( E ). Data represent relative intensity obtained from at least three cell culture dishes per condition.CC-BY · From the PDF

Verification

Claims the paper makes

The claims and statistics of this paper haven’t been checked yet.

Run the check — free, no account needed. It reads the open-access text and checks the sources it cites.

A few free checks a day · papers already verified open instantly · results are public

Claims other papers make about this one

Each is checked against this paper’s own text: does it say what the citing paper says it does?

Self-check

Percentages, sums and reported differences re-computed from the paper’s own numbers.

The self-check needs the paper’s full text.

Citations

Cites

Research works printed but not linked: 45

  1. Mayer, 2003, Drug News Perspect., 16, 103, 10.1358/dnp.2003.16.2.829327 · DOI
  2. Ciechanover, 2005, Cell Death Differ., 12, 1178, 10.1038/sj.cdd.4401692 · DOI
  3. Komatsu, 2006, Nature, 441, 880, 10.1038/nature04723 · DOI · Paper page
  4. Klionsky, 2006, Nature, 441, 819, 10.1038/441819a · DOI
  5. Shin, 1998, Arch. Pharm. Res., 21, 629, 10.1007/BF02976748 · DOI
  6. Park, 1995, Proc. Natl. Acad. Sci. U.S.A., 92, 12338, 10.1073/pnas.92.26.12338 · DOI
  7. Wooten, 2006, J. Biomed. Biotechnol., 2006, 62079, 10.1155/JBB/2006/62079 · DOI
  8. Seibenhener, 2007, FEBS. Lett., 581, 175, 10.1016/j.febslet.2006.12.027 · DOI
  9. Biedler, 1978, Cancer Res., 38, 3751
  10. Biederer, 2007, Nat. Protoc., 2, 670, 10.1038/nprot.2007.92 · DOI · Paper page
  11. Mosmann, 1983, J. Immunol. Methods, 65, 55, 10.1016/0022-1759(83)90303-4 · DOI · Paper page
  12. Wilk, 1983, J. Neurochem., 40, 842, 10.1111/j.1471-4159.1983.tb08056.x · DOI
  13. Elsasser, 2005, Methods Enzymol., 398, 353, 10.1016/S0076-6879(05)98029-4 · DOI
  14. Ogburn, 2006, J. Biol. Chem., 281, 23274, 10.1074/jbc.M600635200 · DOI
  15. Wanker, 1999, Methods Enzymol., 309, 375, 10.1016/S0076-6879(99)09026-6 · DOI
  16. Komatsu, 2007, Cell, 131, 1149, 10.1016/j.cell.2007.10.035 · DOI · Paper page
  17. Bjørkøy, 2005, J. Cell Biol., 171, 603, 10.1083/jcb.200507002 · DOI · Paper page
  18. Qiao, 2009, Neurosci. Lett., 456, 15, 10.1016/j.neulet.2009.03.085 · DOI
  19. Stein, 1996, Biochemistry, 35, 3899, 10.1021/bi952262x · DOI
  20. Sasaki, 1984, J. Biol. Chem., 259, 12489, 10.1016/S0021-9258(18)90773-8 · DOI
  21. Tan, 2008, Hum. Mol. Genet., 17, 431, 10.1093/hmg/ddm320 · DOI
  22. Meiners, 2003, J. Biol. Chem., 278, 21517, 10.1074/jbc.M301032200 · DOI
  23. Gao, 2010, Autophagy, 6, 126, 10.4161/auto.6.1.10928 · DOI
  24. Fredriksson, 2002, Nat. Biotechnol., 20, 473, 10.1038/nbt0502-473 · DOI
  25. Weibrecht, 2010, Expert Rev. Proteomics, 7, 401, 10.1586/epr.10.10 · DOI
  26. Wibo, 1974, J. Cell Biol., 63, 430, 10.1083/jcb.63.2.430 · DOI
  27. Poole, 1981, J. Cell Biol., 90, 665, 10.1083/jcb.90.3.665 · DOI
  28. Underwood, 2010, Hum. Mol. Genet., 19, 3413, 10.1093/hmg/ddq253 · DOI
  29. Seglen, 1982, Proc. Natl. Acad. Sci. U.S.A., 79, 1889, 10.1073/pnas.79.6.1889 · DOI
  30. Sprangers, 2008, Biochemistry, 47, 6727, 10.1021/bi8005913 · DOI
  31. Lee, 1996, J. Biol. Chem., 271, 27280, 10.1074/jbc.271.44.27280 · DOI
  32. Vernace, 2007, FASEB J., 21, 2672, 10.1096/fj.06-6751com · DOI
  33. Qiao, 2008, Mol. Brain, 1, 17, 10.1186/1756-6606-1-17 · DOI
  34. Saftig, 1995, EMBO J., 14, 3599, 10.1002/j.1460-2075.1995.tb00029.x · DOI
  35. Nishida, 2009, Nature, 461, 654, 10.1038/nature08455 · DOI · Paper page
  36. Shimizu, 2010, Autophagy, 6, 290, 10.4161/auto.6.2.11127 · DOI
  37. Fredriksson, 2009, Nat. Methods, 6, i, 10.1038/nmeth.f.246 · DOI
  38. Johnston, 1998, J. Cell Biol., 143, 1883, 10.1083/jcb.143.7.1883 · DOI · Paper page
  39. Zhu, 2010, Oncogene, 29, 451, 10.1038/onc.2009.343 · DOI · Paper page
  40. Klionsky, 2008, Autophagy, 4, 151, 10.4161/auto.5338 · DOI · Paper page
  41. Yoon, 2010, Invest. Ophthalmol. Vis. Sci., 51, 6030, 10.1167/iovs.10-5278 · DOI · Paper page
  42. Wang, 2005, Mol. Cell. Neurosci., 29, 222, 10.1016/j.mcn.2005.02.011 · DOI
  43. Korolchuk, 2009, Mol. Cell, 33, 517, 10.1016/j.molcel.2009.01.021 · DOI · Paper page
  44. Moscat, 2009, Cell, 137, 1001, 10.1016/j.cell.2009.05.023 · DOI · Paper page
  45. Kettern, 2010, Biol. Chem., 391, 481, 10.1515/bc.2010.058 · DOI

Cited by

Sorted by citations

See all 203

Metadata

Authors
Myeku, N., & Figueiredo-Pereira, M. E.
Venue
Journal of Biological Chemistry
Publisher
Elsevier BV
Published
2011-06
Volume
286
Issue
25
Pages
22426-22440
ISSN
0021-9258
Cited by
203
References
8
Language
en

About these checks

Registry, retraction, Cites and statistics results are computed, not judged, with one exception: a printed reference that no index lists is read once by a model before it counts as a citation error. Claims are extracted by a model and kept only when their quote appears verbatim in the text; each cited source is then checked, with a model’s help, for whether it says what the claim relies on. Those verdicts can be wrong — read the claim’s quote and the cited source before relying on one.

Statistics and arithmetic are recomputed, not judged.

Confidence bands are shown only for fields calibrated on our annotated test set. None is calibrated yet, so no band is shown.

What counts as a claim ›How we measure confidence ›How we check this ›

Are you an author, or do you see a problem with this page? Request a review