

The DOI matches its Crossref record; 3 of the 3 references it cites were found in a registry or an index.
Yeast Fex1p Is a Constitutively Expressed Fluoride Channel with Functional Asymmetry of Its Two Homologous Domains
Overview
The claims and statistics of this paper haven’t been checked yet.
Run the check — free, no account needed. It reads the open-access text and checks the sources it cites.
Integrity signals
Registry
Cites
Statistics
Figures
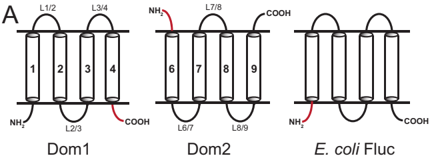
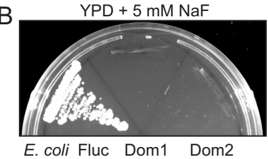
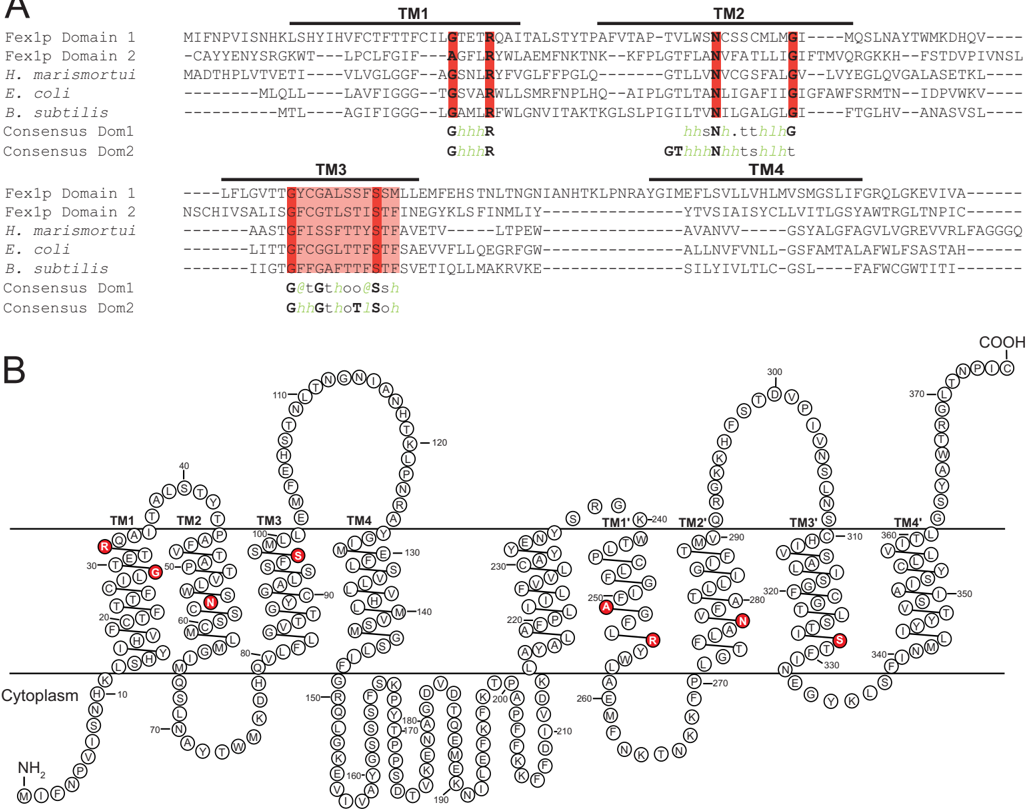
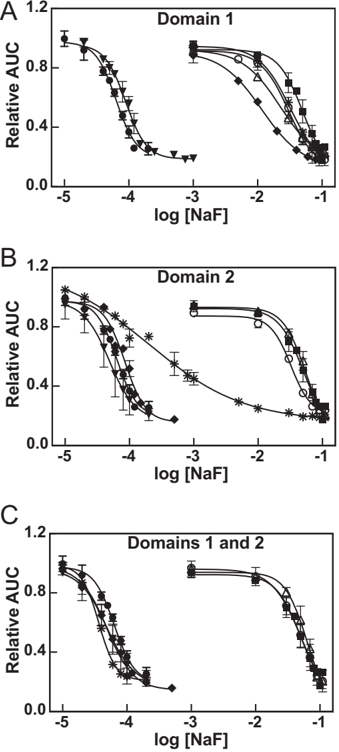
Verification
Claims the paper makes
The claims and statistics of this paper haven’t been checked yet.
Run the check — free, no account needed. It reads the open-access text and checks the sources it cites.
Claims other papers make about this one
Each is checked against this paper’s own text: does it say what the citing paper says it does?
The source backs part of the claim, not all of it — or backs it for a different population, condition or comparison.
In the citing paper
“In the heterodimeric Fluc and FEX proteins, essential pore-lining residues are conserved in only one of the two domains(3, 66, 73), providing a case study in how redundant features degrade upon gene duplication, fusion, and genetic drift.”
From Membrane exporters of fluoride ion (2021) · cites this paper as [3]
Experimental — accuracy not yet measuredThe cited source says what the claim attributes to it.
In the citing paper
“Unicellular organisms directly exposed to environmental F- counteract the anion’s toxicity through the action of F--exporting membrane transport proteins that keep cytoplasmic F- below inhibitory levels1–4,8.”
From Crystal structures of a double-barrelled fluoride ion channel (2015) · cites this paper as [4]
The cited source says what the claim attributes to it.
In the citing paper
“The second family, called Fluc (Fluoride channel) in bacteria and FEX (Fluoride exporter) in eukaryotes, are dedicated fluoride channels that permit electrodiffusive export of F− (2, 3).”
From Membrane exporters of fluoride ion (2021) · cites this paper as [3]
The cited source says what the claim attributes to it.
In the citing paper
“Electrophysiological characterization showed that the proteins encoded by the crcB genes are electrodiffusive F− channels (2, 3, 60–63), and they were renamed Fluc (Fluoride channel) in bacteria and FEX (Fluoride exporter) in eukaryotes.”
From Membrane exporters of fluoride ion (2021) · cites this paper as [3]
In the citing paper
“These channels are structurally related to the Flucs but possess a more complicated two-domain fold (24, 25).”
From Fluoride export is required for the competitive fitness of pathogenic microorganisms in dental biofilm models (2024) · cites this paper as [24]
In the citing paper
“Like the Flucs, these proteins export fluoride via a channel mechanism driven by the membrane potential87.”
From The link between ancient microbial fluoride resistance mechanisms and bioengineering organofluorine degradation or synthesis (2024) · cites this paper as [87]
In the citing paper
“FEX proteins are related structurally to the Flucs but possess a more complex two-domain fold83,87.”
From The link between ancient microbial fluoride resistance mechanisms and bioengineering organofluorine degradation or synthesis (2024) · cites this paper as [87]
In the citing paper
“microorganisms export this anion through F--specific ion channels of the Fluc family1–4.”
From Crystal structures of a double-barrelled fluoride ion channel (2015) · cites this paper as [4]
In the citing paper
“Recent experiments buttress this idea by showing that mutations of several C-terminal domain residues in pore-2 produce F- hypersensitivity in yeast, whereas mutations of N-terminal domain, pore-1 counterparts are relatively harmless4.”
From Crystal structures of a double-barrelled fluoride ion channel (2015) · cites this paper as [4]
In the citing paper
“Two-pore assembly neatly accounts for evolutionary drift in eukaryotic Fluc channels, all of which consist of an inverted repeat of two homologous Fluc domains fused into a single polypeptide4,5.”
From Crystal structures of a double-barrelled fluoride ion channel (2015) · cites this paper as [4]
In the citing paper
“Nearly all microorganisms possess membrane proteins dedicated to the export of fluoride ion (F−).”
From Membrane exporters of fluoride ion (2021) · cites this paper as [3]
In the citing paper
“These proteins belong to one of two families, each with a completely different fold, and that export F− via fundamentally different mechanisms.”
From Membrane exporters of fluoride ion (2021) · cites this paper as [3]
In the citing paper
“The eukaryotic FEX proteins, like the CLCF proteins, have an inverted repeat architecture, in which two structurally homologous domains in a single polypeptide are arranged in opposite orientations(3, 26).”
From Membrane exporters of fluoride ion (2021) · cites this paper as [3]
Self-check
Percentages, sums and reported differences re-computed from the paper’s own numbers.
The self-check needs the paper’s full text.
Citations
Cites
Metalloproteins and metal sensing
Waldron, K. J., Rutherford, J. C., Ford, D., & Robinson, N. J. (2009) · Nature · doi:10.1038/nature08300 · Cited by 1,269
Bacterial fluoride resistance, Fluc channels, and the weak acid accumulation effect
Ji, C., Stockbridge, R. B., & Miller, C. (2014) · Journal of General Physiology · doi:10.1085/jgp.201411243 · Cited by 97
Stefan, C. P., Zhang, N., Sokabe, T., Rivetta, A., Slayman, C. L., Montell, C., & Cunningham, K. W. (2013) · Eukaryotic Cell · doi:10.1128/ec.00299-12 · Cited by 32
Self-citation
Research works printed but not linked: 52
- Jagtap, 2012, Fluoride in drinking water and defluoridation of water, Chem. Rev, 112, 2454, 10.1021/cr2002855 · DOI
- Smith, 1977, Airborne fluorides and man: Part I, CRC Crit. Rev. Environ. Control, 8, 293, 10.1080/10643387709381665 · DOI
- Lesher, 1977, Bacteriolytic action of fluoride ions, Antimicrob. Agents Chemother, 12, 339, 10.1128/AAC.12.3.339 · DOI · Paper page
- Baker, 2012, Widespread genetic switches and toxicity resistance proteins for fluoride, Science, 335, 233, 10.1126/science.1215063 · DOI · Paper page
- Barbier, 2010, Molecular mechanisms of fluoride toxicity, Chem. Biol. Interact, 188, 319, 10.1016/j.cbi.2010.07.011 · DOI · Paper page
- Lebioda, 1993, Fluoride inhibition of yeast enolase: crystal structure of the enolase-Mg2+-F−-Pi complex at 2.6 A resolution, Proteins, 16, 219, 10.1002/prot.340160302 · DOI · Paper page
- Agalakova, 2012, Molecular mechanisms of cytotoxicity and apoptosis induced by inorganic fluoride, ISRN Cell Biol, 2012, 1, 10.5402/2012/403835 · DOI
- Li, 2003, The biochemistry and physiology of metallic fluoride: action, mechanism, and implications, Crit. Rev. Oral Biol. Med, 14, 100, 10.1177/154411130301400204 · DOI
- Adamek, 2005, In vitro and in vivo effects of fluoride ions on enzyme activity, Ann. Acad. Med. Stetin, 51, 69
- Stockbridge, 2012, Fluoride resistance and transport by riboswitch-controlled CLC antiporters, Proc. Natl. Acad. Sci. U.S.A, 109, 15289, 10.1073/pnas.1210896109 · DOI · Paper page
- Stockbridge, 2013, A family of fluoride-specific ion channels with dual-topology architecture, eLife, 2
- Li, 2013, Eukaryotic resistance to fluoride toxicity mediated by a widespread family of fluoride export proteins, Proc. Natl. Acad. Sci. U.S.A, 110, 19018, 10.1073/pnas.1310439110 · DOI · Paper page
- Stockbridge, 2014, Proof of dual-topology architecture of Fluc F− channels with monobody blockers, Nat. Commun, 5, 10.1038/ncomms6120 · DOI · Paper page
- Rapp, 2006, Identification and evolution of dual-topology membrane proteins, Nat. Struct. Mol. Biol, 13, 112, 10.1038/nsmb1057 · DOI
- Morrison, 2012, Antiparallel EmrE exports drugs by exchanging between asymmetric structures, Nature, 481, 45, 10.1038/nature10703 · DOI · Paper page
- Wysocki, 2010, How Saccharomyces cerevisiae copes with toxic metals and metalloids, FEMS Microbiol. Rev, 34, 925, 10.1111/j.1574-6976.2010.00217.x · DOI
- Wright, 1996, Amino acid substitutions in membrane-spanning domains of Hol1, a member of the major facilitator superfamily of transporters, confer nonselective cation uptake in Saccharomyces cerevisiae, J. Bacteriol, 178, 7197, 10.1128/jb.178.24.7197-7205.1996 · DOI
- Dos Santos, 2014, MFS transporters required for multidrug/multixenobiotic (MD/MX) resistance in the model yeast: understanding their physiological function through post-genomic approaches, Front. Physiol, 5, 180, 10.3389/fphys.2014.00180 · DOI
- Adle, 2007, A cadmium-transporting P1B-type ATPase in yeast Saccharomyces cerevisiae, J. Biol. Chem, 282, 947, 10.1074/jbc.M609535200 · DOI
- Adle, 2008, Expressional control of a cadmium-transporting P1B-type ATPase by a metal sensing degradation signal, J. Biol. Chem, 283, 31460, 10.1074/jbc.M806054200 · DOI
- Adle, 2009, Cadmium-mediated rescue from ER-associated degradation induces expression of its exporter, Proc. Natl. Acad. Sci. U.S.A, 106, 10189, 10.1073/pnas.0812114106 · DOI
- Sherman, 2002, Getting started with yeast, Methods Enzymol, 350, 3, 10.1016/S0076-6879(02)50954-X · DOI · Paper page
- Bertl, 1998, Electrophysiology in the eukaryotic model cell Saccharomyces cerevisiae, Pflugers Arch, 436, 999, 10.1007/s004240050735 · DOI
- Kuroda, 2004, Chloride channel function in the yeast TRK-potassium transporters, J. Membr. Biol, 198, 177, 10.1007/s00232-004-0671-1 · DOI
- Antebi, 1992, The yeast Ca(2+)-ATPase homologue, PMR1, is required for normal Golgi function and localizes in a novel Golgi-like distribution, Mol. Biol. Cell, 3, 633, 10.1091/mbc.3.6.633 · DOI
- Bihler, 1999, The presumed potassium carrier Trk2p in Saccharomyces cerevisiae determines an H+-dependent, K+-independent current, FEBS Lett, 447, 115, 10.1016/S0014-5793(99)00281-1 · DOI
- Miranda, 2001, Stalk segment 5 of the yeast plasma membrane H+-ATPase: mutational evidence for a role in glucose regulation, J. Biol. Chem, 276, 22485, 10.1074/jbc.M102332200 · DOI
- Rivetta, 2013, Coordination of K+ transporters in neurospora: TRK1 is scarce and constitutive, while HAK1 is abundant and highly regulated, Eukaryot. Cell, 12, 684, 10.1128/EC.00017-13 · DOI
- Lowry, 1951, Protein measurement with the Folin phenol reagent, J. Biol. Chem, 193, 265, 10.1016/S0021-9258(19)52451-6 · DOI
- Bähler, 1998, Heterologous modules for efficient and versatile PCR-based gene targeting in Schizosaccharomyces pombe, Yeast, 14, 943, 10.1002/(SICI)1097-0061(199807)14:10<943::AID-YEA292>3.0.CO;2-Y · DOI
- Gietz, 1995, Studies on the transformation of intact yeast cells by the LiAc/SS-DNA/PEG procedure, Yeast, 11, 355, 10.1002/yea.320110408 · DOI
- Brachmann, 1998, Designer deletion strains derived from Saccharomyces cerevisiae S288C: a useful set of strains and plasmids for PCR-mediated gene disruption and other applications, Yeast, 14, 115, 10.1002/(SICI)1097-0061(19980130)14:2<115::AID-YEA204>3.0.CO;2-2 · DOI
- Christianson, 1992, Multifunctional yeast high-copy-number shuttle vectors, Gene, 110, 119, 10.1016/0378-1119(92)90454-W · DOI
- Lee, 2012, Glycosylatable GFP as a compartment-specific membrane topology reporter, Biochem. Biophys. Res. Commun, 427, 780, 10.1016/j.bbrc.2012.09.138 · DOI
- Mumberg, 1995, Yeast vectors for the controlled expression of heterologous proteins in different genetic backgrounds, Gene, 156, 119, 10.1016/0378-1119(95)00037-7 · DOI
- Barrick, 2007, The distributions, mechanisms, and structures of metabolite-binding riboswitches, Genome Biol, 8, R239, 10.1186/gb-2007-8-11-r239 · DOI
- Heijne, 1986, The distribution of positively charged residues in bacterial inner membrane proteins correlates with the trans-membrane topology, EMBO J, 5, 3021, 10.1002/j.1460-2075.1986.tb04601.x · DOI
- Krogh, 2001, Predicting transmembrane protein topology with a hidden Markov model: application to complete genomes, J. Mol. Biol, 305, 567, 10.1006/jmbi.2000.4315 · DOI · Paper page
- Käll, 2007, Advantages of combined transmembrane topology and signal peptide prediction–the Phobius web server, Nucleic Acids Res, 35, W429, 10.1093/nar/gkm256 · DOI
- Pei, 2008, PROMALS3D: a tool for multiple protein sequence and structure alignments, Nucleic Acids Res, 36, 2295, 10.1093/nar/gkn072 · DOI
- Blatt, 1987, Potassium-proton symport in Neurospora: kinetic control by pH and membrane potential, J. Membr. Biol, 98, 169, 10.1007/BF01872129 · DOI
- Kropf, 1986, Electrophysiological properties of Achlya hyphae: ionic currents studied by intracellular potential recording, J. Cell Biol, 102, 1209, 10.1083/jcb.102.4.1209 · DOI
- Madrid, 1998, Ectopic potassium uptake in trk1 trk2 mutants of Saccharomyces cerevisiae correlates with a highly hyperpolarized membrane potential, J. Biol. Chem, 273, 14838, 10.1074/jbc.273.24.14838 · DOI
- Huang, 2003, Structure and mechanism of the glycerol-3-phosphate transporter from Escherichia coli, Science, 301, 616, 10.1126/science.1087619 · DOI
- Law, 2009, Structural basis of substrate selectivity in the glycerol-3-phosphate: phosphate antiporter GlpT, Biophys J, 97, 1346, 10.1016/j.bpj.2009.06.026 · DOI
- Lloris-Garcerá, 2014, Why have small multidrug resistance proteins not evolved into fused, internally duplicated structures?, J. Mol. Biol, 426, 2246, 10.1016/j.jmb.2014.03.012 · DOI
- Javadpour, 1999, Helix packing in polytopic membrane proteins: role of glycine in transmembrane helix association, Biophys. J, 77, 1609, 10.1016/S0006-3495(99)77009-8 · DOI
- Ubarretxena-Belandia, 2001, Helical membrane proteins: diversity of functions in the context of simple architecture, Curr. Opin. Struct. Biol, 11, 370, 10.1016/S0959-440X(00)00217-7 · DOI
- Muth, 2000, A membrane-embedded glutamate is required for ligand binding to the multidrug transporter EmrE, EMBO J, 19, 234, 10.1093/emboj/19.2.234 · DOI
- Yerushalmi, 2000, An essential glutamyl residue in EmrE, a multidrug antiporter from Escherichia coli, J. Biol. Chem, 275, 5264, 10.1074/jbc.275.8.5264 · DOI
- Modi, 2013, Role of the central arginine R133 toward the ion selectivity of the phosphate specific channel OprP: effects of charge and solvation, Biochemistry, 52, 5522, 10.1021/bi400522b · DOI
- Yang, 2014, Structure and selectivity in bestrophin ion channels, Science, 346, 355, 10.1126/science.1259723 · DOI
Cited by
Sorted by citations
Crystal structures of a double-barrelled fluoride ion channel
Stockbridge, R. B., Kolmakova-Partensky, L., Shane, T., Koide, A., Koide, S., Miller, C., & Newstead, S. (2015) · Nature · doi:10.1038/nature14981 · Cited by 119
Stockbridge, R. B., & Wackett, L. P. (2024) · Nature Communications · doi:10.1038/s41467-024-49018-1 · Cited by 80
Membrane exporters of fluoride ion
McIlwain, B. C., Ruprecht, M. T., & Stockbridge, R. B. (2021) · Annual Review of Biochemistry · doi:10.1146/annurev-biochem-071520-112507 · Cited by 69
Banerjee, A., Kang, C.-Y., An, M., Koff, B. B., Sunder, S., Kumar, A., Tenuta, L. M. A., & Stockbridge, R. B. (2024) · mBio · doi:10.1128/mbio.00184-24 · Cited by 17
Metadata
- Authors
- Smith, K. D., Gordon, P. B., Rivetta, A., Allen, K. E., Berbasova, T., Slayman, C., & Strobel, S. A.
- Venue
- Journal of Biological Chemistry
- Publisher
- Elsevier BV
- Published
- 2015-08
- Volume
- 290
- Issue
- 32
- Pages
- 19874-19887
- ISSN
- 0021-9258
- Cited by
- 41
- References
- 3
- Language
- en
- Licence
- Funders
- National Institutes of Health (GM60696, GM022778)
About these checks
Registry, retraction, Cites and statistics results are computed, not judged, with one exception: a printed reference that no index lists is read once by a model before it counts as a citation error. Claims are extracted by a model and kept only when their quote appears verbatim in the text; each cited source is then checked, with a model’s help, for whether it says what the claim relies on. Those verdicts can be wrong — read the claim’s quote and the cited source before relying on one.
Statistics and arithmetic are recomputed, not judged.
Confidence bands are shown only for fields calibrated on our annotated test set. None is calibrated yet, so no band is shown.
What counts as a claim ›How we measure confidence ›How we check this ›
Are you an author, or do you see a problem with this page? Request a review
