

The DOI matches its Crossref record; 54 of the 54 references it cites were found in a registry or an index.
The Age Lipid A2E and Mitochondrial Dysfunction Synergistically Impair Phagocytosis by Retinal Pigment Epithelial Cells
Open accessAbstract
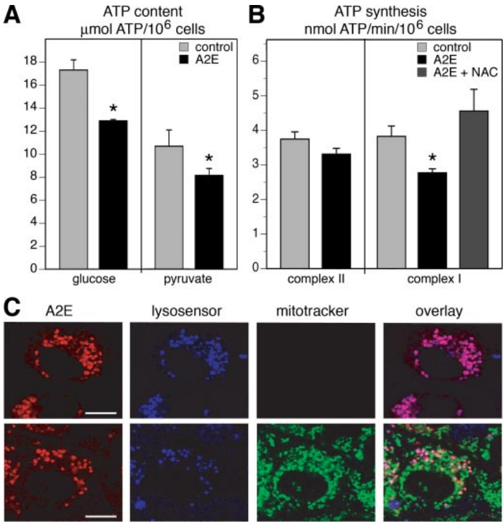
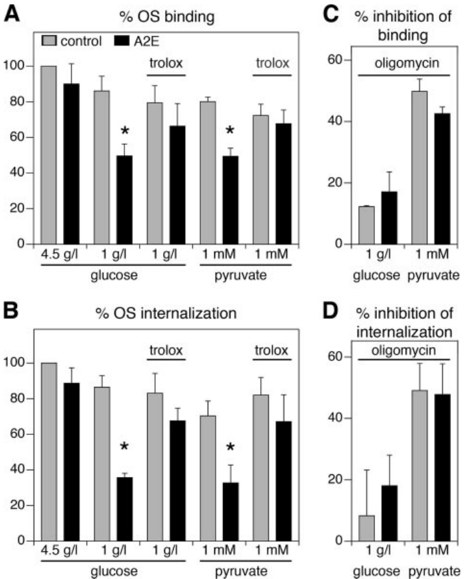
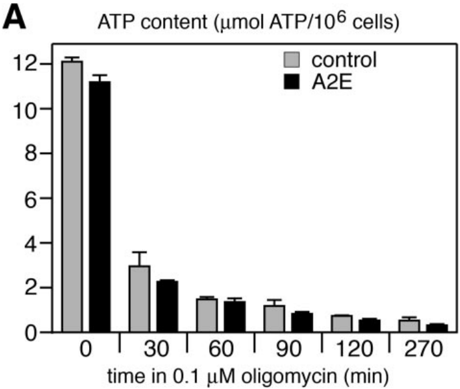
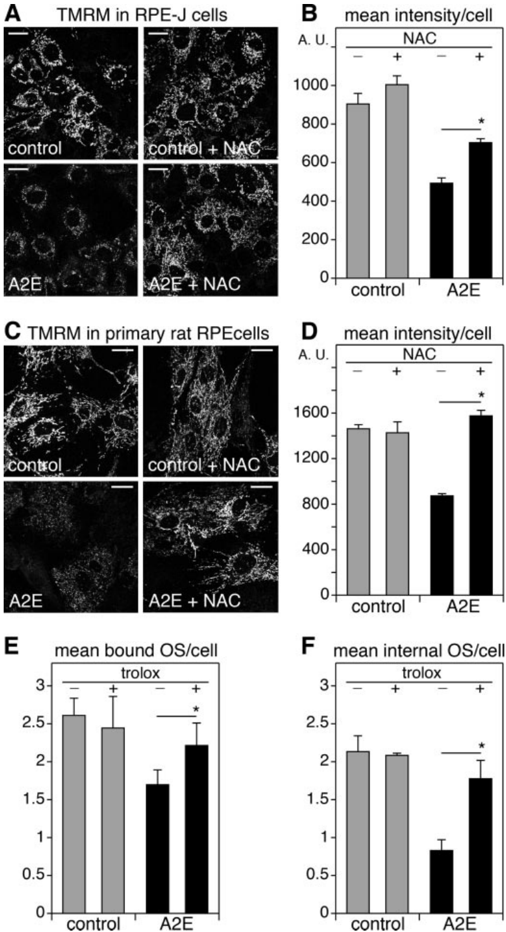
Accumulation of indigestible lipofuscin and decreased mitochondrial energy production are characteristic age-related changes of post-mitotic retinal pigment epithelial (RPE) cells in the human eye. To test whether these two forms of age-related impairment have interdependent effects, we quantified the ATP-dependent phagocytic function of RPE cells loaded or not with the lipofuscin component A2E and inhibiting or not mitochondrial ATP synthesis either pharmacologically or genetically. We found that physiological levels of lysosomal A2E reduced mitochondrial membrane potential and inhibited oxidative phosphorylation (OXPHOS) of RPE cells. Furthermore, in media with physiological concentrations of glucose or pyruvate, A2E significantly inhibited phagocytosis. Antioxidants reversed these effects of A2E, suggesting that A2E damage is mediated by oxidative processes. Because mitochondrial mutations accumulate with aging, we generated novel genetic cellular models of RPE carrying mitochondrial DNA point mutations causing either moderate or severe mitochondrial dysfunction. Exploring these mutant RPE cells we found that, by itself, only the severe but not the moderate OXPHOS defect reduces phagocytosis. However, sub-toxic levels of lysosomal A2E are sufficient to reduce phagocytic activity of RPE with moderate OXPHOS defect and cause cell death of RPE with severe OXPHOS defect. Taken together, RPE cells rely on OXPHOS for phagocytosis when the carbon energy source is limited. Our results demonstrate that A2E accumulation exacerbates the effects of moderate mitochondrial dysfunction. They suggest that synergy of sub-toxic lysosomal and mitochondrial changes in RPE cells with age may cause RPE dysfunction that is known to contribute to human retinal diseases like age-related macular degeneration.
Overview
The claims and statistics of this paper haven’t been checked yet.
Run the check — free, no account needed. It reads the open-access text and checks the sources it cites.
Integrity signals
Registry
Cites
Statistics
Figures
Verification
Claims the paper makes
The claims and statistics of this paper haven’t been checked yet.
Run the check — free, no account needed. It reads the open-access text and checks the sources it cites.
Claims other papers make about this one
Each is checked against this paper’s own text: does it say what the citing paper says it does?
In the citing paper
“A2E (a by-product of phototransduction, present in lipofuscin) and mitochondrial dysfunction are reported to impair RPE phagocytosis and activate the complement system (156, 178).”
From Unraveling a Multifactorial Late-Onset Disease: From Genetic Susceptibility to Disease Mechanisms for Age-Related Macular Degeneration (2009) · cites this paper as [156]
Self-check
Percentages, sums and reported differences re-computed from the paper’s own numbers.
The self-check needs the paper’s full text.
Citations
Cites
Mitochondrial free radical generation, oxidative stress, and aging
Cadenas, E., & Davies, K. J. A. (2000) · Free Radical Biology and Medicine · doi:10.1016/s0891-5849(00)00317-8 · Cited by 3,010
The Retinal Pigment Epithelium in Visual Function
Strauss, O. (2005) · Physiological Reviews · doi:10.1152/physrev.00021.2004 · Cited by 2,828
Human Cells Lacking mtDNA: Repopulation with Exogenous Mitochondria by Complementation
King, M. P., & Attardi, G. M. (1989) · Science · doi:10.1126/science.2814477 · Cited by 1,685
Shoffner, J. M., Lott, M. T., Lezza, A. M. S., Seibel, P., Ballinger, S. W., & Wallace, D. C. (1990) · Cell · doi:10.1016/0092-8674(90)90059-n · Cited by 1,476
Human cells lacking mtDNA: repopulation with exogenous mitochondria by complementation
(1990) · Trends in Genetics · doi:10.1016/0168-9525(90)90040-d · Cited by 1,386
Current concepts in the pathogenesis of age-related macular degeneration
Zarbin, M. A. (2004) · Archives of Ophthalmology · doi:10.1001/archopht.122.4.598 · Cited by 1,006
A new mitochondrial disease associated with mitochondrial DNA heteroplasmy.
Holt, I. J., Harding, A. E., Petty, R., & MORGAN-HUGHES, J. A. (1990) · PubMed · Cited by 1,004
The Free Radical Theory of Aging
Harman, D. (2003) · Antioxidants and Redox Signaling · doi:10.1089/152308603770310202 · Cited by 935
INHERITED RETINAL DYSTROPHY IN THE RAT
Dowling, J. E., & Sidman, R. L. (1962) · The Journal of Cell Biology · doi:10.1083/jcb.14.1.73 · Cited by 803
The mitochondrial‐lysosomal axis theory of aging
Brunk, U. T., & Terman, A. (2002) · European Journal of Biochemistry · doi:10.1046/j.1432-1033.2002.02869.x · Cited by 729
Research works printed but not linked: 9
- Feeney, 1978, Invest. Ophthalmol. Vis. Sci., 17, 583
- Sparrow, 1999, Invest. Ophthalmol. Vis. Sci., 40, 2988
- Del Priore, 2002, Invest. Ophthalmol. Vis. Sci., 43, 3312
- Barron, 2001, Invest. Ophthalmol. Vis. Sci., 42, 3016
- Holt, 1990, Am. J. Hum. Genet., 46, 428
- Molday, 1987, Invest. Ophthalmol. Vis. Sci., 28, 50
- Holz, 1999, Invest. Ophthalmol. Vis. Sci., 40, 737
- Schutt, 2000, Invest. Ophthalmol. Vis. Sci., 41, 2303
- Sparrow, 2000, Invest. Ophthalmol. Vis. Sci., 41, 1981
Cited by
Sorted by citations
PINK1-dependent recruitment of Parkin to mitochondria in mitophagy
Vives-Bauza, C., Zhou, C., Huang, Y., Cui, M., de Vries, R. L. A., Kim, J., May, J., Tocilescu, M. A., Liu, W., Ko, H. S., et al. (2010) · Proceedings of the National Academy of Sciences · doi:10.1073/pnas.0911187107 · Cited by 1,616
Mechanisms of mitochondrial dysfunction and their impact on age-related macular degeneration
Kaarniranta, K., Uusitalo, H. M. T., Błasiak, J., Felszeghy, S., Kannan, R., Kauppinen, A., Salminen, A., Sinha, D., & Ferrington, D. A. (2020) · Progress in Retinal and Eye Research · doi:10.1016/j.preteyeres.2020.100858 · Cited by 548
Noncanonical autophagy promotes the visual cycle
Kim, J.-Y., Zhao, H., Martinez, J., Doggett, T. A., Kolesnikov, A. V., Tang, P. H., Ablonczy, Z., Chan, C.-C., Zhou, Z., Green, D. R., et al. (2013) · Cell · doi:10.1016/j.cell.2013.06.012 · Cited by 347
Kaarniranta, K., Sinha, D., Blasiak, J., Kauppinen, A., Veréb, Z., Salminen, A., Boulton, M. E., & Petrovski, G. (2013) · Autophagy · doi:10.4161/auto.24546 · Cited by 326
Zhao, C., Yasumura, D., Li, X., Matthes, M., Lloyd, M., Nielsen, G., Ahern, K., Snyder, M., Bok, D., Dunaief, J. L., et al. (2011) · Journal of Clinical Investigation · doi:10.1172/jci44303 · Cited by 303
Mitochondrial DNA damage and its potential role in retinal degeneration
Jarrett, S. G., Lin, H., Godley, B. F., & Boulton, M. (2008) · Progress in Retinal and Eye Research · doi:10.1016/j.preteyeres.2008.09.001 · Cited by 279
Transcriptome analysis and molecular signature of human retinal pigment epithelium
Strunnikova, N. V., Maminishkis, A., Barb, J. J., Wang, F., Zhi, C., Sergeev, Y., Chen, W., Edwards, A. O., Stambolian, D., Abecasis, G., et al. (2010) · Human Molecular Genetics · doi:10.1093/hmg/ddq129 · Cited by 269
Swaroop, A., Chew, E. Y., Bowes Rickman, C., & Abecasis, G. R. (2009) · Annual Review of Genomics and Human Genetics · doi:10.1146/annurev.genom.9.081307.164350 · Cited by 270
Ferrington, D. A., Sinha, D., & Kaarniranta, K. (2016) · Progress in Retinal and Eye Research · doi:10.1016/j.preteyeres.2015.09.002 · Cited by 241
Marie, M., Bigot, K., Angebault, C., Barrau, C., Gondouin, P., Pagan, D., Fouquet, S., Villette, T., Sahel, J., Lenaers, G., et al. (2018) · Cell Death and Disease · doi:10.1038/s41419-018-0331-5 · Cited by 164
Magrané, J., Garner, M. A., Przedborski, S., Estévez, Á. G., & Manfredi, G. (2012) · Journal of Neuroscience · doi:10.1523/jneurosci.1233-11.2012 · Cited by 151
Self-citationMitochondria as Potential Targets and Initiators of the Blue Light Hazard to the Retina
Tao, J., Zhou, W., & Zhu, X.-G. (2019) · Oxidative Medicine and Cellular Longevity · doi:10.1155/2019/6435364 · Cited by 125
Phagocyte dysfunction, tissue aging and degeneration
Li, W. (2013) · Ageing Research Reviews · doi:10.1016/j.arr.2013.05.006 · Cited by 116
Mechanisms for Countering Oxidative Stress and Damage in Retinal Pigment Epithelium
Plafker, S. M., O'Mealey, G. B., & Szweda, L. I. (2012) · International review of cytology · doi:10.1016/b978-0-12-394309-5.00004-3 · Cited by 121
Retinoids for treatment of retinal diseases
Palczewski, K. (2010) · Trends in Pharmacological Sciences · doi:10.1016/j.tips.2010.03.001 · Cited by 111
Structure and function of ABCA4 and its role in the visual cycle and Stargardt macular degeneration
Molday, R. S., Garces, F. A., Scortecci, J. F., & Molday, L. L. (2022) · Progress in Retinal and Eye Research · doi:10.1016/j.preteyeres.2021.101036 · Cited by 107
Cholesterol metabolism: physiological regulation and diseases
Guo, J., Chen, S., Zhang, Y., Liu, J., Jiang, L., Hu, L., Yao, K., Yu, Y., & Chen, X. (2024) · MedComm · doi:10.1002/mco2.476 · Cited by 115
Alaimo, A., Liñares, G. G., Bujjamer, J. M., Gorojod, R. M., Alcon, S. P., Martínez, J. H., Baldessari, A., Grecco, H. E., & Kotler, M. L. (2019) · Archives of Toxicology · doi:10.1007/s00204-019-02409-6 · Cited by 97
Retinal Photodamage Mediated by All‐trans‐retinal†
Maeda, T., Golczak, M., & Maeda, A. (2012) · Photochemistry and Photobiology · doi:10.1111/j.1751-1097.2012.01143.x · Cited by 92
Schütt, F., Aretz, S., Auffarth, G. U., & Kopitz, J. (2012) · Investigative Ophthalmology & Visual Science · doi:10.1167/iovs.12-9845 · Cited by 92
Studying melanin and lipofuscin in RPE cell culture models
Boulton, M. E. (2014) · Experimental Eye Research · doi:10.1016/j.exer.2014.01.016 · Cited by 97
Limited Roles of Rdh8, Rdh12, and Abca4 in all- trans -Retinal Clearance in Mouse Retina
Maeda, A., Golczak, M., Maeda, T., & Palczewski, K. (2009) · Investigative Ophthalmology & Visual Science · doi:10.1167/iovs.09-3944 · Cited by 94
Lysosomes: regulators of autophagy in the retinal pigmented epithelium
Sinha, D., Valapala, M., Shang, P., Hose, S., Grebe, R., Lutty, G. A., Zigler, J. S., Kaarniranta, K., & Handa, J. T. (2016) · Experimental Eye Research · doi:10.1016/j.exer.2015.08.018 · Cited by 88
Mitochondrial DNA background modifies the bioenergetics of NARP/MILS ATP6 mutant cells
D’Aurelio, M., Vives-Bauzá, C., Davidson, M. M., & Manfredi, G. (2009) · Human Molecular Genetics · doi:10.1093/hmg/ddp503 · Cited by 90
Self-citationRetina, retinol, retinal and the natural history of vitamin A as a light sensor
Zhong, M., Kawaguchi, R., Kassai, M., & Sun, H. (2012) · Nutrients · doi:10.3390/nu4122069 · Cited by 89
Mitochondrial Retinal Dystrophy Associated with the m.3243A>G Mutation
de Laat, P., Smeitink, J. A. M., Janssen, M. C. H., KEUNEN, J. E. E., & Boon, C. J. F. (2013) · Ophthalmology · doi:10.1016/j.ophtha.2013.05.013 · Cited by 87
Increased retinal mtDNA damage in the CFH variant associated with age-related macular degeneration
Ferrington, D. A., Kapphahn, R. J., Leary, M. M., Atilano, S. R., Terluk, M. R., Karunadharma, P., Chen, G. K.-J., Ratnapriya, R., Swaroop, A., Montezuma, S. R., et al. (2016) · Experimental Eye Research · doi:10.1016/j.exer.2016.01.018 · Cited by 85
Defective lipid transport and biosynthesis in recessive and dominant Stargardt macular degeneration
Molday, R. S., & Zhang, K. (2010) · Progress in Lipid Research · doi:10.1016/j.plipres.2010.07.002 · Cited by 82
The aging rat retina: from function to anatomy
Nadal-Nicolás, F. M., Vidal‐Sanz, M., & Agudo‐Barriuso, M. (2017) · Neurobiology of Aging · doi:10.1016/j.neurobiolaging.2017.09.021 · Cited by 83
Klettner, A., Kauppinen, A., Błasiak, J., Roider, J., Salminen, A., & Kaarniranta, K. (2013) · The International Journal of Biochemistry & Cell Biology · doi:10.1016/j.biocel.2013.04.013 · Cited by 83
Lukinova, N. I., Iacovelli, J., Dentchev, T., Wolkow, N., Hunter, A. A., Amado, D. A., Ying, G., Sparrow, J. R., & Dunaief, J. L. (2009) · Investigative Ophthalmology & Visual Science · doi:10.1167/iovs.08-2545 · Cited by 70
Nakamura, M., Yako, T., Kuse, Y., Inoue, Y., Nishinaka, A., Nakamura, S., Shimazawa, M., & Hara, H. (2018) · Experimental Eye Research · doi:10.1016/j.exer.2018.07.022 · Cited by 71
Parinot, C., Rieu, Q., Chatagnon, J., Finnemann, S. C., & Nandrot, E. F. (2014) · Journal of Visualized Experiments · doi:10.3791/52100 · Cited by 69
Self-citationShiose, S., Chen, Y., Okano, K., Roy, S., Kohno, H., Tang, J. C. O., Pearlman, E. M., Maeda, T., Palczewski, K., & Maeda, A. (2011) · Journal of Biological Chemistry · doi:10.1074/jbc.m111.228551 · Cited by 66
Estrogen Signalling in the Pathogenesis of Age-Related Macular Degeneration
Kaarniranta, K., Machalińska, A., Veréb, Z., Salminen, A., Petrovski, G., & Kauppinen, A. (2014) · Current Eye Research · doi:10.3109/02713683.2014.925933 · Cited by 64
Age-Related Macular Degeneration: Clinical Findings, Histopathology and Imaging Techniques
Zarbin, M. A., Casaroli-Marano, R. P., & Rosenfeld, P. J. (2014) · Developments in ophthalmology · doi:10.1159/000358536 · Cited by 66
Mueller, E. E., Schaier, E., Brunner, S. M., Eder, W., Mayr, J. A., Egger, S. F., Nischler, C., Oberkofler, H., Reitsamer, H. A., Patsch, W., et al. (2012) · PLoS ONE · doi:10.1371/journal.pone.0030874 · Cited by 62
Yu, C.-C., Nandrot, E. F., Dun, Y., & Finnemann, S. C. (2011) · Free Radical Biology and Medicine · doi:10.1016/j.freeradbiomed.2011.11.021 · Cited by 62
Self-citationStrunnikova, N., Barb, J. J., Sergeev, Y. V., Thiagarajasubramanian, A. K., Silvin, C. J., Munson, P. J., & MacDonald, I. M. (2009) · PLoS ONE · doi:10.1371/journal.pone.0008402 · Cited by 61
Drugs in Phase II clinical trials for the treatment of age-related macular degeneration
Tolentino, M. J., Dennrick, A., John, E. S., & Tolentino, M. S. (2014) · Expert Opinion on Investigational Drugs · doi:10.1517/13543784.2015.961601 · Cited by 60
Oxidative stress in dry age-related macular degeneration and exfoliation syndrome
Chiras, D., Kitsos, G., Petersen, M. B., Skalidakis, I., & Κroupis, C. (2014) · Critical Reviews in Clinical Laboratory Sciences · doi:10.3109/10408363.2014.968703 · Cited by 56
Cioffi, C. L., Dobri, N., Freeman, E. E., Conlon, M. P., Chen, P., Stafford, D. G., Schwarz, D. M. C., Golden, K. C., Zhu, L., Kitchen, D. B., et al. (2014) · Journal of Medicinal Chemistry · doi:10.1021/jm5010013 · Cited by 57
Genomic aspects of age-related macular degeneration
Horie‐Inoue, K., & Inoue, S. (2014) · Biochemical and Biophysical Research Communications · doi:10.1016/j.bbrc.2014.08.013 · Cited by 54
Parmar, V. M., Parmar, T., Arai, E., Perusek, L., & Maeda, A. (2018) · Stem Cell Research · doi:10.1016/j.scr.2018.01.014 · Cited by 54
CNTF Mediates Neurotrophic Factor Secretion and Fluid Absorption in Human Retinal Pigment Epithelium
Li, R., Wen, R., Banzon, T. M., Maminishkis, A., & Miller, S. S. (2011) · PLoS ONE · doi:10.1371/journal.pone.0023148 · Cited by 54
Crouch, R. K., Koutalos, Y., Kono, M., Schey, K. L., & Ablonczy, Z. (2015) · Progress in molecular biology and translational science · doi:10.1016/bs.pmbts.2015.06.005 · Cited by 56
Tear film proteome in age-related macular degeneration
Winiarczyk, M., Kaarniranta, K., Winiarczyk, S., Adaszek, Ł., Winiarczyk, D., & Mackiewicz, J. (2018) · Graefe s Archive for Clinical and Experimental Ophthalmology · doi:10.1007/s00417-018-3984-y · Cited by 51
Donato, L., Scimone, C., Alibrandi, S., Pitruzzella, A., Scalia, F., D’Angelo, R., & Sidoti, A. (2020) · Antioxidants · doi:10.3390/antiox9111158 · Cited by 50
Intracellular bevacizumab reduces phagocytotic uptake in RPE cells
Klettner, A., Möhle, F., & Roider, J. B. (2010) · Graefe s Archive for Clinical and Experimental Ophthalmology · doi:10.1007/s00417-010-1317-x · Cited by 49
Lipofuscin can be eliminated from the retinal pigment epithelium of monkeys
Julien, S., & Schraermeyer, U. (2012) · Neurobiology of Aging · doi:10.1016/j.neurobiolaging.2011.12.009 · Cited by 49
CIB2 regulates mTORC1 signaling and is essential for autophagy and visual function
Sethna, S., Scott, P. A., Giese, A. P. J., Duncan, T. E., Jian, X., Riazuddin, S. A., Randazzo, P. A., Redmond, T. M., Bernstein, S. L., Riazuddin, S., et al. (2021) · Nature Communications · doi:10.1038/s41467-021-24056-1 · Cited by 47
Lieffrig, S. A., Gyimesi, G., Mao, Y., & Finnemann, S. C. (2023) · Immunological Reviews · doi:10.1111/imr.13264 · Cited by 50
Self-citationHigh-density lipoproteins are a potential therapeutic target for age-related macular degeneration
Kelly, U., Grigsby, D., Cady, M. A., Landowski, M., Skiba, N. P., Liu, J., Remaley, A. T., Klingeborn, M., & Rickman, C. B. (2020) · Journal of Biological Chemistry · doi:10.1074/jbc.ra119.012305 · Cited by 46
Sun, H. (2011) · Biochimica et Biophysica Acta (BBA) - Molecular and Cell Biology of Lipids · doi:10.1016/j.bbalip.2011.06.010 · Cited by 47
Piñero-Martos, E., Ortega-Vila, B., Pol-Fuster, J., Barroso, E. C., Ruiz-Guerra, L., Medina-Dols, A., Heine‐Suñer, D., Lladó, J., Olmos, G., & Vives-Bauzá, C. (2016) · Human Molecular Genetics · doi:10.1093/hmg/ddw250 · Cited by 45
Retinal Photodamage by Endogenous and Xenobiotic Agents†
Wielgus, A. R., & Roberts, J. E. (2012) · Photochemistry and Photobiology · doi:10.1111/j.1751-1097.2012.01174.x · Cited by 44
Wielgus, A. R., Chignell, C. F., Ceger, P. C., & Roberts, J. E. (2010) · Photochemistry and Photobiology · doi:10.1111/j.1751-1097.2010.00750.x · Cited by 46
Kaarniranta, K., Koskela, A. K. J., Felszeghy, S., Kivinen, N., Salminen, A., & Kauppinen, A. (2018) · Biochimie · doi:10.1016/j.biochi.2018.07.010 · Cited by 44
Dong, P.-X., Wan, B., Wang, Z.-X., Guo, L.-H., Yang, Y., & Zhao, L. (2013) · Nanotoxicology · doi:10.3109/17435390.2012.694487 · Cited by 42
Rácz, B., Váradi, A., Kong, J., Allikmets, R. L., Pearson, P. G., Johnson, G., Cioffi, C. L., & Petrukhin, K. E. (2018) · Journal of Biological Chemistry · doi:10.1074/jbc.ra118.002062 · Cited by 40
Retinal Diseases Regulated by Hypoxia—Basic and Clinical Perspectives: A Comprehensive Review
Shinojima, A., Lee, D., Tsubota, K., Negishi, K., & Kurihara, T. (2021) · Journal of Clinical Medicine · doi:10.3390/jcm10235496 · Cited by 45
Jaadane, I., Rodriguez, G. E. V., Boulenguez, P., Carré, S., Dassieni, I., Lebon, C., Chahory, S., Béhar‐Cohen, F., Martinsons, C., & Torriglia, A. (2020) · Scientific Reports · doi:10.1038/s41598-020-63442-5 · Cited by 39
Petrukhin, K. E. (2013) · Drug Discovery Today Therapeutic Strategies · doi:10.1016/j.ddstr.2013.05.004 · Cited by 39
Bhattacharya, S., Yin, J., Huo, W., & Chaum, E. (2022) · Stem Cell Research & Therapy · doi:10.1186/s13287-022-02937-6 · Cited by 35
Cioffi, C. L., Rácz, B., Freeman, E. E., Conlon, M. P., Chen, P., Stafford, D. G., Schwarz, D. M. C., Zhu, L., Kitchen, D. B., Barnes, K. D., et al. (2015) · Journal of Medicinal Chemistry · doi:10.1021/acs.jmedchem.5b00423 · Cited by 36
Fuma, S., Murase, H., Kuse, Y., Tsuruma, K., Shimazawa, M., & Hara, H. (2015) · Europe PMC (PubMed Central) · Cited by 33
Changing perceptions of hunger on a high nutrient density diet
Fuhrman, J., Sarter, B., Glaser, D. N., & Acocella, S. (2010) · Nutrition Journal · doi:10.1186/1475-2891-9-51 · Cited by 37
Maugeri, A., Barchitta, M., Mazzone, M. G., Giuliano, F., & Agodi, A. (2018) · BioMed Research International · doi:10.1155/2018/7532507 · Cited by 34
Koster, C., van den Hurk, K., ten Brink, J. B., Lewallen, C. F., Stanzel, B. V., Bharti, K., & Bergen, A. A. B. (2022) · International Journal of Molecular Sciences · doi:10.3390/ijms23062918 · Cited by 34
Protective effects of resveratrol and its analogs on age-related macular degeneration in vitro
Kang, J.-H., & Choung, S. (2016) · Archives of Pharmacal Research · doi:10.1007/s12272-016-0839-0 · Cited by 34
Cheng, Y.-S., Linetsky, M. D., Gu, X., Ayyash, N., Gardella, A., & Salomon, R. G. (2018) · Experimental Eye Research · doi:10.1016/j.exer.2018.09.012 · Cited by 36
Sparrow, J. R., Kim, S. R., & Wu, Y. (2010) · Methods in molecular biology · doi:10.1007/978-1-60327-325-1_18 · Cited by 31
Meleppat, R. K., Ronning, K. E., Karlen, S. J., Kothandath, K. K., Burns, M. E., Pugh, E. N., & Zawadzki, R. J. (2020) · Investigative Ophthalmology & Visual Science · doi:10.1167/iovs.61.13.1 · Cited by 31
Nagai, N., Kawashima, H., Toda, E., Homma, K., Osada, H., Mendoza, N. A. G., Shibata, S., Uchiyama, Y., Okano, H., Tsubota, K., et al. (2020) · Communications Biology · doi:10.1038/s42003-020-01483-2 · Cited by 32
Novel Role of ATPase Subunit C Targeting Peptides Beyond Mitochondrial Protein Import
Vives-Bauzá, C., Magrané, J., Andreu, A. L., & Manfredi, G. (2009) · Molecular Biology of the Cell · doi:10.1091/mbc.e09-06-0483 · Cited by 30
Self-citationMechanistical retinal drug targets and challenges
Kaarniranta, K., Xu, H., & Kauppinen, A. (2018) · Advanced Drug Delivery Reviews · doi:10.1016/j.addr.2018.04.016 · Cited by 28
Potential Therapeutic Agents Against Retinal Diseases Caused by Aberrant Metabolism of Retinoids
Liu, X., Chen, J., Liu, Z., Li, J., Yao, K., & Wu, Y. (2016) · Investigative Ophthalmology & Visual Science · doi:10.1167/iovs.15-18429 · Cited by 30
Adler, L., Boyer, N. P., Anderson, D. M., Spraggins, J. M., Schey, K. L., Hanneken, A. M., Ablonczy, Z., Crouch, R. K., & Koutalos, Y. (2015) · Photochemical & Photobiological Sciences · doi:10.1039/c5pp00156k · Cited by 28
Regulation of the rhythmic diversity of daily photoreceptor outer segment phagocytosis in vivo
Moran, A. L., Fehilly, J. D., Jones, D. F., Collery, R. F., & Kennedy, B. N. (2022) · The FASEB Journal · doi:10.1096/fj.202200990rr · Cited by 27
Multiple A2E treatments lead to melanization of rod outer segment-challenged ARPE-19 cells.
Poliakov, E., Strunnikova, N. V., Jiang, J., Martinez, B., Parikh, T. P., Lakkaraju, A., Thomas, C. J., Brooks, B. P., & Redmond, T. M. (2014) · Europe PMC (PubMed Central) · Cited by 27
Chichagova, V., Hallam, D., Collin, J., Buskin, A., Saretzki, G. C., Armstrong, L., Yu‐Wai‐Man, P., Lako, M., & STEEL, D. H. (2017) · Scientific Reports · doi:10.1038/s41598-017-12396-2 · Cited by 26
Farjood, F., Manos, J. D., Wang, Y., Williams, A. L., Zhao, C., Borden, S. M., Alam, N. M., Prusky, G. T., Temple, S., Stern, J. H., et al. (2023) · The Journal of Experimental Medicine · doi:10.1084/jem.20230913 · Cited by 25
Bittencourt, M. G., Hassan, M., Halim, M. S., Afridi, R., Nguyen, N. V., Plaza, C., Tran, A. N. T., Ibrahim, M., Nguyen, Q. D., & Sepah, Y. J. (2019) · Journal of Ophthalmic Inflammation and Infection · doi:10.1186/s12348-018-0167-2 · Cited by 24
Tien, P., Lin, H., Tsai, Y., Lim, Y.-P., Chen, C. S., Chang, C., Lin, C.-J., Chen, J. J.-Y., Wu, S., Huang, Y.-J., et al. (2020) · Scientific Reports · doi:10.1038/s41598-020-72600-8 · Cited by 23
Autophagy Regulating Kinases As Potential Therapeutic Targets For Age-Related Macular Degeneration
Kaarniranta, K., Kauppinen, A., Błasiak, J., & Salminen, A. (2012) · Future Medicinal Chemistry · doi:10.4155/fmc.12.169 · Cited by 23
Lin, Y., Horng, L., Sung, H., & Wu, R.-T. (2018) · Journal of Ocular Pharmacology and Therapeutics · doi:10.1089/jop.2017.0073 · Cited by 24
Dontsov, A. E., Sakina, N. L., Golubkov, A. M., & Оstrovsky, М. А. (2009) · Doklady Biochemistry and Biophysics · doi:10.1134/s1607672909020112 · Cited by 24
The Role of MicroRNAs in Mitochondria-Mediated Eye Diseases
Carrella, S., Massa, F., & Indrieri, A. (2021) · Frontiers in Cell and Developmental Biology · doi:10.3389/fcell.2021.653522 · Cited by 24
Nita, M., & Grzybowski, A. E. (2020) · EXCLI journal · doi:10.17179/excli2020-2915 · Cited by 22
Noninvasive Imaging of Mitochondrial Dysfunction in Dry Age-Related Macular Degeneration
Field, M. G., Comer, G. M., Kawaji, T., Petty, H. R., & Elner, V. M. (2012) · Ophthalmic surgery, lasers & imaging retina · doi:10.3928/15428877-20120712-02 · Cited by 22
Penn, J., Mihai, D., & Washington, I. (2014) · Disease Models & Mechanisms · doi:10.1242/dmm.017194 · Cited by 21
Yogalingam, G., Lee, A. R., Mackenzie, D. S., Maures, T. J., Rafalko, A., Prill, H., Berguig, G. Y., Hague, C., Christianson, T., Bell, S. M., et al. (2017) · Journal of Biological Chemistry · doi:10.1074/jbc.m116.739441 · Cited by 22
Vitamin A dimers trigger the protracted death of retinal pigment epithelium cells
Mihai, D., & Washington, I. (2014) · Cell Death and Disease · doi:10.1038/cddis.2014.314 · Cited by 24
The 11-cis Retinal Origins of Lipofuscin in the Retina
Adler, L., Boyer, N. P., Chen, C., Ablonczy, Z., Crouch, R. K., & Koutalos, Y. (2015) · Progress in molecular biology and translational science · doi:10.1016/bs.pmbts.2015.07.022 · Cited by 22
A novel RPE65 inhibitor CU239 suppresses visual cycle and prevents retinal degeneration
Shin, Y., Moiseyev, G. P., Petrukhin, K. E., Cioffi, C. L., Muthuraman, P., Takahashi, Y., & Ma, J. (2018) · Biochimica et Biophysica Acta (BBA) - Molecular Basis of Disease · doi:10.1016/j.bbadis.2018.04.014 · Cited by 24
Jin, H. L., Lee, S., Kwon, Y. S., Choung, S., & Jeong, K. W. (2015) · Journal of Pharmaceutical and Biomedical Analysis · doi:10.1016/j.jpba.2015.10.010 · Cited by 21
Cioffi, C. L., Muthuraman, P., Raja, A., Váradi, A., Rácz, B., & Petrukhin, K. E. (2020) · Journal of Medicinal Chemistry · doi:10.1021/acs.jmedchem.0c00996 · Cited by 20
Moschos, M. M., Nitoda, E., Chatziralli, I., & Demopoulos, C. A. (2014) · Journal of Chemistry · doi:10.1155/2014/317536 · Cited by 19
Kim, D., Choi, Y. R., Shim, J., Choi, Y., Kim, Y. T., Kim, M. K., & Kim, M. J. (2020) · Molecules · doi:10.3390/molecules25071737 · Cited by 20
Zaręba, M., Skumatz, C. M. B., Sarna, T., & Burke, J. M. (2014) · Investigative Ophthalmology & Visual Science · doi:10.1167/iovs.14-14310 · Cited by 18
Metadata
- Authors
- Vives-Bauza, C., Anand, M., Shirazi, A. K., Magrane, J., Gao, J., Vollmer-Snarr, H. R., Manfredi, G., & Finnemann, S. C.
- Affiliations
- Cornell University (US)
- Brigham Young University (US)
- Corresponding author
- Finnemann, Silvia C.
- Venue
- Journal of Biological Chemistry
- Publisher
- Elsevier BV
- Published
- 2008-09
- Volume
- 283
- Issue
- 36
- Pages
- 24770-24780
- ISSN
- 0021-9258 (ISSN-L)
- PMC
- PMC2529005
- OpenAlex
- W2021234912
- Cited by
- 155
- References
- 54
- Citations by year
- 2026: 4 · 2025: 6 · 2024: 6 · 2023: 7 · 2022: 7 · 2021: 8 · 2020: 13 · 2019: 6 · 2018: 12 · 2017: 8 · 2016: 4 · 2015: 9 · 2014: 17 · 2013: 9 · 2012: 13
- FWCI
- 8.78
- Type
- journal article
- Language
- en
- Open access
- hybrid
- doi.org
- Licence
- Locations
- Journal of Biological Chemistry (publishedVersion, cc-by)
- PubMed Central (publishedVersion)
- PubMed (publishedVersion)
- Funders
- Fulbright Program
- American Health Assistance Foundation
- Research to Prevent Blindness
- National Institutes of Health
- National Eye Institute (R01 EY13295, R01EY013295)
- National Institute of Neurological Disorders and Stroke (K02 NS 47306, K02NS047306)
- Topics
- Health Sciences › Medicine › Ophthalmology › Retinal Diseases and Treatments
- Life Sciences › Biochemistry, Genetics and Molecular Biology › Cell Biology › Autophagy in Disease and Therapy
- Health Sciences › Medicine › Ophthalmology › Retinal Development and Disorders
- Keywords
- retinal pigment epithelium, phagocytosis, mitochondrial dysfunction, oxidative phosphorylation, mitochondrial membrane potential, aging, mitochondrial DNA mutations, lysosomal accumulation, oxidative stress, age-related macular degeneration, RPE cell death
- MeSH terms
- Adenosine Triphosphate, Aging, Animals, Antioxidants, Cell Line, DNA, Mitochondrial, Epithelial Cells, Glucose, Humans, Lipofuscin, Lysosomes, Macular Degeneration, Mitochondria, Mitosis, Oxidative Phosphorylation, Phagocytosis, Pigment Epithelium of Eye, Pyridinium Compounds, Retinoids, Cell Death, Point Mutation, Pyruvic Acid, Rats, Long-Evans, Rats, Membrane Potential, Mitochondrial
About these checks
Registry, retraction, Cites and statistics results are computed, not judged, with one exception: a printed reference that no index lists is read once by a model before it counts as a citation error. Claims are extracted by a model and kept only when their quote appears verbatim in the text; each cited source is then checked, with a model’s help, for whether it says what the claim relies on. Those verdicts can be wrong — read the claim’s quote and the cited source before relying on one.
Statistics and arithmetic are recomputed, not judged.
Confidence bands are shown only for fields calibrated on our annotated test set. None is calibrated yet, so no band is shown.
What counts as a claim ›How we measure confidence ›How we check this ›
Are you an author, or do you see a problem with this page? Request a review
