

The DOI matches its Crossref record; 22 of the 22 references it cites were found in a registry or an index.
A combinatorial native MS and LC-MS/MS approach reveals high intrinsic phosphorylation of human Tau but minimal levels of other key modifications
Published version of a preprint
Overview
The claims and statistics of this paper haven’t been checked yet.
Run the check — free, no account needed. It reads the open-access text and checks the sources it cites.
Integrity signals
Registry
Cites
Statistics
Figures
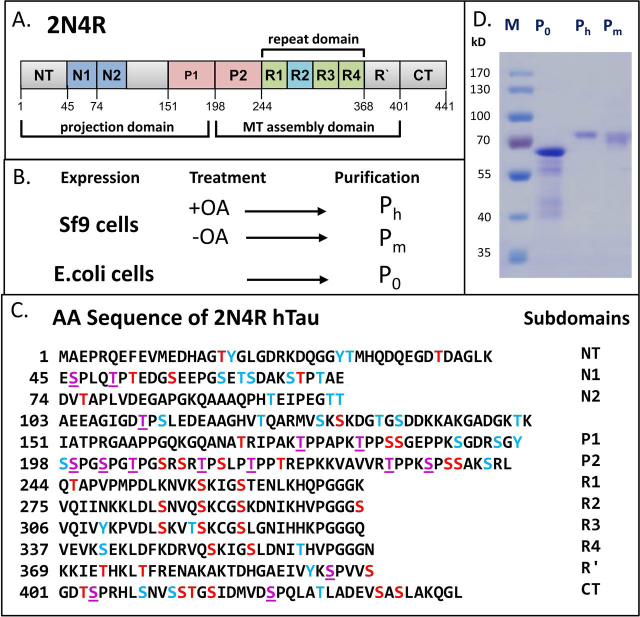
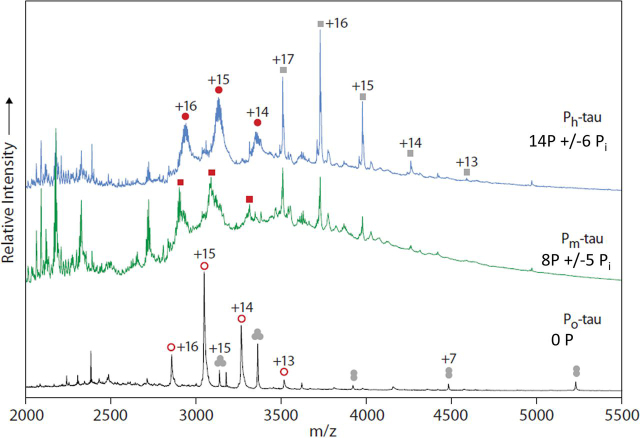
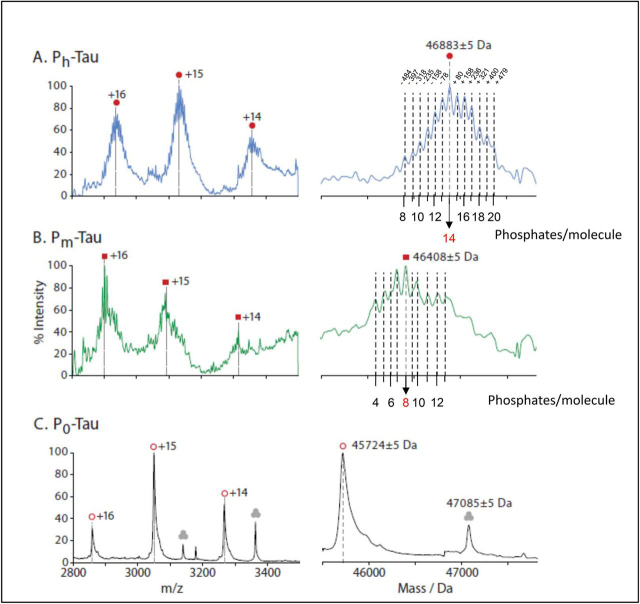
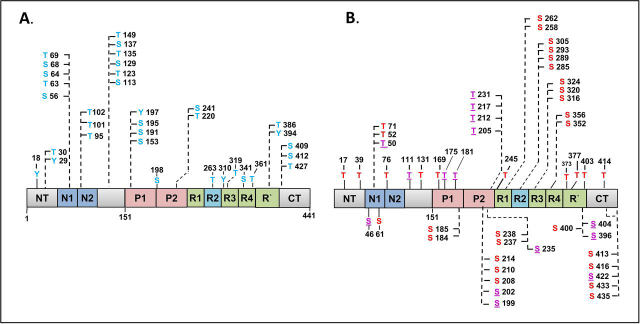
Verification
Claims the paper makes
The claims and statistics of this paper haven’t been checked yet.
Run the check — free, no account needed. It reads the open-access text and checks the sources it cites.
Claims other papers make about this one
Each is checked against this paper’s own text: does it say what the citing paper says it does?
In the citing paper
“This indicates that phosphorylation above a certain threshold may drive LLPS in this system or that the combination of phospho‐sites present in PKA‐phosphorylated Tau but distinct from p‐Tau (Drepper et al, 2020) may drive Tau LLPS.”
From Molecular crowding and RNA synergize to promote phase separation, microtubule interaction, and seeding of Tau condensates (2022) · cites this paper as Drepper et al, 2020
Self-check
Percentages, sums and reported differences re-computed from the paper’s own numbers.
The self-check needs the paper’s full text.
Citations
Cites
The neuropathological diagnosis of Alzheimer's disease
DeTure, M. A., & Dickson, D. W. (2019) · Molecular Neurodegeneration · doi:10.1186/s13024-019-0333-5 · Cited by 3,329 · cited 1×
“Beyond cell biological issues, the major interest in Tau arises from its property as a hallmark of brain diseases, notably Alzheimer and other tauopathies (32).”
BackgroundMarty, M. T., Baldwin, A. J., Marklund, E. G., Hochberg, G. K. A., Benesch, J. L. P., & Robinson, C. V. (2015) · Analytical Chemistry · doi:10.1021/acs.analchem.5b00140 · Cited by 1,000
Augustinack, J. C., Schneider, A., Mandelkow, E.-M., & Hyman, B. T. (2002) · Acta Neuropathologica · doi:10.1007/s004010100423 · Cited by 998
Self-citationAcetylation of Tau Inhibits Its Degradation and Contributes to Tauopathy
Min, S.-W., Cho, S.-H., Zhou, Y., Schroeder, S., Haroutunian, V., Seeley, W. W., Huang, E. J., Shen, Y., Masliah, E., Mukherjee, C., et al. (2010) · Neuron · doi:10.1016/j.neuron.2010.08.044 · Cited by 949
The acetylation of tau inhibits its function and promotes pathological tau aggregation
Cohen, T. J., Guo, J. L., Hurtado, D. E., Kwong, L. K., Mills, I. P., Trojanowski, J. Q., & Lee, V. M. Y. (2011) · Nature Communications · doi:10.1038/ncomms1255 · Cited by 724
Structural Polymorphism of 441-Residue Tau at Single Residue Resolution
Mukrasch, M. D., Bibow, S., Korukottu, J., Jeganathan, S., Biernat, J., Griesinger, C., Mandelkow, E., & Zweckstetter, M. (2009) · PLoS Biology · doi:10.1371/journal.pbio.1000034 · Cited by 652
Self-citationTau protein kinases: Involvement in Alzheimer's disease
Martin, L., Latypova, X., Wilson, C. M., Magnaudeix, A., Perrin, M.-L., Yardin, C., & Terro, F. (2013) · Ageing Research Reviews · doi:10.1016/j.arr.2012.06.003 · Cited by 631
Monoclonal antibody AT8 recognises tau protein phosphorylated at both serine 202 and threonine 205
Goedert, M., Jakes, R., & Vanmechelen, E. (1995) · Neuroscience Letters · doi:10.1016/0304-3940(95)11484-e · Cited by 608
Tau Kinetics in Neurons and the Human Central Nervous System
Sato, C., Barthélemy, N. R., Mawuenyega, K. G., Patterson, B. W., Gordon, B. A., Jockel-Balsarotti, J., Sullivan, M., Crisp, M. J., Kasten, T., Kirmess, K. M., et al. (2018) · Neuron · doi:10.1016/j.neuron.2018.02.015 · Cited by 586
DeVos, S. L., Miller, R. L., Schoch, K. M., Holmes, B. B., Kebodeaux, C. S., Wegener, A. J., Chen, G., Shen, T., Tran, H., Nichols, B., et al. (2017) · Science Translational Medicine · doi:10.1126/scitranslmed.aag0481 · Cited by 516
Research works printed but not linked: 68
- Wang, 2016, Tau in physiology and pathology, Nat. Rev. Neurosci, 17, 5, 10.1038/nrn.2015.1 · DOI · Paper page
- Grundke-Iqbal, 1986, Abnormal phosphorylation of the microtubule-associated protein tau (tau) in Alzheimer cytoskeletal pathology, Proc. Natl. Acad. Sci. U. S. A, 83, 4913, 10.1073/pnas.83.13.4913 · DOI · Paper page
- Braak, 1994, A sequence of cytoskeleton changes related to the formation of neurofibrillary tangles and neuropil threads, Acta Neuropathol, 87, 554, 10.1007/BF00293315 · DOI
- Yanamandra, 2013, Anti-tau antibodies that block tau aggregate seeding in vitro markedly decrease pathology and improve cognition in vivo, Neuron, 80, 402, 10.1016/j.neuron.2013.07.046 · DOI · Paper page
- Sigurdsson, 2018, Tau immunotherapies for Alzheimer's disease and related tauopathies: progress and potential pitfalls, J. Alzheimers Dis, 66, 855, 10.3233/JAD-189010 · DOI
- Ksiezak-Reding, 1992, Phosphate analysis and dephosphorylation of modified tau associated with paired helical filaments, Brain Res, 597, 209, 10.1016/0006-8993(92)91476-U · DOI
- Kopke, 1993, Microtubule-associated protein tau. Abnormal phosphorylation of a non-paired helical filament pool in Alzheimer disease, J. Biol. Chem, 268, 24374, 10.1016/S0021-9258(20)80536-5 · DOI · Paper page
- Kenessey, 1993, The extent of phosphorylation of fetal tau is comparable to that of PHF-tau from Alzheimer paired helical filaments, Brain Res, 629, 40, 10.1016/0006-8993(93)90478-6 · DOI
- Hanger, 2009, Tau phosphorylation: the therapeutic challenge for neurodegenerative disease, Trends Mol. Med, 15, 112, 10.1016/j.molmed.2009.01.003 · DOI · Paper page
- Hanger, 2020, Table of Tau phosphorylation sites, Webpage of King's College London
- Tepper, 2014, Oligomer formation of tau hyperphosphorylated in cells, J. Biol. Chem, 289, 34389, 10.1074/jbc.M114.611368 · DOI
- Mair, 2016, FLEXITau: Quantifying post-translational modifications of tau protein in vitro and in human disease, Anal. Chem, 88, 3704, 10.1021/acs.analchem.5b04509 · DOI
- Donnelly, 2019, Best practices and benchmarks for intact protein analysis for top-down mass spectrometry, Nat. Methods, 16, 587, 10.1038/s41592-019-0457-0 · DOI · Paper page
- Boeri Erba, 2015, The emerging role of native mass spectrometry in characterizing the structure and dynamics of macromolecular complexes, Protein Sci, 24, 1176, 10.1002/pro.2661 · DOI
- Hernández, 2007, Determining the stoichiometry and interactions of macromolecular assemblies from mass spectrometry, Nat. Protoc, 2, 715, 10.1038/nprot.2007.73 · DOI
- Schaffer, 2019, Identification and quantification of proteoforms by mass spectrometry, Proteomics, 19
- Arakhamia, 2020, Posttranslational modifications mediate the structural diversity of tauopathy strains, Cell, 180, 633, 10.1016/j.cell.2020.01.027 · DOI
- Hart, 2011, Cross talk between O-GlcNAcylation and phosphorylation: roles in signaling, transcription, and chronic disease, Annu. Rev. Biochem, 80, 825, 10.1146/annurev-biochem-060608-102511 · DOI · Paper page
- Yuzwa, 2012, Increasing O-GlcNAc slows neurodegeneration and stabilizes tau against aggregation, Nat. Chem. Biol, 8, 393, 10.1038/nchembio.797 · DOI · Paper page
- Coppola, 2012, Evidence for a role of the rare p.A152T variant in MAPT in increasing the risk for FTD-spectrum and Alzheimer's diseases, Hum. Mol. Gen, 21, 3500, 10.1093/hmg/dds161 · DOI · Paper page
- Drubin, 1985, Nerve growth factor-induced neurite outgrowth in PC12 cells involves the coordinate induction of microtubule assembly and assembly-promoting factors, J. Cell Biol, 101, 1799, 10.1083/jcb.101.5.1799 · DOI
- Baas, 1991, Processes induced by tau expression in Sf9 cells have an axon-like microtubule organization, J. Cell Biol, 115, 1333, 10.1083/jcb.115.5.1333 · DOI
- Knops, 1991, Overexpression of tau in a nonneuronal cell induces long cellular processes, J. Cell Biol, 114, 725, 10.1083/jcb.114.4.725 · DOI · Paper page
- Biernat, 2002, Protein kinase MARK/PAR-1 is required for neurite outgrowth and establishment of neuronal polarity, Mol. Biol. Cell, 13, 4013, 10.1091/mbc.02-03-0046 · DOI · Paper page
- Hoffman, 2017, The protein serine/threonine phosphatases PP2A, PP1 and calcineurin: A triple threat in the regulation of the neuronal cytoskeleton, Mol. Cell. Neurosci, 84, 119, 10.1016/j.mcn.2017.01.005 · DOI
- Schneider, 2008, Tau-based treatment strategies in neurodegenerative diseases, Neurotherapeutics, 5, 443, 10.1016/j.nurt.2008.05.006 · DOI
- Barthélemy, 2020, A soluble phosphorylated tau signature links tau, amyloid and the evolution of stages of dominantly inherited Alzheimer's disease, Nat. Med, 26, 398, 10.1038/s41591-020-0781-z · DOI · Paper page
- Bateman, 2020, Another step forward in blood-based diagnostics for Alzheimer's disease, Nat. Med, 26, 314, 10.1038/s41591-020-0797-4 · DOI · Paper page
- Boyle, 1991, Phosphopeptide mapping and phosphoamino acid analysis by two-dimensional separation on thin-layer cellulose plates, Methods Enzymol, 201, 110, 10.1016/0076-6879(91)01013-R · DOI
- Gustke, 1992, The Alzheimer-like phosphorylation of tau protein reduces microtubule binding and involves Ser-Pro and Thr-Pro motifs, FEBS Lett, 307, 199, 10.1016/0014-5793(92)80767-B · DOI
- Illenberger, 1998, The endogenous and cell cycle-dependent phosphorylation of tau protein in living cells: implications for Alzheimer's disease, Mol. Biol. Cell, 9, 1495, 10.1091/mbc.9.6.1495 · DOI
- Barthélemy, 2016, Tau protein quantification in human cerebrospinal fluid by targeted mass spectrometry at high sequence coverage provides insights into its primary structure heterogeneity, J. Proteome Res, 15, 667, 10.1021/acs.jproteome.5b01001 · DOI · Paper page
- Guo, 2017, Reversible phosphorylation of the 26S proteasome, Protein Cell, 8, 255, 10.1007/s13238-017-0382-x · DOI
- Mikulík, 2011, Phosphorylation of ribosomal proteins influences subunit association and translation of poly (U) in Streptomyces coelicolor, Mol. Biosyst, 7, 817, 10.1039/C0MB00174K · DOI
- Planel, 2007, Anesthesia leads to tau hyperphosphorylation through inhibition of phosphatase activity by hypothermia, J. Neurosci, 27, 3090, 10.1523/JNEUROSCI.4854-06.2007 · DOI
- Matsuo, 1994, Biopsy-derived adult human brain tau is phosphorylated at many of the same sites as Alzheimer's disease paired helical filament tau, Neuron, 13, 989, 10.1016/0896-6273(94)90264-X · DOI
- Wang, 2015, Rapid alteration of protein phosphorylation during postmortem: implication in the study of protein phosphorylation, Sci. Rep, 5
- Jeganathan, 2008, Proline-directed pseudo-phosphorylation at AT8 and PHF1 epitopes induces a compaction of the paperclip folding of Tau and generates a pathological (MC-1) conformation, J. Biol. Chem, 283, 32066, 10.1074/jbc.M805300200 · DOI · Paper page
- Wegmann, 2018, Tau protein liquid-liquid phase separation can initiate tau aggregation, EMBO J, 37, 10.15252/embj.201798049 · DOI · Paper page
- Amniai, 2011, Characterization of the AT180 epitope of phosphorylated Tau protein by a combined nuclear magnetic resonance and fluorescence spectroscopy approach, Biochem. Biophys. Res. Commun, 412, 743, 10.1016/j.bbrc.2011.08.046 · DOI
- Zheng-Fischhöfer, 1998, Sequential phosphorylation of Tau by glycogen synthase kinase-3β and protein kinase A at Thr212 and Ser214 generates the Alzheimer-specific epitope of antibody AT100 and requires a paired-helical-filament-like conformation, Eur. J. Biochem, 252, 542, 10.1046/j.1432-1327.1998.2520542.x · DOI
- Lippens, 2016, NMR meets Tau: Insights into its function and pathology, Biomolecules, 6, 28, 10.3390/biom6020028 · DOI
- Jakes, 1991, Identification of 3- and 4-repeat tau isoforms within the PHF in Alzheimer's disease, EMBO J, 10, 2725, 10.1002/j.1460-2075.1991.tb07820.x · DOI
- Schwalbe, 2013, Phosphorylation of human Tau protein by microtubule affinity-regulating kinase 2, Biochemistry, 52, 9068, 10.1021/bi401266n · DOI · Paper page
- Kosik, 2005, Phosphorylated tau and the neurodegenerative foldopathies, Biochim. Biophys. Acta, 1739, 298, 10.1016/j.bbadis.2004.10.011 · DOI
- Schneider, 1999, Phosphorylation that detaches tau protein from microtubules (Ser262, Ser214) also protects it against aggregation into Alzheimer paired helical filaments, Biochemistry, 38, 3549, 10.1021/bi981874p · DOI · Paper page
- Wang, 2007, Stepwise proteolysis liberates tau fragments that nucleate the Alzheimer-like aggregation of full-length tau in a neuronal cell model, Proc. Natl. Acad. Sci. U. S. A, 104, 10252, 10.1073/pnas.0703676104 · DOI
- Flores, 2018, Caspase-1 inhibition alleviates cognitive impairment and neuropathology in an Alzheimer's disease mouse model, Nat. Commun, 9, 10.1038/s41467-018-06449-x · DOI
- Watanabe, 2004, Molecular aging of tau: disulfide-independent aggregation and non-enzymatic degradation in vitro and in vivo, J. Neurochem, 90, 1302, 10.1111/j.1471-4159.2004.02611.x · DOI · Paper page
- Kaniyappan, 2017, Extracellular low-n oligomers of tau cause selective synaptotoxicity without affecting cell viability, Alzheimers Dement, 13, 1270, 10.1016/j.jalz.2017.04.002 · DOI
- von der Ohe, 2007, Synaptic protein dynamics in hibernation, J. Neurosci, 27, 84, 10.1523/JNEUROSCI.4385-06.2007 · DOI
- Morris, 2015, Tau post-translational modifications in wild-type and human amyloid precursor protein transgenic mice, Nat. Neurosci, 18, 1183, 10.1038/nn.4067 · DOI · Paper page
- Derkinderen, 2005, Tyrosine 394 is phosphorylated in Alzheimer's paired helical filament tau and in fetal tau with c-Abl as the candidate tyrosine kinase, J. Neurosci, 25, 6584, 10.1523/JNEUROSCI.1487-05.2005 · DOI · Paper page
- Ittner, 2010, Dendritic function of tau mediates amyloid-beta toxicity in Alzheimer's disease mouse models, Cell, 142, 387, 10.1016/j.cell.2010.06.036 · DOI · Paper page
- Sharma, 2016, Constitutive hyperactivity of histone deacetylases enhances radioresistance in Lepidopteran Sf9 insect cells, Biochim. Biophys. Acta, 1860, 1237, 10.1016/j.bbagen.2016.03.004 · DOI
- Yu, 2019, Tau protein aggregates inhibit the protein-folding and vesicular trafficking arms of the cellular proteostasis network, J. Biol. Chem, 294, 7917, 10.1074/jbc.RA119.007527 · DOI
- Mandelkow, 2012, Biochemistry and cell biology of tau protein in neurofibrillary degeneration, Cold Spring Harb. Perspect. Med, 2, 10.1101/cshperspect.a006247 · DOI
- Gunawardana, 2015, The human tau interactome: Binding to the ribonucleoproteome, and impaired binding of the proline-to-leucine mutant at position 301 (p301l) to chaperones and the proteasome, Mol. Cell. Proteomics, 14, 3000, 10.1074/mcp.M115.050724 · DOI · Paper page
- Maziuk, 2017, Dysregulation of RNA binding protein aggregation in neurodegenerative disorders, Front. Mol. Neurosci, 10, 89, 10.3389/fnmol.2017.00089 · DOI
- Wheeler, 2019, Activity of the poly(A) binding protein MSUT2 determines susceptibility to pathological tau in the mammalian brain, Sci. Transl. Med, 11, 10.1126/scitranslmed.aao6545 · DOI · Paper page
- Multhaup, 2015, Amyloid precursor protein (APP) metabolites APP intracellular fragment (AICD), Aβ42, and Tau in nuclear roles, J. Biol. Chem, 290, 23515, 10.1074/jbc.R115.677211 · DOI
- Chen, 1996, A periplasmic protein (Skp) of Escherichia coli selectively binds a class of outer membrane proteins, Mol. Microbiol, 19, 1287, 10.1111/j.1365-2958.1996.tb02473.x · DOI
- Cowan, 2001, Type II chaperonins, prefoldin, and the tubulin-specific chaperones, Adv. Protein Chem, 59, 73, 10.1016/S0065-3233(01)59003-8 · DOI
- Oka, 2011, Dynamic changes of the phosphoproteome in postmortem mouse brains, PLoS one, 6, 10.1371/journal.pone.0021405 · DOI
- Wiśniewski, 2010, Brain phosphoproteome obtained by a FASP-based method reveals plasma membrane protein topology, J. Proteome Res, 9, 3280, 10.1021/pr1002214 · DOI
- Morgenstern, 2017, Definition of a high-confidence mitochondrial proteome at quantitative scale, Cell Rep, 19, 2836, 10.1016/j.celrep.2017.06.014 · DOI
- Tyanova, 2016, The MaxQuant computational platform for mass spectrometry-based shotgun proteomics, Nat. Protoc, 11, 2301, 10.1038/nprot.2016.136 · DOI
- Perez-Riverol, 2019, The PRIDE database and related tools and resources in 2019: improving support for quantification data, Nucleic Acids Res, 47, D442, 10.1093/nar/gky1106 · DOI
Cited by
Tau Protein Interaction Partners and Their Roles in Alzheimer’s Disease and Other Tauopathies
Sinsky, J., Pichlerova, K., & Hanes, J. (2021) · International Journal of Molecular Sciences · doi:10.3390/ijms22179207 · Cited by 220
Hochmair, J., Exner, C., Franck, M., Dominguez‐Baquero, A., Diez, L., Brognaro, H., Kraushar, M. L., Mielke, T., Radbruch, H., Kaniyappan, S., et al. (2022) · The EMBO Journal · doi:10.15252/embj.2021108882 · Cited by 106
Self-citation
Metadata
- Authors
- Drepper, F., Biernat, J., Kaniyappan, S., Meyer, H. E., Mandelkow, E. M., Warscheid, B., & Mandelkow, E.
- Venue
- Journal of Biological Chemistry
- Publisher
- Elsevier BV
- Published
- 2020-12
- Volume
- 295
- Issue
- 52
- Pages
- 18213-18225
- ISSN
- 0021-9258
- PMC
- PMC7939451
- Cited by
- 56
- References
- 22
- Language
- en
- Funders
- Deutsche Forschungsgemeinschaft (FOR1905, 403222702-SFB 1381)
- Excellence Strategy of the German Federal & State Governments (EXC 2189)
- Excellence Initiative of the German Federal & State Governments (EXC 294)
About these checks
Registry, retraction, Cites and statistics results are computed, not judged, with one exception: a printed reference that no index lists is read once by a model before it counts as a citation error. Claims are extracted by a model and kept only when their quote appears verbatim in the text; each cited source is then checked, with a model’s help, for whether it says what the claim relies on. Those verdicts can be wrong — read the claim’s quote and the cited source before relying on one.
Statistics and arithmetic are recomputed, not judged.
Confidence bands are shown only for fields calibrated on our annotated test set. None is calibrated yet, so no band is shown.
What counts as a claim ›How we measure confidence ›How we check this ›
Are you an author, or do you see a problem with this page? Request a review
Data sources
Bibliographic data: Semantic Scholar, OpenAlex, Crossref.
Contains information from the Semantic Scholar Academic Graph Datasets, made available under the ODC Attribution License (ODC-BY 1.0).
Semantic Scholar’s data is described in: Kinney, R., et al. (2023). The Semantic Scholar Open Data Platform. arXiv:2301.10140.
