

The DOI matches its Crossref record; 44 of the 44 references it cites were found in a registry or an index; none of the 56 sources its claims cite is checked for support yet.
Carbohydrate-Protein drink is effective for restoring endurance capacity in masters class athletes after a two-Hour recovery
Open accessAbstract
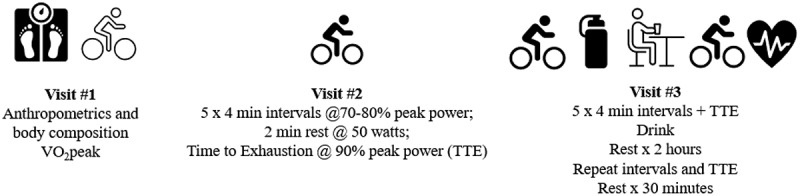
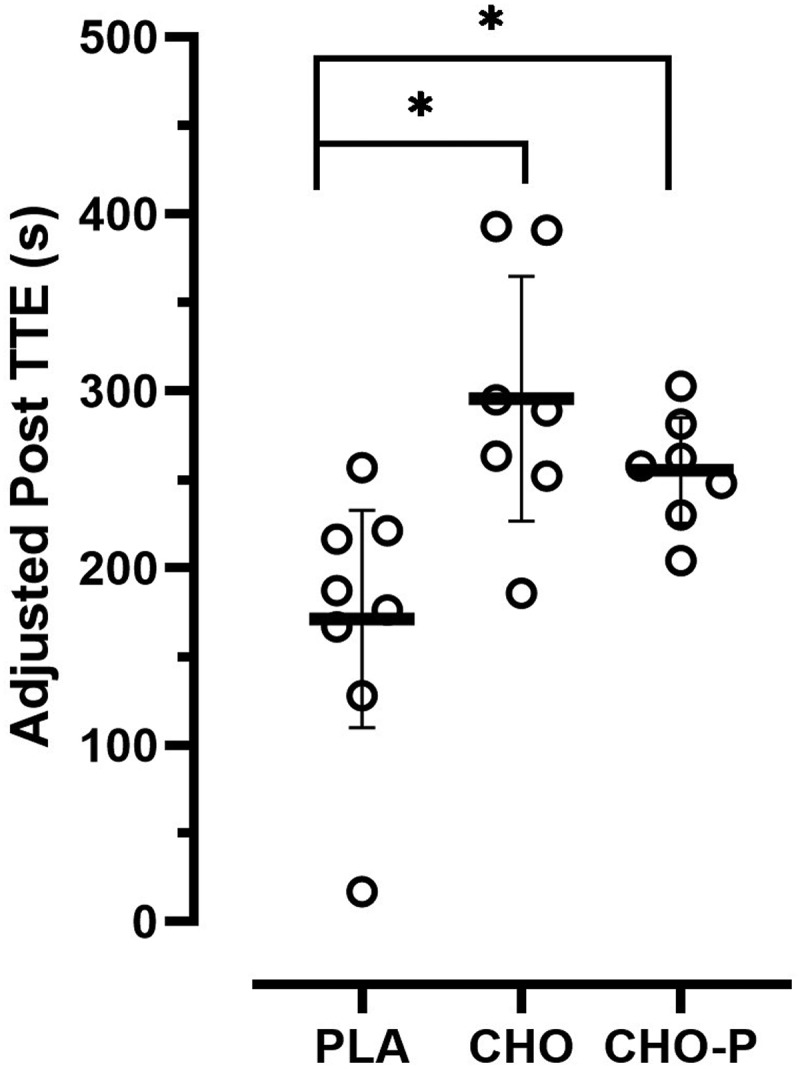
Background Carbohydrate (CHO) and carbohydrate-protein co-ingestion (CHO-P) have been shown to be equally effective for enhancing glycogen resynthesis and subsequent same-day performance when CHO intake is suboptimal (≤0.8 g/kg). Few studies have specifically examined the effect of isocaloric CHO vs CHO-P consumption on subsequent high-intensity aerobic performance with limited time to recover (≤2 hours) in masters class endurance athletes.Methods This was a randomized, double-blind between-subject design. Twenty-two male masters class endurance athletes (age 49.1 ± 6.9 years; height 175.8 ± 4.8 cm; body mass 80.7 ± 8.6 kg; body fat (%) 19.1 ± 5.8; VO2peak 48.6 ± 6.7 ml·kg·min−1) were assigned to consume one of three beverages during a 2-hour recovery period: Placebo (PLA; electrolytes and water), CHO (1.2 g/kg bm), or CHO-P (0.8 g/kg bm CHO + 0.4 g/kg bm PRO). All beverages were standardized to one liter (~32 oz.) of total fluid volume regardless of the treatment group. During Visit #1, participants completed graded exercise testing on a cycle ergometer to determine VO2peak and peak power output (PPO, watts). Visit #2 consisted of familiarization with the high-intensity protocol including 5 × 4 min intervals at 70-80% of PPO with 2 min of active recovery at 50 W, followed by a time to exhaustion (TTE) test at 90% PPO. During Visit#3, the same high-intensity interval protocol with TTE was conducted pre-and post-beverage consumption.Results A one-way ANCOVA indicated a significant difference among the group means for the posttest TTE (F2,18 = 6.702, p = .007, ƞ2 = .427) values after adjusting for the pretest differences. TTE performance in the second exercise bout improved for the CHO (295.48 ± 24.90) and CHO-P (255.08 ± 25.07 sec) groups. The water and electrolyte solution was not effective in restoring TTE performance in the PLA group (171.13 ± 23.71 sec).Conclusions Both CHO and CHO-P effectively promoted an increase in TTE performance with limited time to recover in this sample of masters class endurance athletes. Water and electrolytes alone were not effective for restoring endurance capacity during the second bout of exhaustive exercise.
Overview
CoChat Summary
TL;DR
In male masters class endurance athletes, both carbohydrate (CHO) and carbohydrate-protein (CHO-P) recovery drinks improved subsequent time-to-exhaustion performance after a 2-hour recovery compared with placebo, with no difference between CHO and CHO-P. CHO and CHO-P also improved heart-rate recovery index versus placebo.
Key findings
- Posttest time to exhaustion (TTE) differed among groups after adjusting for pretest TTE: F2,18 = 6.702, p = .007, η² = .427. Adjusted posttest TTE was 295.48 ± 24.90 sec for CHO and 255.08 ± 25.07 sec for CHO-P versus 171.13 ± 23.71 sec for PLA; CHO vs PLA p < .002, CHO-P vs PLA p = .028, CHO vs CHO-P p = .265.
- The paper reports TTE improved by 30% with CHO and 19% with CHO-P, whereas TTE declined by 20% in PLA.
- Heart-rate recovery index (HRRi) posttest values differed among groups at 1 min (F2,17 = 6.715, p = .007), 2 min (F2,17 = 5.720, p = .013), and 5 min (F2,17 = 6.438, p = .008). PLA differed from CHO and CHO-P at all three time points, with no differences between CHO and CHO-P (1 min p = .469; 2 min p = .628; 5 min p = .549).
- Dietary analysis in 13 of 22 participants showed no significant differences (p > .05) in total energy, protein, fat, or carbohydrate intake among groups.
Methods
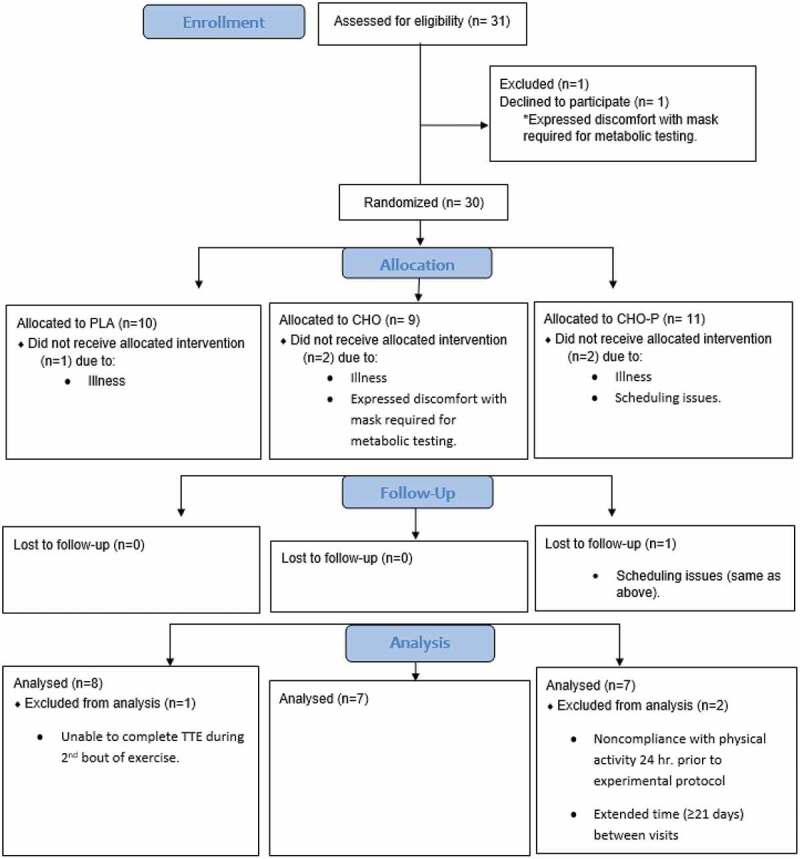
- Randomized, double-blind, placebo-controlled between-subject design in 22 male masters class endurance athletes (age 49.1 ± 6.9 years; VO2peak 48.6 ± 6.7 mL·kg·min−1).
- Three visits: graded exercise test to determine VO2peak and peak power output; familiarization with 5 × 4 min intervals at 70–80% PPO plus TTE at 90% PPO; experimental visit with the same interval/TTE protocol before and after beverage consumption.
- During a 2-hour recovery, participants consumed PLA (electrolytes and water), CHO (1.2 g/kg body mass), or CHO-P (0.8 g/kg CHO + 0.4 g/kg protein), all standardized to 1 L total fluid. Main analyses used separate one-way ANCOVA for TTE and HRRi with pretest values as covariate; Quade nonparametric ANCOVA was used when assumptions were not met, with Fisher’s LSD post hoc tests.
Limitations
- Paper-stated: dietary compliance was limited (24-hour dietary recall data reported for 13 of 22 participants); dietary intake was not standardized before the experimental protocol; testing was not in a fasted state; caffeine intake 24 hours before testing was not quantified or restricted; individual/group recovery-drink completion times were not provided; many participants terminated the prescribed 5-min cool down early.
- Paper-stated: the authors note that HRR may not be a suitable indicator for parasympathetic recovery with fluid alone, within the first 5 min after exercise cessation, or after high-intensity exercise, and suggest a more standardized cool down and longer seated/supine assessment.
- Evident from the text: group sizes were small (PLA n = 8; CHO n = 7; CHO-P n = 7, with HRRi CHO-P n = 5 in Table 3), and pretest TTE values varied widely across groups before ANCOVA adjustment.
Model-written summary. Check it against the paper before relying on it.
Integrity signals
Registry
Cites
Statistics
Figures
Verification
Claims the paper makes
0 Valid · 0 Not valid · 37 Not checked · 57 Own results and interpretations
A result the paper reports from its own data — it cites no other source for it, so there is none to check. The quote shows it is in the paper.
In the paper
“Weight either approached or returned to baseline for all participants following consumption of 1.1 ± 0.2 liters of fluid during the 2-hour recovery period.”
§ Carbohydrate-Protein drink is effective for restoring endurance capacity in masters class athletes after a two-Hour recovery > Discussion
plainstates a cause- Asserted: passes — The authors put it forward as true.
- Checkable: passes — It can be checked against evidence.
- Load-bearing: unclear — It is unclear whether the paper’s conclusions depend on it.
- Based: passes — The paper gives a reason why it holds.
A result the paper reports from its own data — it cites no other source for it, so there is none to check. The quote shows it is in the paper.
In the paper
“On an individual level, unadjusted values indicated 63% (5 of 8) of participants in the PLA group demonstrated a decline in TTE performance averaging a − 68 sec change from the first to second bout of exercise, with a range of −16 to −185 sec.”
§ Carbohydrate-Protein drink is effective for restoring endurance capacity in masters class athletes after a two-Hour recovery > Discussion
hedged- Asserted: passes — The authors put it forward as true.
- Checkable: passes — It can be checked against evidence.
- Load-bearing: passes — The paper’s conclusions depend on it.
- Based: passes — The paper gives a reason why it holds.
A result the paper reports from its own data — it cites no other source for it, so there is none to check. The quote shows it is in the paper.
In the paper
“The strength of the association (i.e. effect size, ƞ2) indicated that the treatment groups (PLA, CHO, and CHO-P) accounted for 43% of the variance of the posttest TTE values.”
§ Carbohydrate-Protein drink is effective for restoring endurance capacity in masters class athletes after a two-Hour recovery > Results > High-Intensity Aerobic Interval and Time to Exhaustion
hedgedstates an association- Asserted: passes — The authors put it forward as true.
- Checkable: passes — It can be checked against evidence.
- Load-bearing: passes — The paper’s conclusions depend on it.
- Based: passes — The paper gives a reason why it holds.
A result the paper reports from its own data — it cites no other source for it, so there is none to check. The quote shows it is in the paper.
In the paper
“Results indicated an improved recovery for both the CHO and CHO-P conditions at each of the three time points postexercise, with no difference between conditions.”
§ Carbohydrate-Protein drink is effective for restoring endurance capacity in masters class athletes after a two-Hour recovery > Discussion
plain- Asserted: passes — The authors put it forward as true.
- Checkable: passes — It can be checked against evidence.
- Load-bearing: passes — The paper’s conclusions depend on it.
- Based: passes — The paper gives a reason why it holds.
- Rests on an assumption not shown here.
A result the paper reports from its own data — it cites no other source for it, so there is none to check. The quote shows it is in the paper.
In the paper
“In the current study, TTE performance in the second exercise bout improved for the CHO (295.48 ± 24.90 sec) and CHO-P (255.08 ± 25.07 sec) groups.”
§ Carbohydrate-Protein drink is effective for restoring endurance capacity in masters class athletes after a two-Hour recovery > Discussion
plainstates a cause- Asserted: passes — The authors put it forward as true.
- Checkable: passes — It can be checked against evidence.
- Load-bearing: passes — The paper’s conclusions depend on it.
- Based: passes — The paper gives a reason why it holds.
26 more claims
Create a free account to see all 94 claims and to verify the 56 references still open.
- It may state two separate claims as one. 31
- Probably not a substantial claim. 50
- The quote only partly states this claim. 1
Self-check
Percentages, sums and reported differences re-computed from the paper’s own numbers.
Each contradiction between two passages listed here was confirmed by an independent check.
Rated minor: it would not touch a result — a value no result rests on, a p-value that stays on the same side of the significance level, or a conflict that is clerical, resolved elsewhere in the paper, or outside its own findings.
In the paper
§ Carbohydrate-Protein drink is effective for restoring endurance capacity in masters class athletes after a two-Hour recovery > Methods > Procedures
“HRRi=(Finalpeakheartrate(bpm)+HeartRate1min(bpm))/(TTE(sec)x90%PPO)”
§ Carbohydrate-Protein drink is effective for restoring endurance capacity in masters class athletes after a two-Hour recovery > Methods > Procedures
“Total work was calculated as TTE in sec x 90% PPO divided by 1000 (kilojoules).”
Rated minor: it would not touch a result — a value no result rests on, a p-value that stays on the same side of the significance level, or a conflict that is clerical, resolved elsewhere in the paper, or outside its own findings.
In the paper
§ Carbohydrate-Protein drink is effective for restoring endurance capacity in masters class athletes after a two-Hour recovery > Results > Dietary analysis
“| | Total(n = 13) | PLA(n = 6) | CHO(n = 4) | CHO-P(n = 4) |”
§ Carbohydrate-Protein drink is effective for restoring endurance capacity in masters class athletes after a two-Hour recovery > Results > Dietary analysis
“5 of 8 participants in the PLA group; 4 of 7 participants in the CHO group; 4 of 7 participants in the CHO-P group.”
Rated minor: it would not touch a result — a value no result rests on, a p-value that stays on the same side of the significance level, or a conflict that is clerical, resolved elsewhere in the paper, or outside its own findings.
In the paper
§ Carbohydrate-Protein drink is effective for restoring endurance capacity in masters class athletes after a two-Hour recovery > Results > Participants
“Nine of 22 total participants had a body fat percentage greater than 20% with three being placed into PLA group”
§ Carbohydrate-Protein drink is effective for restoring endurance capacity in masters class athletes after a two-Hour recovery > Results > Participants
“fat-free mass (kg) was used to calculate the nutrient needs of four (18.1%; three placed in the CHO group and one in the CHO-P group) participants.”
Citations
Cites
Moore, D. R., Robinson, M. J., Fry, J. L., Tang, J. E., Glover, E. I., Wilkinson, S. B., Prior, T., Tarnopolsky, M. A., & Phillips, S. M. (2009) · The American Journal of Clinical Nutrition · doi:10.3945/ajcn.2008.26401 · Cited by 973
Using SPSS for Windows: Analyzing and Understanding Data
Green, S. B., Salkind, N. J., & Jones, T. M. (1997) · Medical Entomology and Zoology · Cited by 810
Moore, D. R., Churchward-Venne, T. A., Witard, O., Breen, L., Burd, N. A., Tipton, K. D., & Phillips, S. M. (2015) · The Journals of Gerontology: Series A · doi:10.1093/gerona/glu103 · Cited by 770
Witard, O. C., Jackman, S. R., Breen, L., Smith, K., Selby, A., & Tipton, K. D. (2014) · The American Journal of Clinical Nutrition · doi:10.3945/ajcn.112.055517 · Cited by 517
Areta, J. L., Burke, L. M., Ross, M. L., Camera, D. M., West, D. W. D., Broad, E. M., Jeacocke, N. A., Moore, D. R., Stellingwerff, T., Phillips, S. M., et al. (2013) · The Journal of Physiology · doi:10.1113/jphysiol.2012.244897 · Cited by 495
Kirkpatrick, S. I., Subar, A. F., Douglass, D., Zimmerman, T. P., Thompson, F. E., Kahle, L. L., George, S. M., Dodd, K. W., & Potischman, N. (2014) · The American Journal of Clinical Nutrition · doi:10.3945/ajcn.114.083238 · Cited by 450
Physiological consequences of hypohydration: exercise performance and thermoregulation
Sawka, M. N. (1992) · Medicine & Science in Sports & Exercise · doi:10.1249/00005768-199206000-00008 · Cited by 407
van Loon, L. J., Saris, W. H., Kruijshoop, M., & Wagenmakers, A. J. (2000) · The American Journal of Clinical Nutrition · doi:10.1093/ajcn/72.1.106 · Cited by 346
Parasympathetic reactivation after repeated sprint exercise
Buchheit, M., Laursen, P. B., & Ahmaidi, S. (2007) · American Journal of Physiology-Heart and Circulatory Physiology · doi:10.1152/ajpheart.00062.2007 · Cited by 290
Howarth, K. R., Moreau, N. A., Phillips, S. M., & Gibala, M. J. (2009) · Journal of Applied Physiology · doi:10.1152/japplphysiol.90333.2008 · Cited by 218
Research works printed but not linked: 1
- Macgregor C, Climstein M, Reaburn PR. The effect of age on training practices in veteran cyclists: an Australian study. Med Sci Sports Exerc. 2013;45:85.
Cited by
Naderi, A., Rothschild, J. A., Santos, H. O., Hamidvand, A., Koozehchian, M. S., Ghazzagh, A., Berjisian, E., & Podlogar, T. (2025) · Sports Medicine · doi:10.1007/s40279-025-02213-6 · Cited by 77
“…have reported similar improvements in subsequent time-trial performance and high-intensity interval cycling capacity after either carbohydrates alone or carbohydrate–protein co-ingestion during 2–5 h recovery periods in both young and master endurance athletes [91, 92] (Supplementary Material 3).”
Support Your Recovery Needs (SYRN) – a systemic approach to improve sport performance
Adamczyk, J. G. (2023) · Biomedical Human Kinetics · doi:10.2478/bhk-2023-0033 · Cited by 13
Elstad, K., Malone, C., Luedke, J. A., Jaime, S. J., Dobbs, W. C., Almonroeder, T. G., Kerksick, C. M., Markert, A., & Jagim, A. R. (2023) · Nutrients · doi:10.3390/nu15245134 · Cited by 11
Development of Fruit-Based Carbohydrate Gel for Endurance Athletes
de Assis, R. C., Valentim, A. B., Barbosa, I., da Silva, J. Y. G., Aquino, A., Viana, J. D. D. R., Rabelo, C. A. F., de Sousa, P. H. M., Maia, C. S. C., Fernandes, V. B., et al. (2024) · Processes · doi:10.3390/pr12102304 · Cited by 9
Trends and Missing Links in (De)Hydration Research: A Narrative Review
Rebelo‐Marques, A., Coelho-Ribeiro, B., Lages, A. D. S., Andrade, R., Afonso, J. R., Pereira, R., Batista, A. S., Teixeira, V. H., & Jácome, C. I. O. (2024) · Nutrients · doi:10.3390/nu16111709 · Cited by 9
Zhao, S., Zhang, X., Liang, T., Ng, S., Liu, Y. C., & Ning, Z. (2025) · Journal of the International Society of Sports Nutrition · doi:10.1080/15502783.2025.2605338 · Cited by 3
Šoša, I. (2026) · Nutrients · doi:10.3390/nu18050736 · Cited by 3
Gross, K. N., Harty, P. S., Krieger, J. M., Mumford, P. W., Sunderland, K., Hagele, A. M., & Kerksick, C. M. (2024) · Nutrients · doi:10.3390/nu16050717 · Cited by 3
A U-shaped dose–response of carbohydrate–protein supplementation on rowing performance
Wang, X., & Wu, H. (2025) · Frontiers in Nutrition · doi:10.3389/fnut.2025.1651457 · Cited by 2
Effect of carbohydrate-protein supplement on anaerobic capacity after physical activity
Limnararat, K. (2025) · International Journal of ADVANCED AND APPLIED SCIENCES · doi:10.21833/ijaas.2025.02.004 · Cited by 1
Allgemeine Grundlagen, Planung und Organisation des Trainings
Hofmann, P., & Tschakert, G. (2025) · Springer eBooks · doi:10.1007/978-3-662-68883-0_13
Куйбіда, В., Коханець, П., & Lopatynska, V. V. (2025) · Theory and practice of physical culture and sports · doi:10.69587/tppcs/1.2025.89
Influência da saúde e bem-estar na qualidade do trabalho desenvolvido pelos Bombeiros Portugueses"
Fernandes, A. I. P. D. S. (2024) · Portuguese National Funding Agency for Science, Research and Technology (RCAAP Project by FCT)
Song, K.-T., Lee, H., Sung, J., Baek, J.-K., Park, S.-W., Hyun, K.-J., Jin, E.-H., Noh, K.-W., & Park, S. (2026) · Nutrients · doi:10.3390/nu18172855
Efectos de la periodización nutricional en la recuperación postejercicio com
Rovira, J. P. D. (2026) · Rovira & Virgili repository
Pulse-based nutritional drinks
Boukid, F. (2026) · Elsevier eBooks · doi:10.1016/b978-0-443-32956-2.00015-0
Metadata
- Authors
- Goldstein, E. R., Stout, J. R., Wells, A. J., Antonio, J., Vasenina, E., & Fukuda, D. H.
- Affiliations
- Stetson University (US)
- University of Central Florida (US)
- Department of Health and Human Performance, Fight Science Laboratory, Nova Southeastern University, Davie, FL, USA
- Corresponding author
- Goldstein, Erica R.
- Venue
- Journal of the International Society of Sports Nutrition
- Publisher
- Informa UK Limited
- Published
- 2023-02-26
- Volume
- 20
- Issue
- 1
- Pages
- 2178858-2178858
- ISSN
- 1550-2783 (ISSN-L)
- PMC
- PMC9970201
- OpenAlex
- W4322208067
- Cited by
- 16
- References
- 44
- Citations by year
- 2026: 4 · 2025: 6 · 2024: 4 · 2023: 2
- FWCI
- 2.45
- Type
- journal article
- Language
- en
- Open access
- gold
- doi.org
- Locations
- Journal of the International Society of Sports Nutrition (publishedVersion, cc-by)
- PubMed Central (publishedVersion, cc-by)
- PubMed (publishedVersion)
- DOAJ (DOAJ: Directory of Open Access Journals) (submittedVersion, cc-by-sa)
- Funders
- there is no funding
- Topics
- Health Sciences › Nursing › Nutrition and Dietetics › Muscle metabolism and nutrition
- Health Sciences › Medicine › Orthopedics and Sports Medicine › Sports Performance and Training
- Health Sciences › Medicine › Physiology (medical) › Cardiovascular and exercise physiology
- Keywords
- time to exhaustion, high-intensity interval exercise, glycogen resynthesis, post-exercise recovery, peak power, electrolyte solutions, peak oxygen uptake
- MeSH terms
- Adult, Dietary Carbohydrates, Humans, Male, Middle Aged, Physical Endurance, Polyesters, Exercise, Athletes
About these checks
Registry, retraction, Cites and statistics results are computed, not judged, with one exception: a printed reference that no index lists is read once by a model before it counts as a citation error. Claims are extracted by a model and kept only when their quote appears verbatim in the text; each cited source is then checked, with a model’s help, for whether it says what the claim relies on. Those verdicts can be wrong — read the claim’s quote and the cited source before relying on one.
A language model drew the claims from the paper on 2026-11-14, under version 3 of the claim definition (model deepseek-v4.1-flash, prompt extract-v3).
A second model labelled each claim on 2026-11-14 (model jev-1.13-20260917, definition revision gold-guideline-v0.2).
Statistics and arithmetic are recomputed, not judged.
Confidence bands are shown only for fields calibrated on our annotated test set. None is calibrated yet, so no band is shown.
What counts as a claim ›How we measure confidence ›How we check this ›
Are you an author, or do you see a problem with this page? Request a review
Data sources
Bibliographic data: Semantic Scholar, OpenAlex, Crossref.
Contains information from the Semantic Scholar Academic Graph Datasets, made available under the ODC Attribution License (ODC-BY 1.0).
Semantic Scholar’s data is described in: Kinney, R., et al. (2023). The Semantic Scholar Open Data Platform. arXiv:2301.10140.
