

The DOI matches its Crossref record; 76 of the 76 references it cites were found in a registry or an index.
Dendritic cell derived exosomes loaded with immunoregulatory cargo reprogram local immune responses and inhibit degenerative bone disease in vivo
Open accessAbstract
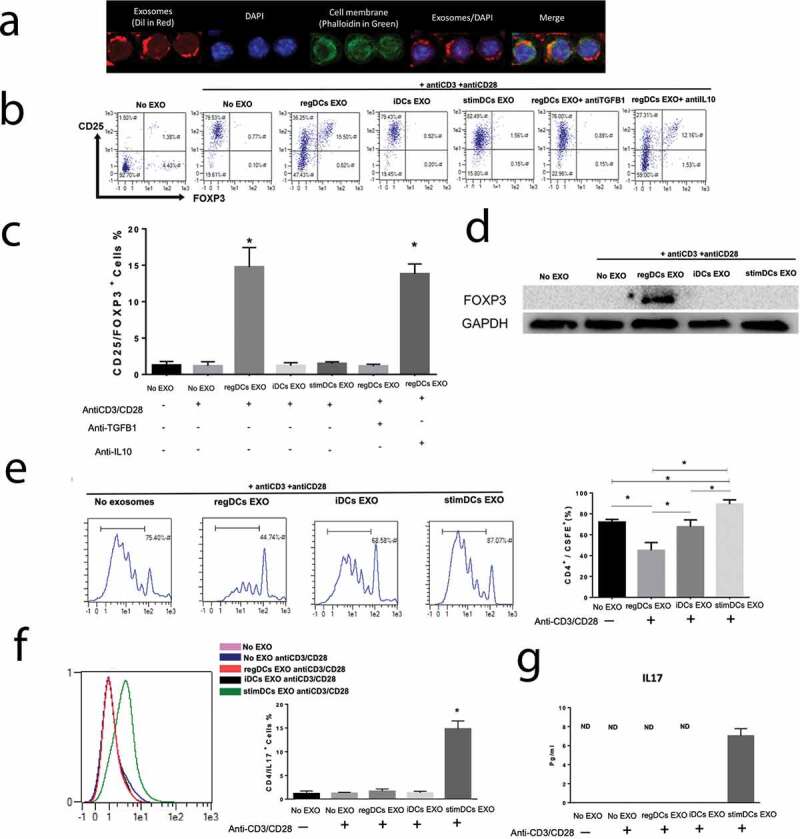
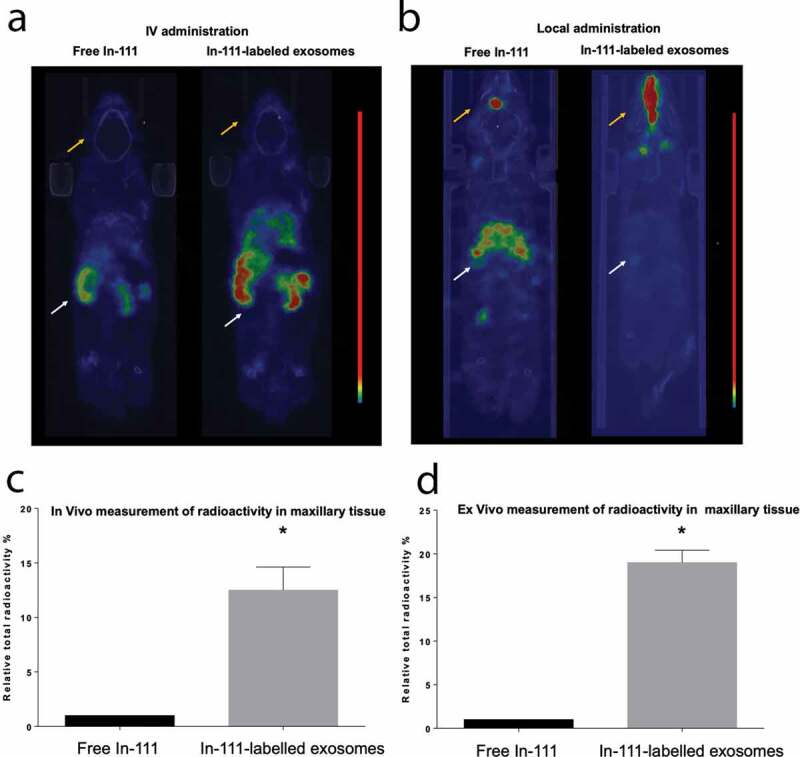
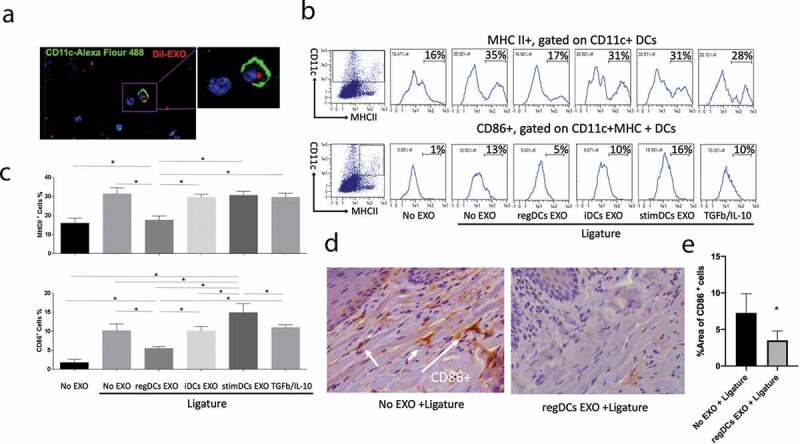
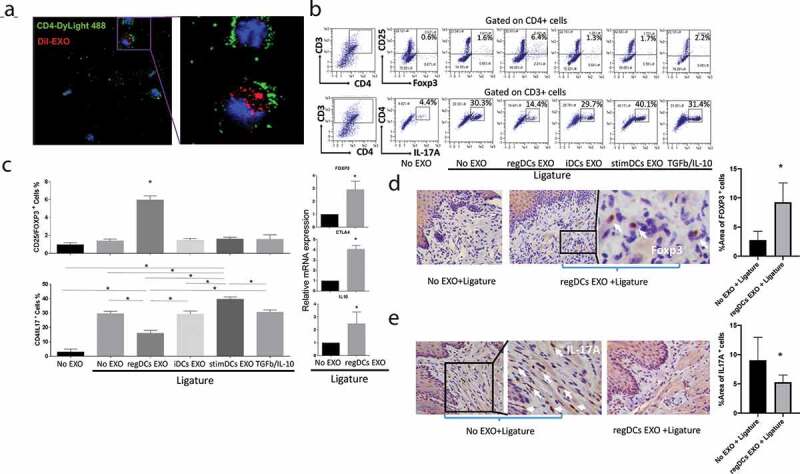
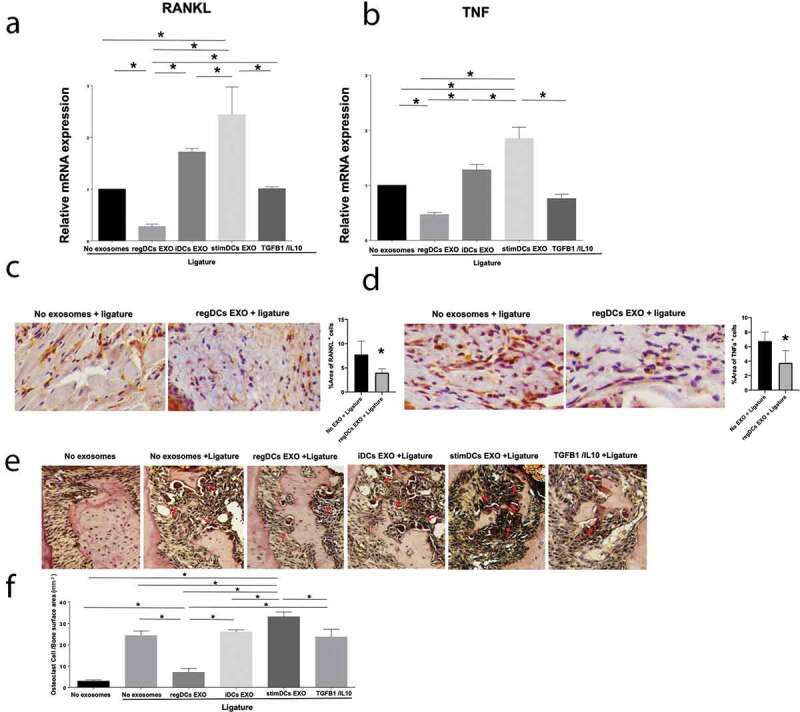
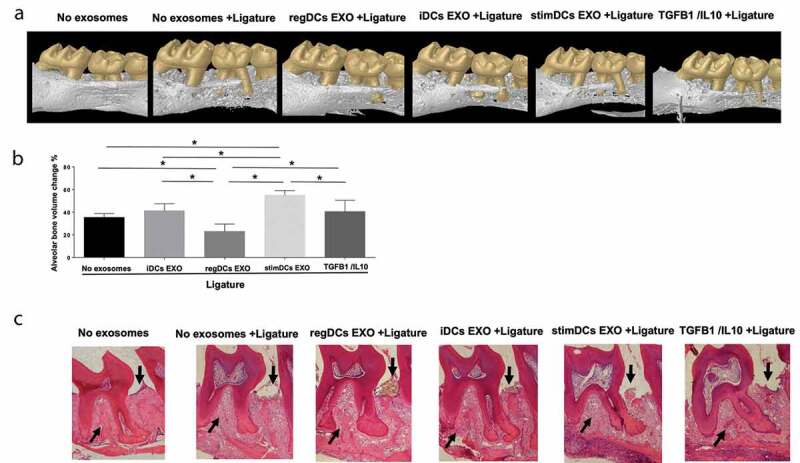
Chronic bone degenerative diseases represent a major threat to the health and well‐being of the population, particularly those with advanced age. This study isolated exosomes (EXO), natural nano‐particles, from dendritic cells, the “directors” of the immune response, to examine the immunobiology of DC EXO in mice, and their ability to reprogram immune cells responsible for experimental alveolar bone loss in vivo . Distinct DC EXO subtypes including immune‐regulatory (regDC EXO), loaded with TGFB1 and IL10 after purification, along with immune stimulatory (stimDC EXO) and immune “null” immature (iDCs EXO) unmodified after purification, were delivered via I.V. route or locally into the soft tissues overlying the alveolar bone. Locally administrated regDC EXO showed high affinity for inflamed sites, and were taken up by both DCs and T cells in situ . RegDC EXO‐encapsulated immunoregulatory cargo (TGFB1 and IL10) was protected from proteolytic degradation. Moreover, maturation of recipient DCs and induction of Th17 effectors was suppressed by regDC EXO, while T‐regulatory cell recruitment was promoted, resulting in inhibition of bone resorptive cytokines and reduction in osteoclastic bone loss. This work is the first demonstration of DC exosome‐based therapy for a degenerative alveolar bone disease and provides the basis for a novel treatment strategy.
Overview
The claims and statistics of this paper haven’t been checked yet.
Run the check — free, no account needed. It reads the open-access text and checks the sources it cites.
Integrity signals
Registry
Cites
Statistics
Figures
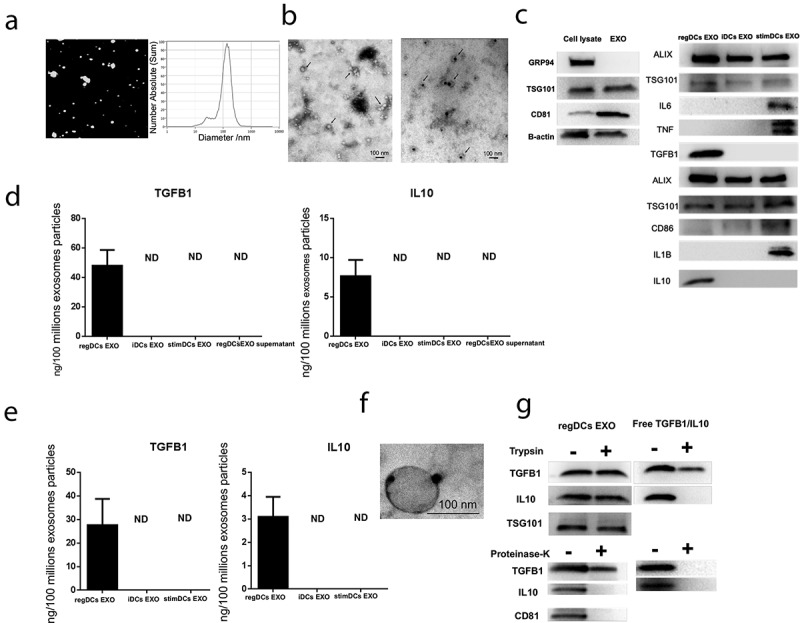
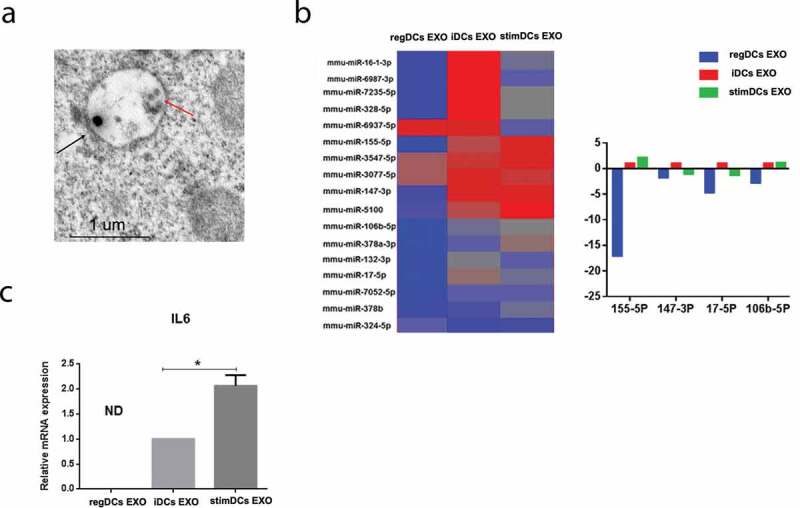
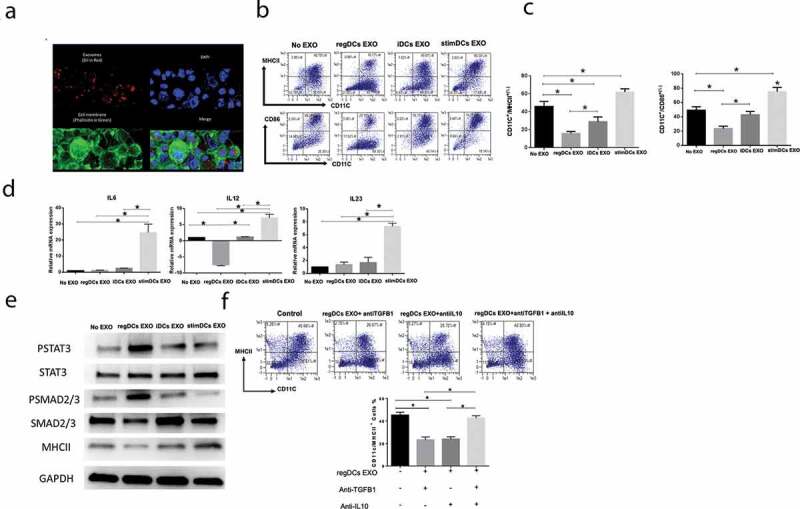
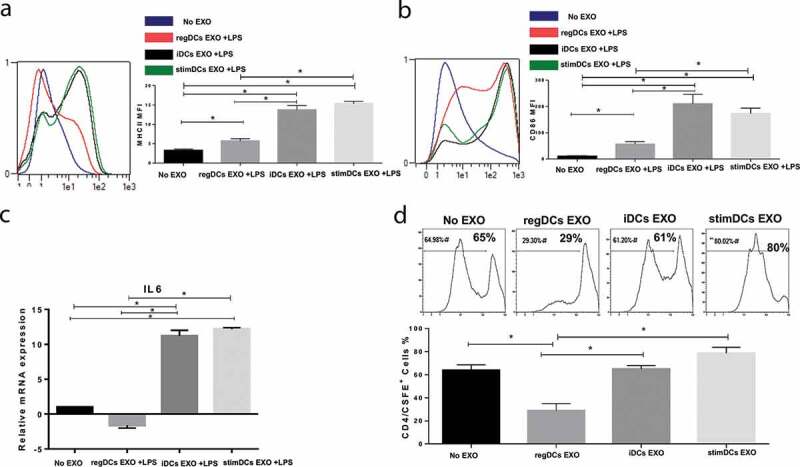
Verification
Claims the paper makes
The claims and statistics of this paper haven’t been checked yet.
Run the check — free, no account needed. It reads the open-access text and checks the sources it cites.
Claims other papers make about this one
Each is checked against this paper’s own text: does it say what the citing paper says it does?
The source backs part of the claim, not all of it — or backs it for a different population, condition or comparison.
In the citing paper
“Pg-induced EXO of the SASP express integrins and lectins that promote cell binding at the inflamed site [19,20].”
From Oral Microbially-Induced Small Extracellular Vesicles Cross the Blood–Brain Barrier (2024) · cites this paper as [20]
Experimental — accuracy not yet measuredThe check wasn’t confident either way, so it gives no verdict — never disputed.
In the citing paper
“Moreover, those EXO are enriched with virulence factors from Pg including gingipains, a potent proteolytic enzyme, enabling them to disrupt barrier functions of the epithelium and penetrate through interstitial spaces and lymphatics to find their way into systemic circulation.”
From Oral Microbially-Induced Small Extracellular Vesicles Cross the Blood–Brain Barrier (2024) · cites this paper as [20]
Experimental — accuracy not yet measured
Self-check
Percentages, sums and reported differences re-computed from the paper’s own numbers.
The self-check needs the paper’s full text.
Citations
Cites
Biogenesis, Secretion, and Intercellular Interactions of Exosomes and Other Extracellular Vesicles
Colombo, M., Raposo, G., & Théry, C. (2014) · Annual Review of Cell and Developmental Biology · doi:10.1146/annurev-cellbio-101512-122326 · Cited by 6,186
Routes and mechanisms of extracellular vesicle uptake
Mulcahy, L. A., Pink, R. C., & Carter, D. R. F. (2014) · Journal of Extracellular Vesicles · doi:10.3402/jev.v3.24641 · Cited by 2,832
Exosomes as drug delivery vehicles for Parkinson’s disease therapy
Haney, M. J., Klyachko, N. L., Zhao, Y., Gupta, R., Plotnikova, E. G., He, Z., Patel, T., Piroyan, A., Sokolsky, M., Kabanov, A. V., et al. (2015) · Journal of Controlled Release · doi:10.1016/j.jconrel.2015.03.033 · Cited by 2,009
Role of interleukin 10 transcriptional regulation in inflammation and autoimmune disease.
Iyer, S. S., & Cheng, G. (2012) · Critical Reviews™ in Immunology · doi:10.1615/critrevimmunol.v32.i1.30 · Cited by 1,611
Sun, D., Zhuang, X., Xiang, X., Liu, Y., Zhang, S., Liu, C., Barnes, S., Grizzle, W. E., Miller, D., & Zhang, H. (2010) · Molecular Therapy · doi:10.1038/mt.2010.105 · Cited by 1,579
Self-citationJonuleit, H., Schmitt, E., Schuler, G., Knop, J., & Enk, A. (2000) · The Journal of Experimental Medicine · doi:10.1084/jem.192.9.1213 · Cited by 1,538
Update on Prevalence of Periodontitis in Adults in the United States: NHANES 2009 – 2012
Eke, P., Dye, B., Wei, L., Slade, G., Thornton-Evans, G., Borgnakke, W., Taylor, G., Page, R., Beck, J., & Genco, R. (2015) · The Journal of Periodontology · doi:10.1902/jop.2015.140520 · Cited by 1,442
Development of exosome-encapsulated paclitaxel to overcome MDR in cancer cells
Kim, M. S., Haney, M. J., Zhao, Y., Mahajan, V., Deygen, I., Klyachko, N. L., Inskoe, E., Piroyan, A., Sokolsky, M., Okolie, O., et al. (2016) · Nanomedicine: Nanotechnology, Biology and Medicine · doi:10.1016/j.nano.2015.10.012 · Cited by 1,410
Zhuang, X., Xiang, X., Grizzle, W., Sun, D., Zhang, S., Axtell, R. C., Ju, S., Mu, J., Zhang, L., Steinman, L., et al. (2011) · Molecular Therapy · doi:10.1038/mt.2011.164 · Cited by 1,356
Escudier, B. J., Dorval, T., Chaput, N., André, F., Caby, M.-P., Novault, S., Flament, C., Leboulaire, C., Borg, C., Amigorena, S., et al. (2005) · Journal of Translational Medicine · doi:10.1186/1479-5876-3-10 · Cited by 1,285
Research works printed but not linked: 1
- 10.1038/ni.2260 · DOI · Paper page
Cited by
Sorted by citations
Li, D., Chen, K., Tang, H., Hu, S., Xin, L., Jing, X., He, Q., Wang, S., Song, J., Mei, L., et al. (2021) · Advanced Materials · doi:10.1002/adma.202108430 · Cited by 327
Unlocking the Power of Exosomes for Crossing Biological Barriers in Drug Delivery
Elliott, R. O., & He, M. (2021) · Pharmaceutics · doi:10.3390/pharmaceutics13010122 · Cited by 268
Zhang, Y., Chen, J., Fu, H., Kuang, S., He, F., Zhang, M., Shen, Z., Qin, W., Lin, Z., & Huang, S. (2021) · International Journal of Oral Science · doi:10.1038/s41368-021-00150-4 · Cited by 185
Extracellular vesicle‐mediated delivery of circDYM alleviates CUS‐induced depressive‐like behaviours
Yu, X., Bai, Y., Han, B., Ju, M., Tang, T., Shen, L., Li, M., Yang, L., Zhang, Z., Hu, G., et al. (2022) · Journal of Extracellular Vesicles · doi:10.1002/jev2.12185 · Cited by 167
Hazrati, A., Soudi, S., Malekpour, K., Mahmoudi, M., Rahimi, A., Hashemi, S. M., & Varma, R. S. (2022) · Biomarker Research · doi:10.1186/s40364-022-00374-4 · Cited by 164
Nanovaccine: an emerging strategy
Das, A., & Ali, N. (2021) · Expert Review of Vaccines · doi:10.1080/14760584.2021.1984890 · Cited by 132
El‐Awady, A., Elashiry, M., Morandini, A. C., Meghil, M. M., & Cutler, C. W. (2022) · Periodontology 2000 · doi:10.1111/prd.12428 · Cited by 90
Self-citationReactive oxygen species-responsive dendritic cell-derived exosomes for rheumatoid arthritis
Lee, E. S., Sul, J. H., Shin, J. M., Shin, S., Lee, J. A., Kim, H. K., Cho, Y. E., Ko, H., Son, S., Lee, J., et al. (2021) · Acta Biomaterialia · doi:10.1016/j.actbio.2021.04.026 · Cited by 88
Extracellular Vesicles: The Next Generation Theranostic Nanomedicine for Inflammatory Bowel Disease
Li, D., Yang, M., Xu, J., Xu, H., Zhu, M., Liang, Y., Zhang, Y., Tian, C., Nie, Y., Shi, R., et al. (2022) · International Journal of Nanomedicine · doi:10.2147/ijn.s370784 · Cited by 76
Biomaterials for in situ cell therapy
Wang, C., Wang, S., Kang, D. D., & Dong, Y. (2023) · BMEMat · doi:10.1002/bmm2.12039 · Cited by 74
Advances of exosomes in periodontitis treatment
Lin, H., Chen, H., Zhao, X., Ding, T., Wang, Y., Chen, Z. B., Tian, Y., Zhang, P., & Shen, Y. (2022) · Journal of Translational Medicine · doi:10.1186/s12967-022-03487-4 · Cited by 74
Oral Versus Gastrointestinal Mucosal Immune Niches in Homeostasis and Allostasis
Suárez, L. J., Arboleda, S., Angelov, N., & Arce, R. M. (2021) · Frontiers in Immunology · doi:10.3389/fimmu.2021.705206 · Cited by 78
Self-citationEngineered extracellular vesicles for bone therapy
Jiang, Y., Li, J., Xu, X. J., Yin, Z., Xu, K., & Su, J. (2022) · Nano Today · doi:10.1016/j.nantod.2022.101487 · Cited by 68
Gurunathan, S., Kang, M.-H., & Kim, J. (2021) · Frontiers in Immunology · doi:10.3389/fimmu.2021.716407 · Cited by 67
Elsayed, R., Elashiry, M., Liu, Y., El-Awady, A., Hamrick, M., & Cutler, C. W. (2021) · Frontiers in Cellular and Infection Microbiology · doi:10.3389/fcimb.2021.669989 · Cited by 64
Self-citationExosomes for Regulation of Immune Responses and Immunotherapy
Hussain, M. W. A., Jahangir, S. R. T., Ghosh, B., Yesmin, F., Anis, A., Satil, S. N., Anwar, F., & Rashid, M. H. (2022) · Journal of Nanotheranostics · doi:10.3390/jnt3010005 · Cited by 64
Self-citationSelective Antimicrobial Therapies for Periodontitis: Win the “Battle and the War”
Elashiry, M., Morandini, A. C., Timothius, C. J. C., Ghaly, M., & Cutler, C. W. (2021) · International Journal of Molecular Sciences · doi:10.3390/ijms22126459 · Cited by 69
Self-citationExtracellular vesicles as next generation immunotherapeutics
Greening, D. W., Xu, R., Ale, A., Hagemeyer, C. E., & Chen, W. (2023) · Seminars in Cancer Biology · doi:10.1016/j.semcancer.2023.02.002 · Cited by 61
PET Imaging of Small Extracellular Vesicles via [ 89 Zr]Zr(oxinate) 4 Direct Radiolabeling
Khan, A. A., Man, F., Faruqu, F. N., Kim, J., Al-Salemee, F., Carrascal-Miniño, A., Volpe, A., Liam‐Or, R., Simpson, P., Fruhwirth, G. O., et al. (2022) · Bioconjugate Chemistry · doi:10.1021/acs.bioconjchem.1c00597 · Cited by 59
Emerging roles of exosomes in oral diseases progression
Wang, J., Jing, J., Zhou, C., & Fan, Y. (2024) · International Journal of Oral Science · doi:10.1038/s41368-023-00274-9 · Cited by 58
Elashiry, M., Elsayed, R., & Cutler, C. W. (2021) · Cells · doi:10.3390/cells11010115 · Cited by 58
Self-citationThe role of extracellular vesicles in periodontitis: pathogenesis, diagnosis, and therapy
Cai, R., Wang, L., Zhang, W., Liu, B., Wu, Y., Pang, J., & Ma, C. (2023) · Frontiers in Immunology · doi:10.3389/fimmu.2023.1151322 · Cited by 57
Liu, H., Liang, J., Zhong, Y., Xiao, G., Efferth, T., Georgiev, M. I., Vargas-De-La-Cruz, C. B., Bajpai, V. K., Caprioli, G., Liu, J., et al. (2021) · Journal of Agricultural and Food Chemistry · doi:10.1021/acs.jafc.1c05134 · Cited by 55
Bone Cell Exosomes and Emerging Strategies in Bone Engineering
Vig, S., & Fernandes, M. H. (2022) · Biomedicines · doi:10.3390/biomedicines10040767 · Cited by 52
The role of exosomal molecular cargo in exosome biogenesis and disease diagnosis
Liu, M., Wen, Z., Zhang, T., Zhang, L., Liu, X., & Wang, M. (2024) · Frontiers in Immunology · doi:10.3389/fimmu.2024.1417758 · Cited by 56
Emerging prospects of extracellular vesicles for brain disease theranostics
Wang, R., Wang, X., Zhang, Y., Zhao, H., Cui, J., Li, J., & Di, L. (2022) · Journal of Controlled Release · doi:10.1016/j.jconrel.2021.12.024 · Cited by 48
Cellular Senescence and Periodontitis: Mechanisms and Therapeutics
Chen, S., Zhou, D., Liu, O., Chen, H., Wang, Y., & Zhou, Y. (2022) · Biology · doi:10.3390/biology11101419 · Cited by 51
Biomimetic and Bioinspired Intervention Strategies for the Treatment of Rheumatoid Arthritis
Han, Y., Pang, X., & Pi, G. (2021) · Advanced Functional Materials · doi:10.1002/adfm.202104640 · Cited by 51
The roles of exosomal immune checkpoint proteins in tumors
Cheng, X., Li, H., Li, R., Yin, L., Zhang, H., Huang, Z., Cheng, Z., Li, J., Wang, Z.-H., & Peng, H. (2021) · Military Medical Research · doi:10.1186/s40779-021-00350-3 · Cited by 48
Boudná, M., Campos, A. D., Vychytilova‐Faltejskova, P., Macháčková, T., Slabý, O., & Součková, K. (2024) · Cell Communication and Signaling · doi:10.1186/s12964-024-01548-3 · Cited by 45
Microenvironment-responsive nanomedicines: a promising direction for tissue regeneration
Xiong, Y., Mi, B., Shahbazi, M., Xia, T., & Xiao, J. (2024) · Military Medical Research · doi:10.1186/s40779-024-00573-0 · Cited by 47
Zhang, E., Phan, P., & Zhao, Z. (2022) · Acta Pharmaceutica Sinica B · doi:10.1016/j.apsb.2022.08.020 · Cited by 42
Methods and Challenges in Purifying Drug‐Loaded Extracellular Vesicles
Auquière, M., Muccioli, G. G., & Rieux, A. D. (2025) · Journal of Extracellular Vesicles · doi:10.1002/jev2.70097 · Cited by 45
Exosomes: a tool for bone tissue engineering
Huber, J., Griffin, M. F., Longaker, M. T., & Quarto, N. (2022) · Tissue Engineering Part B Reviews · doi:10.1089/ten.teb.2020.0246 · Cited by 41
Understanding exosomes: Part 3—therapeutic + diagnostic potential in dentistry
Miron, R. J., Estrin, N. E., Sculean, A., & Zhang, Y. (2024) · Periodontology 2000 · doi:10.1111/prd.12557 · Cited by 43
Elsayed, R., Elashiry, M., Liu, Y., Morandini, A. C., El-Awady, A., Elashiry, M. M., Hamrick, M., & Cutler, C. W. (2023) · Aging and disease · doi:10.14336/ad.2022.0623 · Cited by 40
Self-citationLiu, L., Chen, H., Zhao, X., Han, Q., Xu, Y., Liu, Y., Zhang, A., Li, Y., Zhang, W., Chen, B., et al. (2024) · Materials Today Bio · doi:10.1016/j.mtbio.2024.101410 · Cited by 42
Self-citationHuang, Q., Hsueh, C., Shen, Y., Guo, Y., Huang, J., Zhang, Y., Li, J.-Y., Gong, H., & Zhou, L. F. (2021) · Cancer Letters · doi:10.1016/j.canlet.2021.05.017 · Cited by 37
Biomimetic synthesis and optimization of extracellular vesicles for bone regeneration
Song, X., Xu, L., & Zhang, W. (2023) · Journal of Controlled Release · doi:10.1016/j.jconrel.2023.01.057 · Cited by 35
Meghil, M. M., Ghaly, M., & Cutler, C. W. (2022) · Pathogens · doi:10.3390/pathogens11030328 · Cited by 33
Self-citationRoles of trained immunity in the pathogenesis of periodontitis
Li, Y., Chen, Y., Cai, G., Ni, Q., Geng, Y., Wang, T., Bao, C., Ruan, X., Wang, H., & Sun, W. S. (2023) · Journal of Periodontal Research · doi:10.1111/jre.13158 · Cited by 34
Wang, J., Liu, C., Cutler, J., Ivanovski, S., Lee, R. S., & Han, P. (2024) · Journal of Periodontal Research · doi:10.1111/jre.13283 · Cited by 30
Small Extracellular Vesicles as a New Class of Medicines
Lee, I., Choi, Y., Shin, D.-U., Kwon, M., Kim, S., Jung, H., Nam, G., & Kwon, M. (2023) · Pharmaceutics · doi:10.3390/pharmaceutics15020325 · Cited by 29
Zhu, S., Zhou, J., & Xie, Z. (2024) · Immunity Inflammation and Disease · doi:10.1002/iid3.70011 · Cited by 29
Lai, S., Deng, L., Liu, C., Li, X., Fan, L., Zhu, Y., Yang, Y., & Mu, Y. (2023) · Biotechnology Letters · doi:10.1007/s10529-023-03376-w · Cited by 27
Butyrate Inhibits Dendritic Cell Activation and Alleviates Periodontitis
Wu, L., Luo, Z., Chen, Y., Yan, Z., Fu, J., Jiang, Y., Xu, J., & Liu, Y. (2023) · Journal of Dental Research · doi:10.1177/00220345231187824 · Cited by 26
Self-citationElashiry, M., Elsayed, R., Elashiry, M. M., Rashid, M. H., Ara, R., Arbab, A. S., El‐Awady, A., Hamrick, M. W., Liu, Y., Zhi, W., et al. (2021) · Frontiers in Immunology · doi:10.3389/fimmu.2021.636222 · Cited by 26
Self-citationInfluence of Vitamin D on Periodontal Inflammation: A Review
Meghil, M. M., & Cutler, C. W. (2023) · Pathogens · doi:10.3390/pathogens12091180 · Cited by 25
Self-citationExtracellular vesicles as therapeutic tools in regenerative dentistry
Xia, E. J., Zou, S., Zhao, X., Liu, W., Zhang, Y., & Zhao, I. S. (2024) · Stem Cell Research & Therapy · doi:10.1186/s13287-024-03936-5 · Cited by 24
Engineered Human Dendritic Cell Exosomes as Effective Delivery System for Immune Modulation
Elsayed, R., Elashiry, M., Tran, C., Yang, T., Carroll, A., Liu, Y., Hamrick, M. W., & Cutler, C. W. (2023) · International Journal of Molecular Sciences · doi:10.3390/ijms241411306 · Cited by 23
Self-citationLiu, F., Sun, T., An, Y., Ming, L., Li, Y., Zhou, Z., & Shang, F. (2023) · Frontiers in Bioengineering and Biotechnology · doi:10.3389/fbioe.2023.1050916 · Cited by 34
Nature’s carriers: leveraging extracellular vesicles for targeted drug delivery
Chen, Q., Zheng, Y., Jiang, X., Wang, Y., Chen, Z., & Wu, D. (2024) · Drug Delivery · doi:10.1080/10717544.2024.2361165 · Cited by 25
Extracellular Vesicles for Immunomodulation in Tissue Regeneration
Zhang, K., Liu, L., Shi, K., Zhang, K., Zheng, C., & Jin, Y. J. (2022) · Tissue Engineering Part C Methods · doi:10.1089/ten.tec.2022.0000059 · Cited by 23
Immunomodulatory nanotherapeutic approaches for periodontal tissue regeneration
Xu, T., Xie, K., Wang, C., Ivanovski, S., & Zhou, Y. (2023) · Nanoscale · doi:10.1039/d2nr06149j · Cited by 22
Oral Microbially-Induced Small Extracellular Vesicles Cross the Blood–Brain Barrier
Elashiry, M., Carroll, A., Yuan, J., Liu, Y., Hamrick, M., Cutler, C. W., Wang, Q., & Elsayed, R. (2024) · International Journal of Molecular Sciences · doi:10.3390/ijms25084509 · Cited by 21
“Our study design for Pg-induced experimental PD in mice (PD mice) has been previously published [19,20].”
MethodInfluentialSelf-citationAdvances in the Study of Extracellular Vesicles for Bone Regeneration
Yao, J., Liu, Y., Du, J., Xu, J., Luo, Z., Liu, Y. F., & Guo, L. (2024) · International Journal of Molecular Sciences · doi:10.3390/ijms25063480 · Cited by 24
Self-citationEmerging roles of extracellular vesicles in oral and maxillofacial areas
Wang, Q., Sun, J., Jiang, H., & Yu, M. (2025) · International Journal of Oral Science · doi:10.1038/s41368-024-00341-9 · Cited by 22
Wen, X., He, B., Tang, X., Wang, B., & Chen, Z. (2021) · Molecular Medicine Reports · doi:10.3892/mmr.2021.12425 · Cited by 20
Current perspectives on clinical use of exosomes as novel biomarkers for cancer diagnosis
Yi, X., Chen, J., Huang, D., Feng, S., Yang, T., Li, Z., Wang, X., Zhao, M., Wu, J., & Zhong, T. (2022) · Frontiers in Oncology · doi:10.3389/fonc.2022.966981 · Cited by 21
Rahaman, J., & Mukherjee, D. (2025) · Applied Materials Today · doi:10.1016/j.apmt.2025.102753 · Cited by 19
Nanotherapeutics for microenvironment modulation and immune homeostasis in periodontitis treatment
Zhou, T., Xie, Y., Cheng, A., Wu, J., Yao, Y., Yin, Y., Guo, J., Qiao, W., Mei, L., Cheng, C., et al. (2025) · Biomaterials · doi:10.1016/j.biomaterials.2025.123713 · Cited by 22
Chen, Y., Wang, S., Chen, X., Wu, Z., He, F., & Chen, Q. (2025) · Bone Research · doi:10.1038/s41413-025-00456-7 · Cited by 22
Drug delivery of extracellular vesicles: Preparation, delivery strategies and applications
Lin, S.-W., Tsai, J., & Shyong, Y. (2023) · International Journal of Pharmaceutics · doi:10.1016/j.ijpharm.2023.123185 · Cited by 16
Non-bone-derived exosomes: a new perspective on regulators of bone homeostasis
Wang, P., Shao, W., Li, Z., Wang, B., Lv, X., Huang, Y., & Feng, Y. (2024) · Cell Communication and Signaling · doi:10.1186/s12964-023-01431-7 · Cited by 19
Lee, S. Y., Klingeborn, M., Bulte, J. W. M., Chiu, D. T., Chopp, M., Cutler, C. W., Das, S., Egwuagu, C. E., Fowler, C. D., Hamm‐Alvarez, S. F., et al. (2024) · Journal of Extracellular Vesicles · doi:10.1002/jev2.70023 · Cited by 16
Self-citationEngineered extracellular vesicles: Regulating the crosstalk between the skeleton and immune system
Yu, W.-W., Wan, Q., Wei, Y., Li, Y., Li, Q., Ye, T., Xu, K., Song, J., Lei, C., Wan, M., et al. (2022) · Engineered Regeneration · doi:10.1016/j.engreg.2022.06.004 · Cited by 16
Wang, R., Li, J., Wang, X., Zhang, Y., Zhu, A., Feng, K., Li, J., & Di, L. (2024) · Nano Letters · doi:10.1021/acs.nanolett.4c01678 · Cited by 15
Manni, G., Gargaro, M., Ricciuti, D., Fontana, S., Padiglioni, E., Cipolloni, M., Mazza, T., Rosati, J. D., Veroli, A. D., Mencarelli, G., et al. (2024) · Journal of Extracellular Vesicles · doi:10.1002/jev2.12446 · Cited by 15
Exacerbation of AMD Phenotype in Lasered CNV Murine Model by Dysbiotic Oral Pathogens
Arjunan, P., Swaminathan, R., Yuan, J., Elashiry, M. M., Tawfik, A. M., Al‐Shabrawey, M., Martin, P. M., Thangaraju, M., & Cutler, C. W. (2021) · Antioxidants · doi:10.3390/antiox10020309 · Cited by 16
Self-citationYang, S., Han, C., Wang, Q., Ai, Y., Wang, D., & Song, W. (2025) · Frontiers in Immunology · doi:10.3389/fimmu.2025.1675707 · Cited by 15
Drug Delivery Systems Based on Dendritic-Cell-Derived Exosomes
Chen, L., Zhang, J., Huang, Y., Zhang, X., Zhang, G., Kong, S., Gao, J., Zhang, X., & Ding, B. (2025) · Pharmaceutics · doi:10.3390/pharmaceutics17030326 · Cited by 15
Membrane vesicles nanotheranostic systems: sources, engineering methods, and challenges
Nie, W., Wu, G., Zhong, H., & Xie, H. (2020) · Biomedical Materials · doi:10.1088/1748-605x/abd2c8 · Cited by 14
Liu, C., Liu, X., Li, H., & Kang, Z. (2023) · Frontiers in Cell and Developmental Biology · doi:10.3389/fcell.2023.1173904 · Cited by 12
Zhang, T., Liu, Z., Wei, Y., Lu, J., He, Z., Wu, Z., Liu, M., Li, K., Wang, X., Li, Z., et al. (2025) · Chemical Engineering Journal · doi:10.1016/j.cej.2025.161653 · Cited by 14
Emerging approaches to induce immune tolerance to therapeutic proteins
Noel, J. C., Lagassé, D., Golding, B., & Sauna, Z. E. (2023) · Trends in Pharmacological Sciences · doi:10.1016/j.tips.2023.10.002 · Cited by 13
Wei, D., Li, F., Guo, C., Chen, J., & You, Y. (2025) · Frontiers in Immunology · doi:10.3389/fimmu.2025.1601843 · Cited by 14
The extracellular vesicle-based treatment: a developing strategy for periodontal diseases
Zhang, X., Gao, H., & Lin, L. (2025) · Frontiers in Immunology · doi:10.3389/fimmu.2025.1480292 · Cited by 11
Advances in extracellular vesicle-based nanomedicine for regenerative orthopaedics
Izquierdo, S. G., Pilar, A. F., Rios, J. L., Lim, K. S., Toh, W. S., Liu, C., Gimona, M., Gawlitta, D., & Man, K. (2025) · Journal of Nanobiotechnology · doi:10.1186/s12951-025-03906-w · Cited by 13
Interaction between immuno-stem dual lineages in jaw bone formation and injury repair
Liu, Z., Luo, X., & Xu, R. (2024) · Frontiers in Cell and Developmental Biology · doi:10.3389/fcell.2024.1359295 · Cited by 11
Sharma, S. (2024) · Non-coding RNA Research · doi:10.1016/j.ncrna.2024.05.009 · Cited by 10
Dehghani, L., Owliaee, I., Sadeghian‐Nodoushan, F., & Shojaeian, A. (2024) · Journal of Stem Cells and Regenerative Medicine · doi:10.46582/jsrm.2003003 · Cited by 11
The Role of Senescence in Experimental Periodontitis at the Causal Level: An in Vivo Study
Chu, X., Elashiry, M., Carroll, A., Timothius, C. J. C., Cutler, C. W., & Elsayed, R. (2025) · Cells · doi:10.3390/cells14030226 · Cited by 12
Self-citationExtracellular vesicles as reconfigurable therapeutics for eye diseases: Promises and hurdles
Shekari, F., Abyadeh, M., Meyfour, A., Mirzaei, M., Chitranshi, N., Gupta, V., Graham, S. L., & Salekdeh, G. H. (2023) · Progress in Neurobiology · doi:10.1016/j.pneurobio.2023.102437 · Cited by 10
Exosome odyssey to original line in dental regeneration
Vafaei, S., Mansoori, M., Hashemi, F., & Basiri, M. (2022) · Journal of Oral Biosciences · doi:10.1016/j.job.2022.05.002 · Cited by 8
Targeting immunosuppressor cells with nanoparticles in autoimmunity: How far have we come to?
Ahmad, S., Al-Hatamleh, M. A. I., & Mohamud, R. (2021) · Cellular Immunology · doi:10.1016/j.cellimm.2021.104412 · Cited by 10
Exosome as bioactive nanovesicle for diagnostic and therapeutic applications in periodontitis
Wang, Y., Li, Y., Zhang, Y., Li, C., Lin, Y., Chen, S., & Han, B. (2025) · BMEMat · doi:10.1002/bmm2.70017 · Cited by 9
Advances of exosome regulating‑FXR to repair inflammatory bowel disease (Review)
Muro, P., Jing, C., Qiao, Y., Wang, W., Wang, B., & Mao, F. (2025) · International Journal of Molecular Medicine · doi:10.3892/ijmm.2025.5576 · Cited by 7
Extracellular vesicles in bone aging: therapeutic strategies and applications
Tang, L., Wang, P., Sheng, S., Yang, H., Jiang, Y., Jing, Y., Liu, H., & Su, J. (2025) · Extracellular Vesicles and Circulating Nucleic Acids · doi:10.20517/evcna.2025.58 · Cited by 9
Extracellular vesicles in osteoimmunomodulation: Orchestrating immune-driven bone regeneration
Pol, F., Longoni, A., Levato, R., Gawlitta, D., & Man, K. (2025) · International Journal of Biological Macromolecules · doi:10.1016/j.ijbiomac.2025.149614 · Cited by 7
Lin, Y., Xie, Y., He, Y., Zhang, M., Li, J., & He, J. (2026) · International Journal of Nanomedicine · doi:10.2147/ijn.s568671 · Cited by 7
Xiao, L., Gao, W., Wu, J., Erezuma, I., Dolatshahi‐Pirouz, A., Silva‐Correia, J., Zhou, Y., Sun, A. R., Prasadam, I., Crawford, R., et al. (2025) · Regenerative medicine and dentistry. · doi:10.53941/rmd.2025.100001 · Cited by 6
Matsuda, M., Shimizu, S., Kitatani, K., & Nabe, T. (2022) · Pathogens · doi:10.3390/pathogens11111373 · Cited by 6
Applications of immunomodulatory nanoparticles in dentistry
Sharma, S., & Kishen, A. (2025) · Nanomedicine · doi:10.1080/17435889.2025.2587713 · Cited by 4
Shi, J., Liu, Z., Xie, J., Zhao, Z., Huang, X., & Cao, Z. (2025) · Acta Biomaterialia · doi:10.1016/j.actbio.2025.11.060 · Cited by 4
Luo, D., Liu, J., Ya, L., Ruan, C., Ou, S., Wei, Y., Lin, Q., Huang, Z., & Nong, K. (2026) · Frontiers in Immunology · doi:10.3389/fimmu.2025.1715736 · Cited by 3
Role of exosomes in gastrointestinal physiology and pathophysiology
Wellington, V. N. A., & Singh, S. (2026) · Frontiers in Immunology · doi:10.3389/fimmu.2025.1717977 · Cited by 5
Immune-instructive biomaterials in oral tissue regeneration and therapy
Park, S., Linsley, C. S., Zárubová, J., Wu, B. M., & Li, S. (2026) · Biomaterials · doi:10.1016/j.biomaterials.2026.124232 · Cited by 3
Ghalamghash, R. (2025) · Preprints.org · doi:10.20944/preprints202506.1176.v1 · Cited by 3
Effects of exosomes from different origins on osteoclasts
Meng, Y., Zhu, T., Wang, C., Xia, Q., & Wang, Y. (2025) · Journal of Orthopaedic Surgery and Research · doi:10.1186/s13018-025-06439-y · Cited by 2
Li, W., Yu, Z., Wu, Z., Jia, J., & Chen, G. (2024) · Translational dental research. · doi:10.1016/j.tdr.2024.100004 · Cited by 2
Metadata
- Authors
- Elashiry, M., Elashiry, M. M., Elsayed, R., Rajendran, M., Auersvald, C., Zeitoun, R., Rashid, M. H., Ara, R., Meghil, M. M., Liu, Y., Arbab, A. S., Arce, R. M., Hamrick, M., Elsalanty, M., Brendan, M., Pacholczyk, R., & Cutler, C. W.
- Affiliations
- Ain Shams University (EG)
- Augusta University (US)
- Department of Periodontics Dental College of Georgia at Augusta University GA USA
- The University of Texas Health Science Center at Houston (US)
- Western University of Health Sciences (US)
- Department of Cellular Biology and Anatomy Medical College of Georgia at Augusta University GA USA
- Georgia Cancer Center Augusta GA USA
- Corresponding author
- Cutler, Christopher W.
- ORCID
- Venue
- Journal of Extracellular Vesicles
- Publisher
- Wiley
- Published
- 2020-08-07
- Volume
- 9
- Issue
- 1
- Pages
- 1795362-1795362
- ISSN
- 2001-3078 (ISSN-L)
- PMC
- PMC7480413
- OpenAlex
- W3048286913
- Cited by
- 116
- References
- 76
- Citations by year
- 2026: 13 · 2025: 25 · 2024: 21 · 2023: 16 · 2022: 20 · 2021: 19 · 2020: 2
- FWCI
- 4.62
- Type
- journal article
- Language
- en
- Open access
- gold
- doi.org
- Licence
- Locations
- Journal of Extracellular Vesicles (publishedVersion, cc-by-nc)
- PubMed Central (publishedVersion, cc-by-nc)
- PubMed (publishedVersion)
- Digital Commons-TMC (Texas Medical Center) (submittedVersion)
- DOAJ (DOAJ: Directory of Open Access Journals) (submittedVersion, cc-by-sa)
- Funders
- Carlos and Marguerite Mason Trust (1)
- NIH-NIDCR (R01 DE014328)
- Topics
- Life Sciences › Biochemistry, Genetics and Molecular Biology › Molecular Biology › Extracellular vesicles in disease
- Life Sciences › Biochemistry, Genetics and Molecular Biology › Molecular Biology › Bone Metabolism and Diseases
- Life Sciences › Biochemistry, Genetics and Molecular Biology › Cell Biology › Mesenchymal stem cell research
- Keywords
- exosome therapy, alveolar bone loss, TGF-β1, IL-10, Th17 cells, regulatory T cells, osteoclasts, bone resorption, extracellular vesicles, local delivery, dendritic cell maturation
About these checks
Registry, retraction, Cites and statistics results are computed, not judged, with one exception: a printed reference that no index lists is read once by a model before it counts as a citation error. Claims are extracted by a model and kept only when their quote appears verbatim in the text; each cited source is then checked, with a model’s help, for whether it says what the claim relies on. Those verdicts can be wrong — read the claim’s quote and the cited source before relying on one.
Statistics and arithmetic are recomputed, not judged.
Confidence bands are shown only for fields calibrated on our annotated test set. None is calibrated yet, so no band is shown.
What counts as a claim ›How we measure confidence ›How we check this ›
Are you an author, or do you see a problem with this page? Request a review
